| Param | Original file | Final file |
|---|---|---|
| Filename | modeM0/AS1A14_125T09_9000006578_57684cztM0_level2.fits | modeM0/AS1A14_125T09_9000006578_57684cztM0_level2_quad_clean.evt |
| Size (bytes) | 448,666,560 | 83,782,080 |
| Size | 427.9 MB | 79.9 MB |
| Events in quadrant A | 2,527,605 | 587,303 |
| Events in quadrant B | 5,981,737 | 487,388 |
| Events in quadrant C | 3,807,395 | 545,041 |
| Events in quadrant D | 3,848,113 | 519,007 |
| Mode M9 | |||
|---|---|---|---|
| Quadrant | BADHDUFLAG | Total packets | Discarded packets |
| A | 0 | 12 | 0 |
| B | 0 | 12 | 0 |
| C | 0 | 12 | 0 |
| D | 0 | 12 | 0 |
| Mode SS | |||
|---|---|---|---|
| Quadrant | BADHDUFLAG | Total packets | Discarded packets |
| A | 0 | 116 | 0 |
| B | 0 | 116 | 0 |
| C | 0 | 116 | 0 |
| D | 0 | 116 | 0 |
| Mode M0 | |||
|---|---|---|---|
| Quadrant | BADHDUFLAG | Total packets | Discarded packets |
| A | 0 | 11679 | 1 |
| B | 0 | 21711 | 2 |
| C | 0 | 15128 | 1 |
| D | 0 | 15375 | 1 |
| Quadrant | Total seconds | Saturated seconds | Saturation percentage |
|---|---|---|---|
| A | 5695 | 55 | 0.965759% |
| B | 5694 | 1463 | 25.693713% |
| C | 5695 | 269 | 4.723442% |
| D | 5695 | 163 | 2.862160% |
Noise dominated data is calculated using 1-second bins in cleaned event files. If a bin has >2000 counts, and if more than 50% of those come from <1% of pixels, then it is considered to be noise-dominated and hence unusable.
| Quadrant | # 1 sec bins | Bins with >0 counts | Bins with >2000 counts | High rate bins dominated by noise | Noise dominated (total time) | Noise dominated (detector-on time) | Marked lightcurve |
|---|---|---|---|---|---|---|---|
| A | 6890 | 5696 | 9 | 9 | 0.13% | 0.16% | 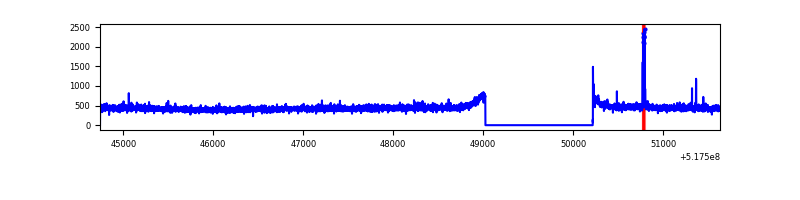 |
| B | 6889 | 5695 | 1110 | 1110 | 16.11% | 19.49% | 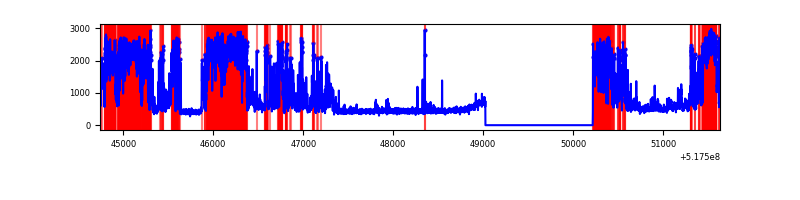 |
| C | 6890 | 5696 | 197 | 197 | 2.86% | 3.46% | 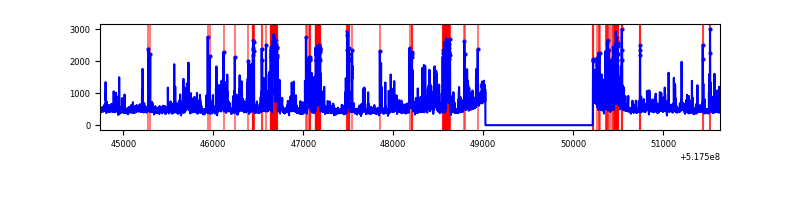 |
| D | 6890 | 5696 | 131 | 131 | 1.90% | 2.30% | 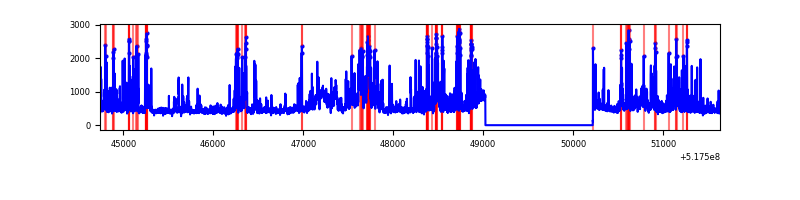 |
Top three noisy pixels from each quadrant. If the there are fewer than three noisy pixels in the level2.evt file, extra rows are filled as -1
| Pixel properties | Quadrant properties | ||||||
|---|---|---|---|---|---|---|---|
| Quadrant | DetID | PixID | Counts | Sigma | Mean | Median | Sigma |
| A | 7 | 223 | 36221 | 224.76 | 640 | 623 | 158.4 |
| A | 3 | 14 | 9343 | 55.06 | 640 | 623 | 158.4 |
| A | 3 | 137 | 7410 | 42.85 | 640 | 623 | 158.4 |
| B | 5 | 185 | 3639401 | 30885.37 | 552 | 531 | 117.8 |
| B | 10 | 16 | 44683 | 374.75 | 552 | 531 | 117.8 |
| B | 0 | 213 | 37787 | 316.22 | 552 | 531 | 117.8 |
| C | 15 | 224 | 765752 | 4574.93 | 617 | 610 | 167.2 |
| C | 12 | 254 | 407160 | 2430.84 | 617 | 610 | 167.2 |
| C | 12 | 2 | 75038 | 445.02 | 617 | 610 | 167.2 |
| D | 8 | 160 | 824422 | 4737.08 | 619 | 591 | 173.9 |
| D | 2 | 120 | 263714 | 1512.97 | 619 | 591 | 173.9 |
| D | 8 | 240 | 196658 | 1127.4 | 619 | 591 | 173.9 |
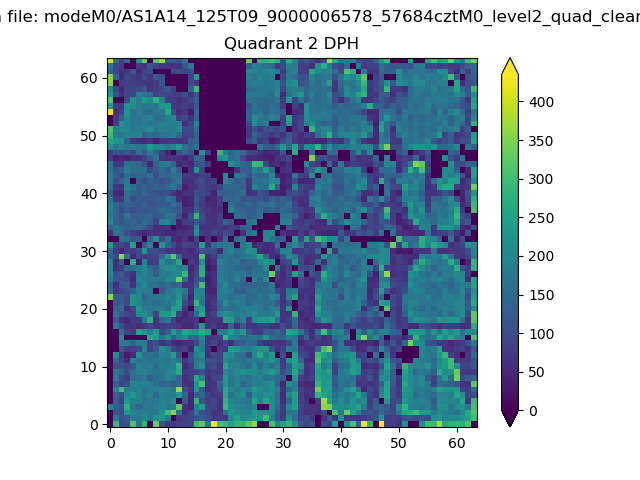
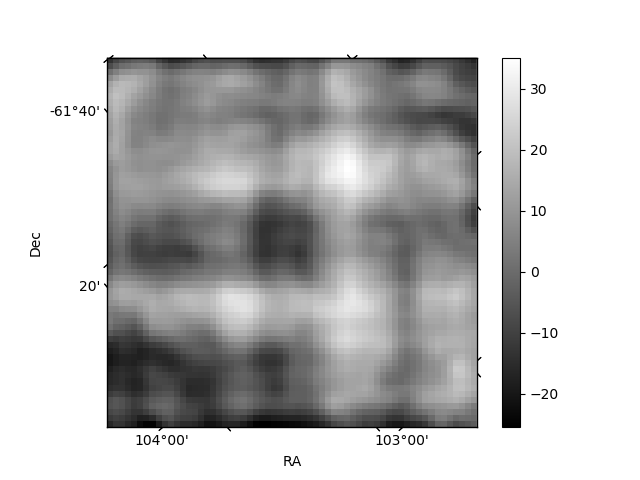
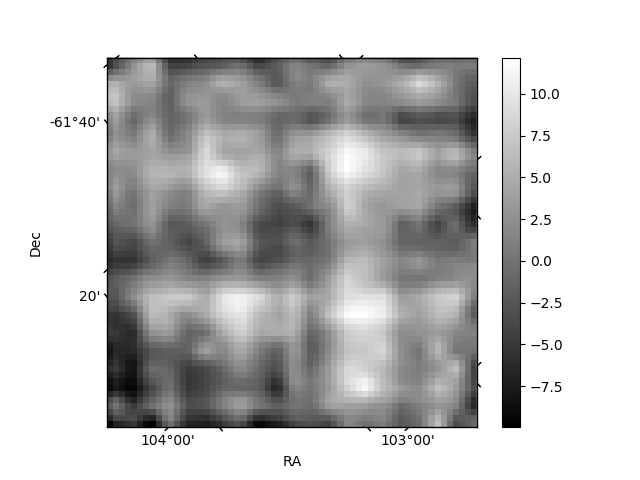
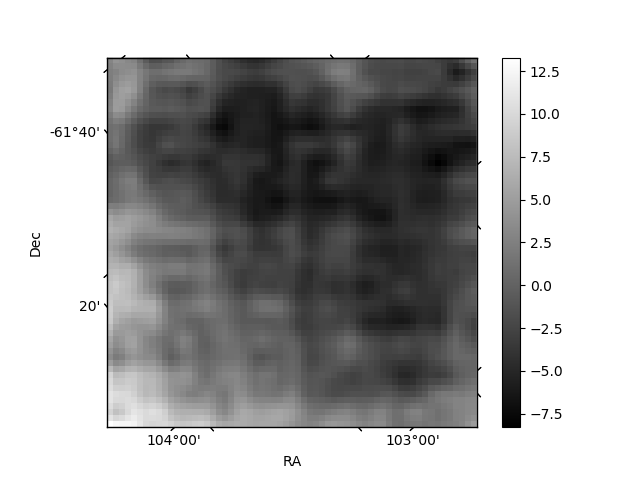
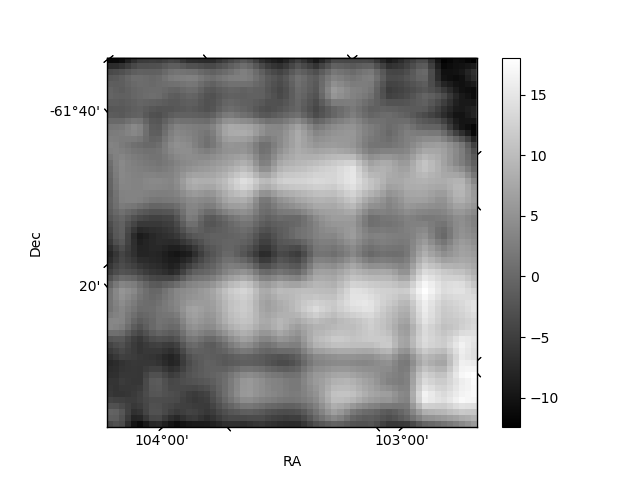
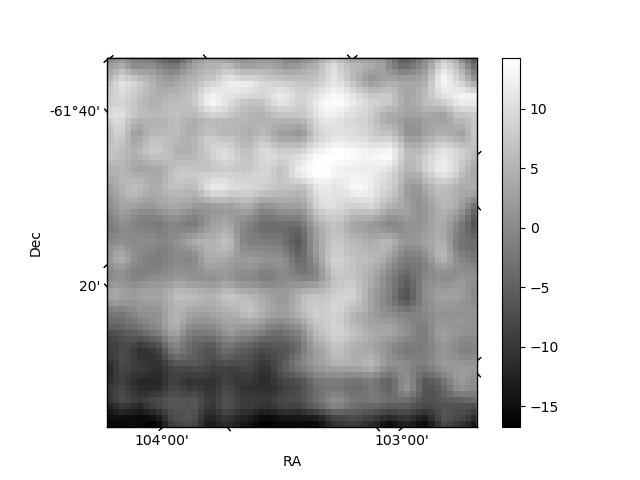
Histogram calculated using DETX and DETY for each event in the final _common_clean file
| Quadrant A | 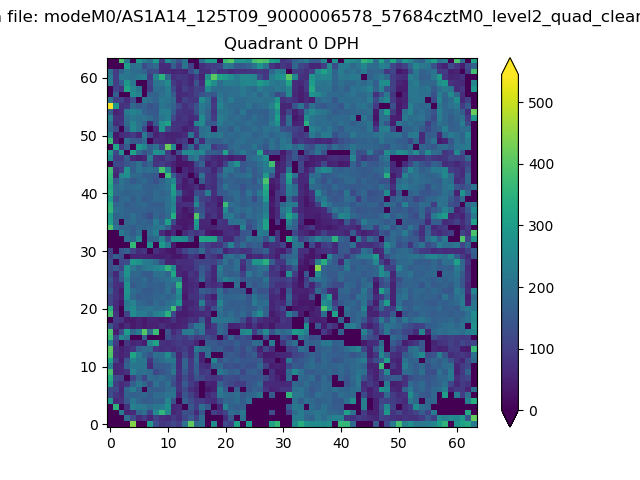 |
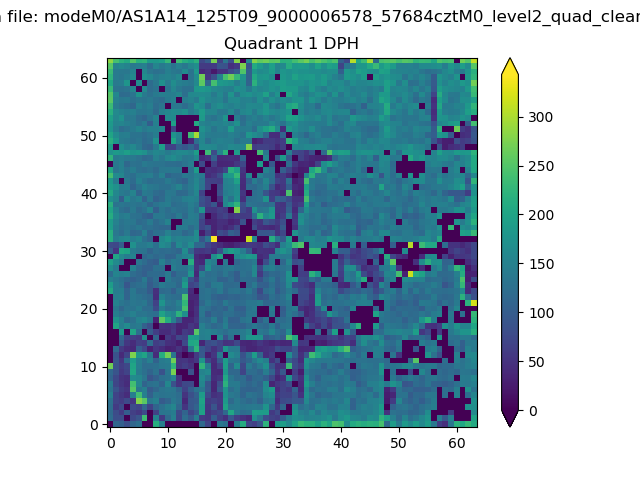 |
Quadrant B |
|---|---|---|---|
| Quadrant D | 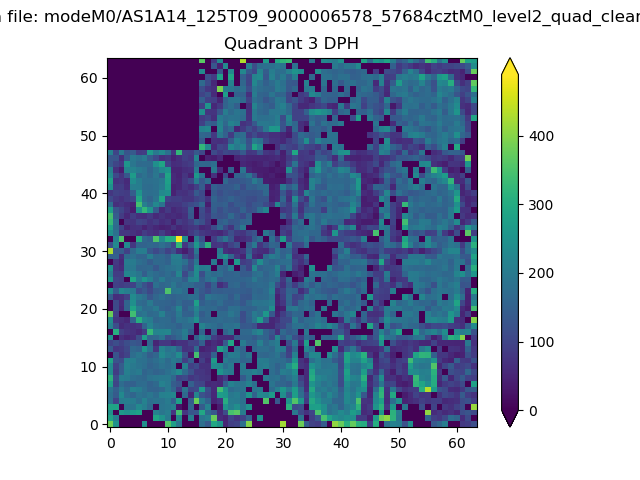 |
 |
Quadrant C |
| Plot type | Count rate plots | Images |
|---|---|---|
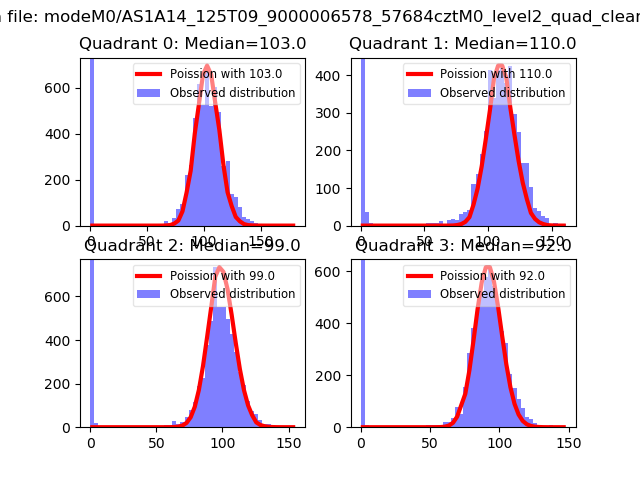
| Comparison with Poisson distribution Blue bars denote a histogram of data divided into 1 sec bins. Red curve is a Poisson curve with rate = median count rate of data. |
 |
 |
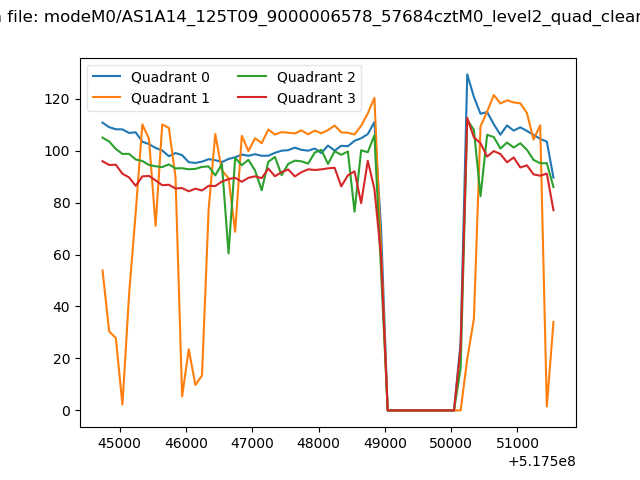
| Quadrant-wise count rates Data is divided into 100 sec bins |
 |
|
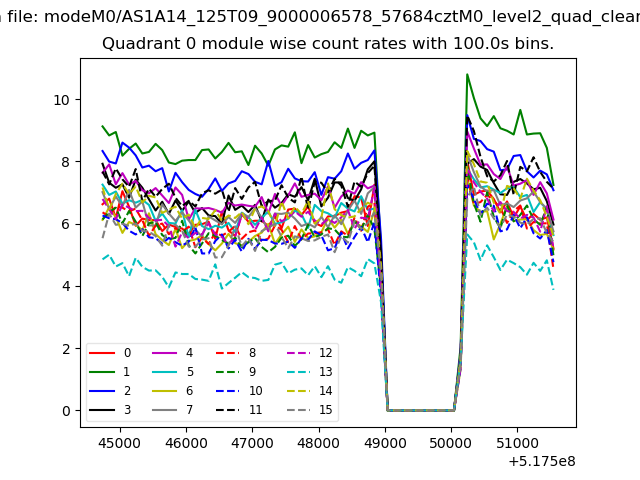
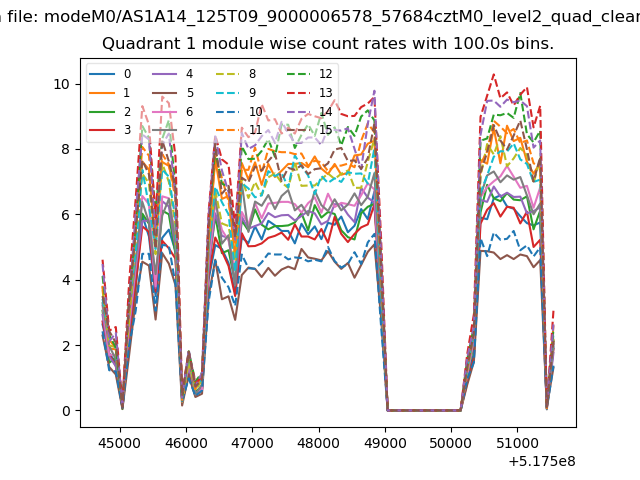
| Module-wise count rates for Quadrant A Data is divided into 100 sec bins |
 |
 |
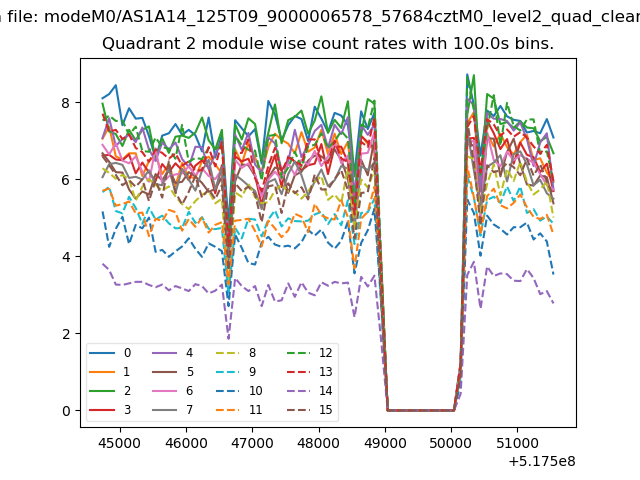
| Module-wise count rates for Quadrant B Data is divided into 100 sec bins |
 |
 |
| Module-wise count rates for Quadrant C Data is divided into 100 sec bins |
 |
 |
| Module-wise count rates for Quadrant D Data is divided into 100 sec bins |
 |
 |
| Parameter | Plot |
|---|---|
| CZT HV Monitor | 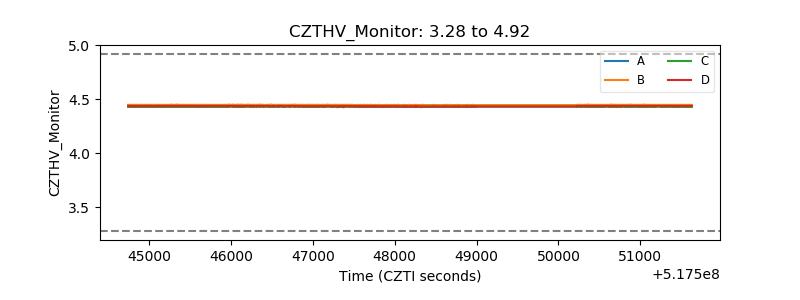 |
| D_VDD | 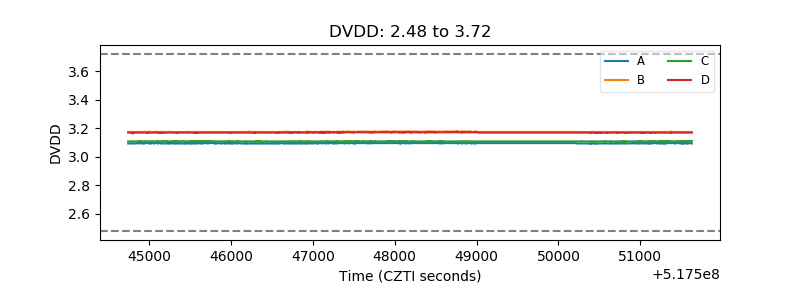 |
| Temperature 1 | 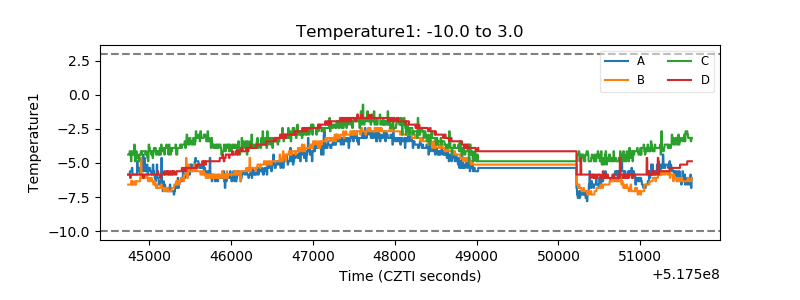 |
| Veto HV Monitor | 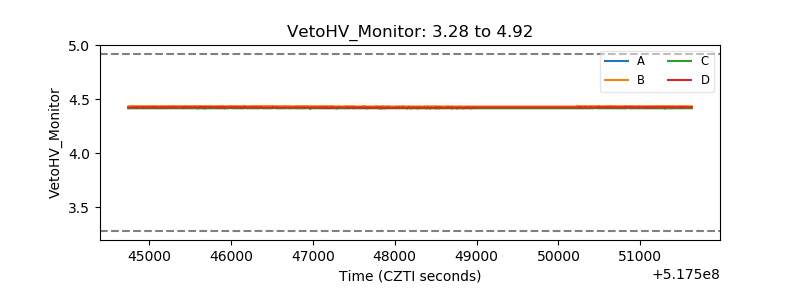 |
| Veto LLD | 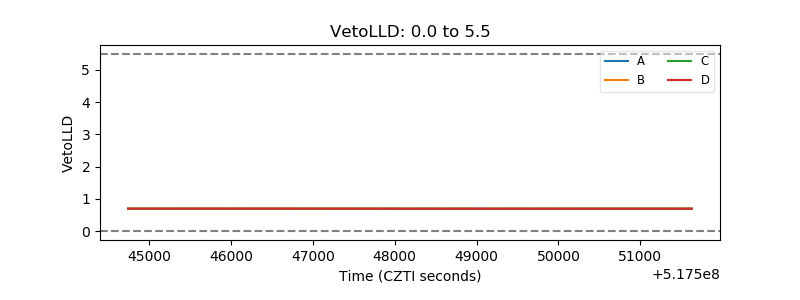 |
| Alpha Counter | 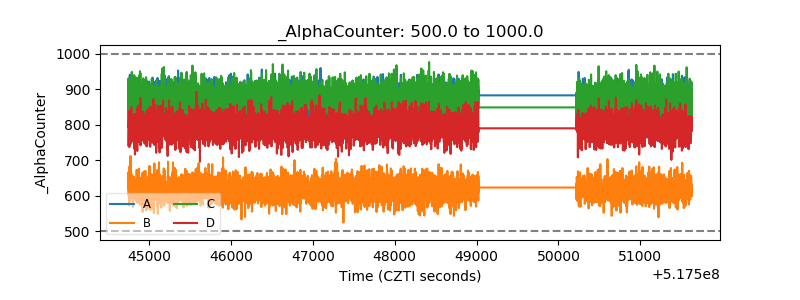 |
| _CPM_Rate | 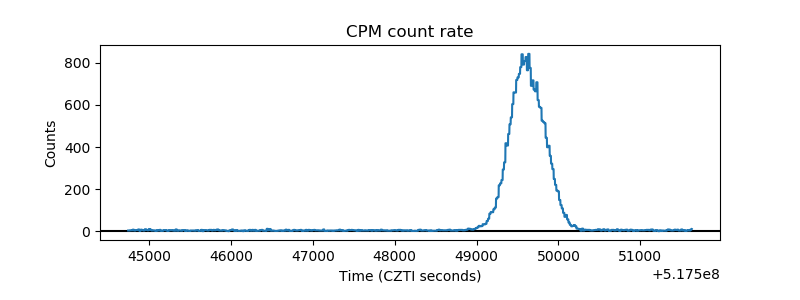 |
| CZT Counter | 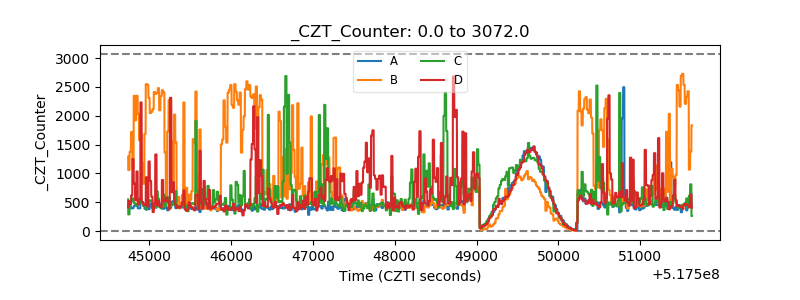 |
| +2.5 Volts monitor | 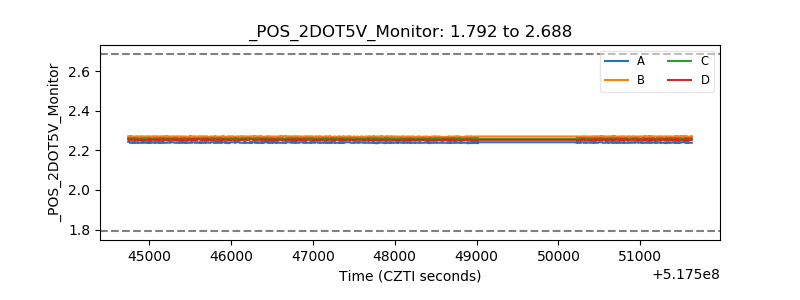 |
| +5 Volts monitor | 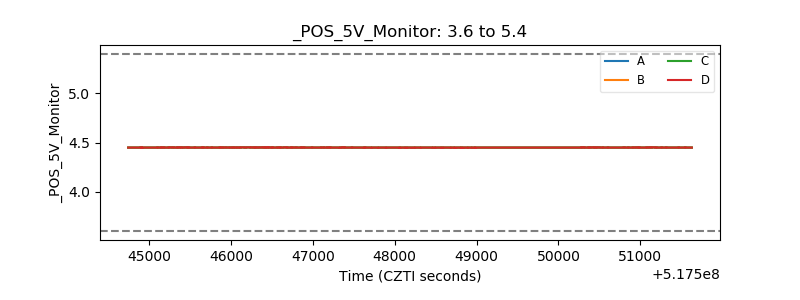 |
| _ROLL_ROT | 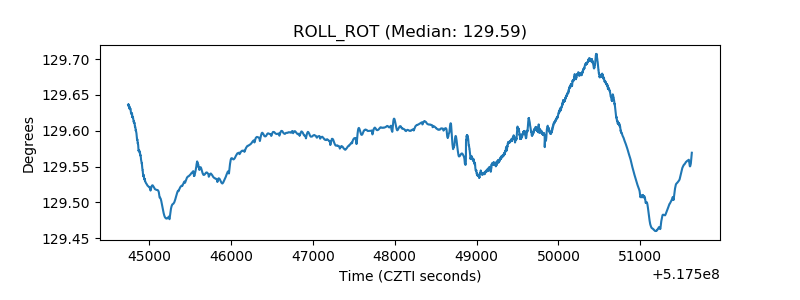 |
| _Roll_DEC | 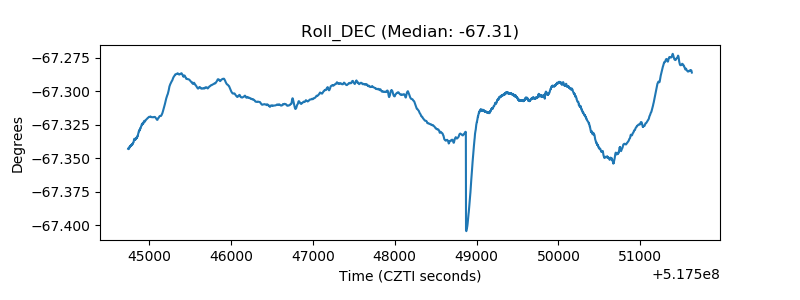 |
| _Roll_RA | 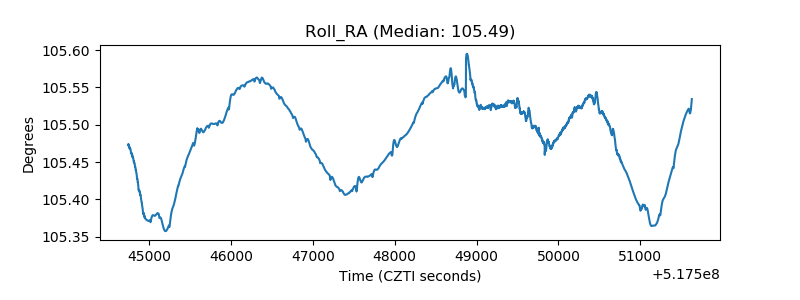 |
| Veto Counter | 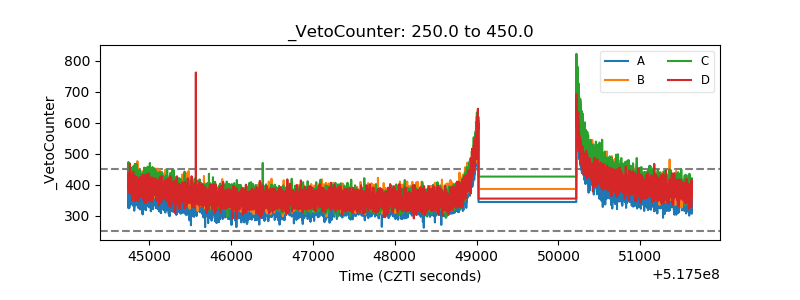 |