| Param | Original file | Final file |
|---|---|---|
| Filename | modeM0/AS1A14_125T09_9000006578_57686cztM0_level2.fits | modeM0/AS1A14_125T09_9000006578_57686cztM0_level2_quad_clean.evt |
| Size (bytes) | 470,695,680 | 90,737,280 |
| Size | 448.9 MB | 86.5 MB |
| Events in quadrant A | 2,845,012 | 612,553 |
| Events in quadrant B | 3,902,163 | 642,577 |
| Events in quadrant C | 4,301,826 | 568,041 |
| Events in quadrant D | 5,889,789 | 488,594 |
| Mode M9 | |||
|---|---|---|---|
| Quadrant | BADHDUFLAG | Total packets | Discarded packets |
| A | 0 | 9 | 0 |
| B | 0 | 9 | 0 |
| C | 0 | 9 | 0 |
| D | 0 | 9 | 0 |
| Mode SS | |||
|---|---|---|---|
| Quadrant | BADHDUFLAG | Total packets | Discarded packets |
| A | 0 | 128 | 0 |
| B | 0 | 128 | 0 |
| C | 0 | 128 | 0 |
| D | 0 | 128 | 0 |
| Mode M0 | |||
|---|---|---|---|
| Quadrant | BADHDUFLAG | Total packets | Discarded packets |
| A | 0 | 12918 | 1 |
| B | 0 | 16051 | 1 |
| C | 0 | 17107 | 1 |
| D | 0 | 21785 | 1 |
| Quadrant | Total seconds | Saturated seconds | Saturation percentage |
|---|---|---|---|
| A | 6238 | 74 | 1.186278% |
| B | 6239 | 345 | 5.529732% |
| C | 6239 | 362 | 5.802212% |
| D | 6239 | 834 | 13.367527% |
Noise dominated data is calculated using 1-second bins in cleaned event files. If a bin has >2000 counts, and if more than 50% of those come from <1% of pixels, then it is considered to be noise-dominated and hence unusable.
| Quadrant | # 1 sec bins | Bins with >0 counts | Bins with >2000 counts | High rate bins dominated by noise | Noise dominated (total time) | Noise dominated (detector-on time) | Marked lightcurve |
|---|---|---|---|---|---|---|---|
| A | 7178 | 6240 | 2 | 2 | 0.03% | 0.03% | 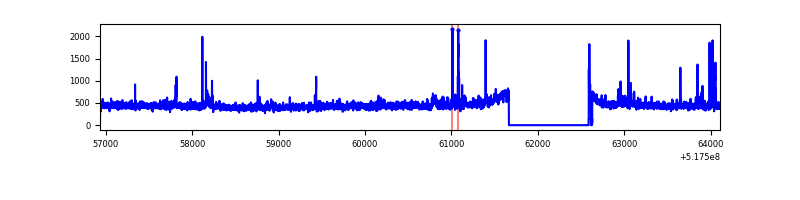 |
| B | 7179 | 6241 | 152 | 152 | 2.12% | 2.44% | 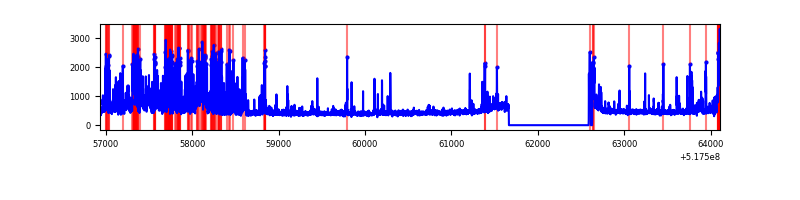 |
| C | 7179 | 6241 | 229 | 229 | 3.19% | 3.67% | 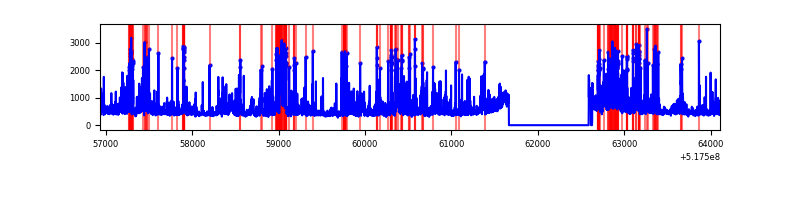 |
| D | 7179 | 6241 | 706 | 706 | 9.83% | 11.31% | 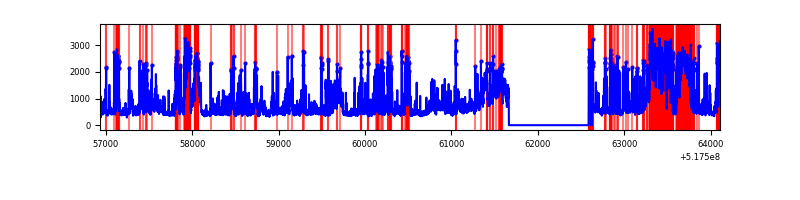 |
Top three noisy pixels from each quadrant. If the there are fewer than three noisy pixels in the level2.evt file, extra rows are filled as -1
| Pixel properties | Quadrant properties | ||||||
|---|---|---|---|---|---|---|---|
| Quadrant | DetID | PixID | Counts | Sigma | Mean | Median | Sigma |
| A | 3 | 14 | 100809 | 596.89 | 685 | 669 | 167.8 |
| A | 3 | 245 | 36912 | 216.03 | 685 | 669 | 167.8 |
| A | 3 | 94 | 21929 | 126.72 | 685 | 669 | 167.8 |
| B | 5 | 185 | 1031332 | 7238.9 | 667 | 640 | 142.4 |
| B | 10 | 16 | 66331 | 461.37 | 667 | 640 | 142.4 |
| B | 10 | 246 | 54220 | 376.31 | 667 | 640 | 142.4 |
| C | 15 | 224 | 614117 | 3427.11 | 659 | 652 | 179.0 |
| C | 6 | 223 | 347275 | 1936.4 | 659 | 652 | 179.0 |
| C | 14 | 254 | 272522 | 1518.79 | 659 | 652 | 179.0 |
| D | 8 | 240 | 1561121 | 8821.84 | 628 | 598 | 176.9 |
| D | 8 | 160 | 1445294 | 8167.05 | 628 | 598 | 176.9 |
| D | 2 | 120 | 114335 | 642.97 | 628 | 598 | 176.9 |
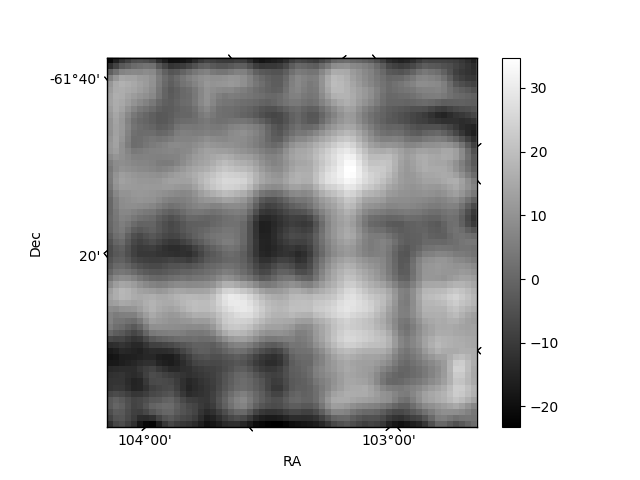
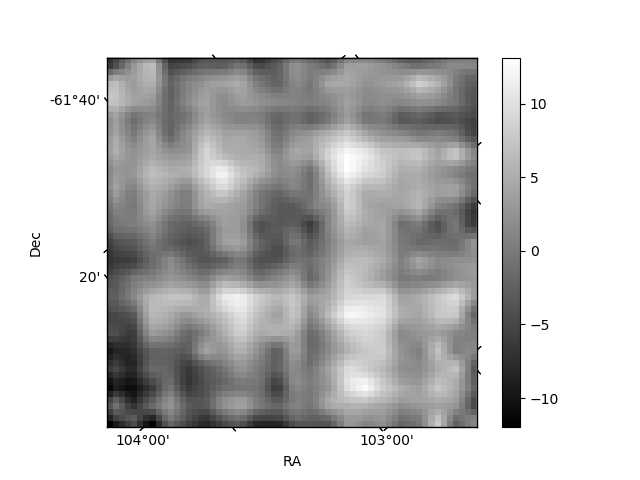
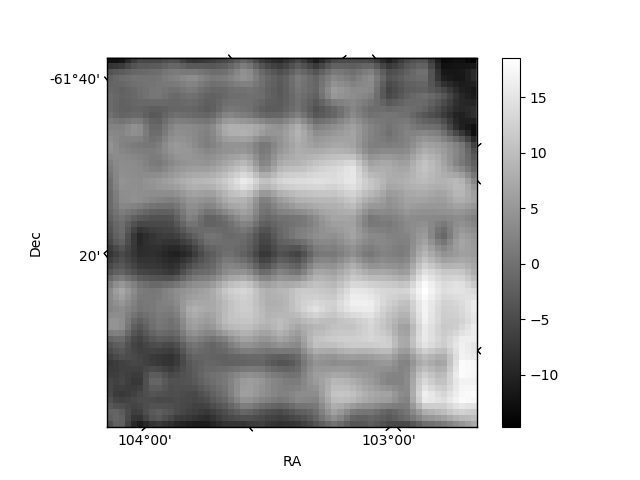
Histogram calculated using DETX and DETY for each event in the final _common_clean file
| Quadrant A | 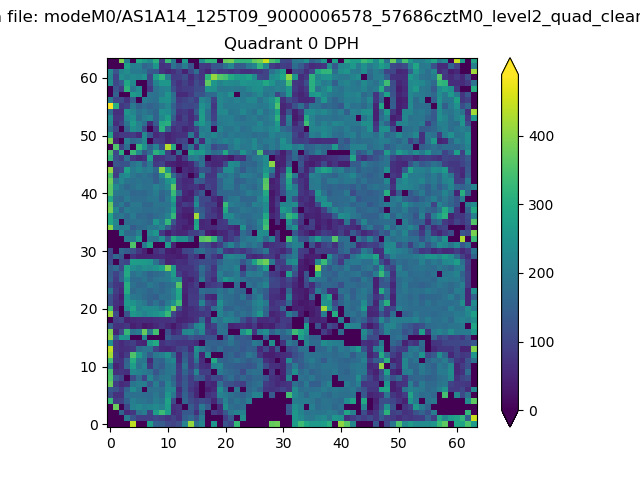 |
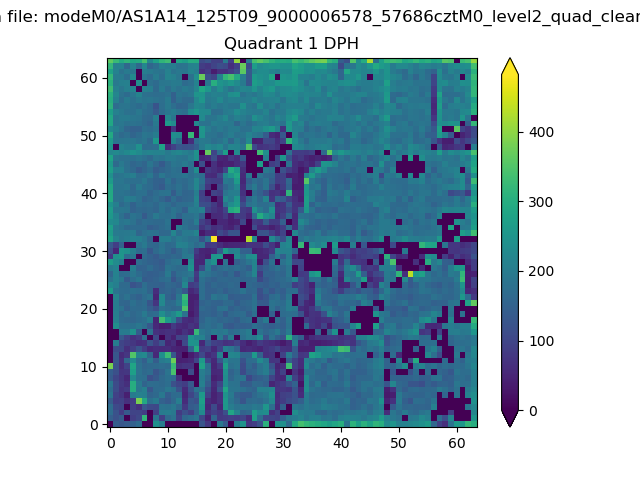 |
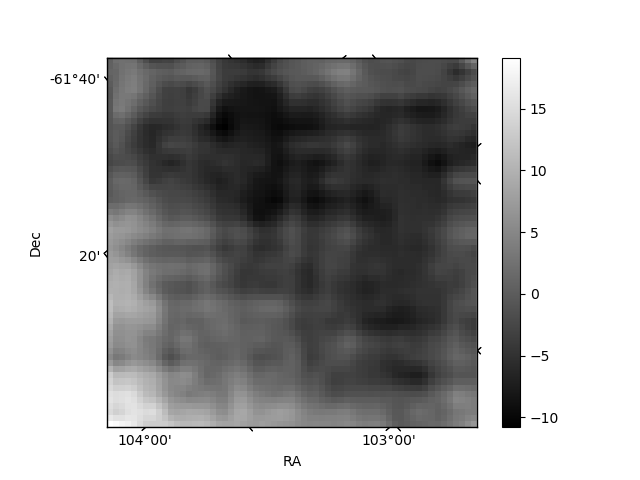
Quadrant B |
|---|---|---|---|
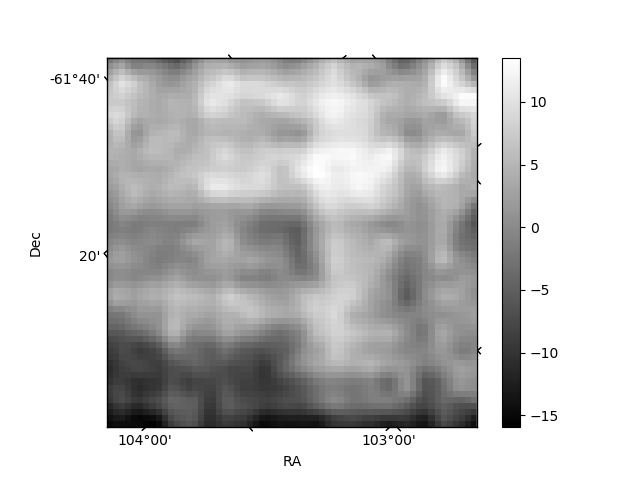
| Quadrant D | 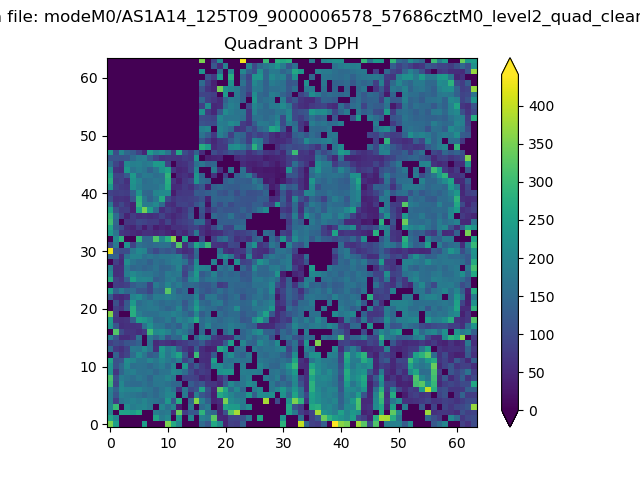 |
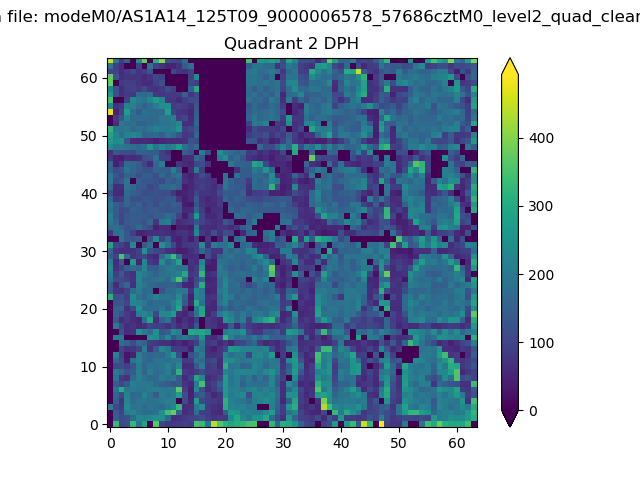 |
Quadrant C |
| Plot type | Count rate plots | Images |
|---|---|---|
| Comparison with Poisson distribution Blue bars denote a histogram of data divided into 1 sec bins. Red curve is a Poisson curve with rate = median count rate of data. |
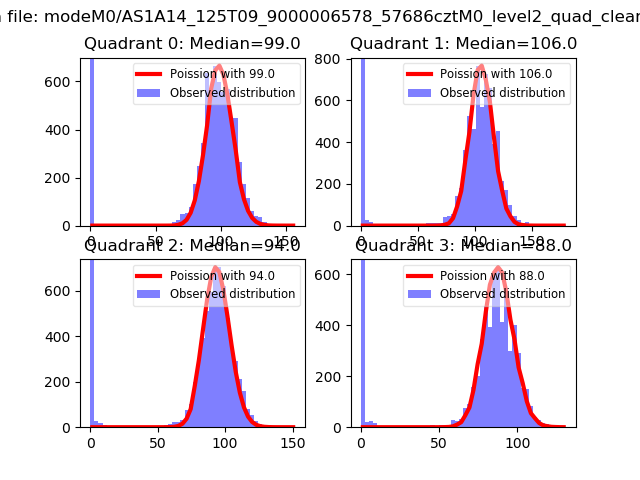 |
 |
| Quadrant-wise count rates Data is divided into 100 sec bins |
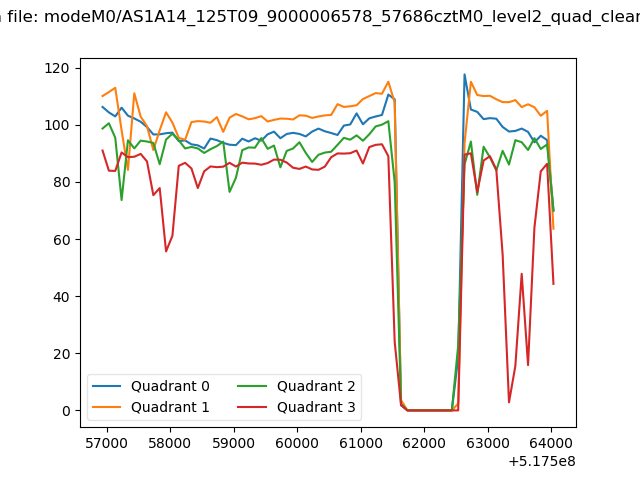 |
|
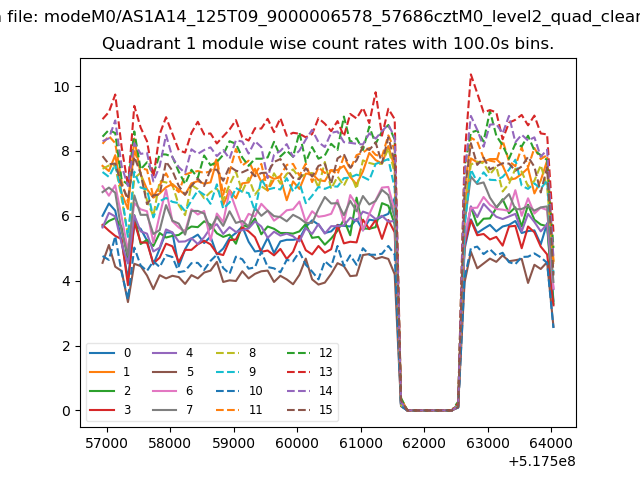
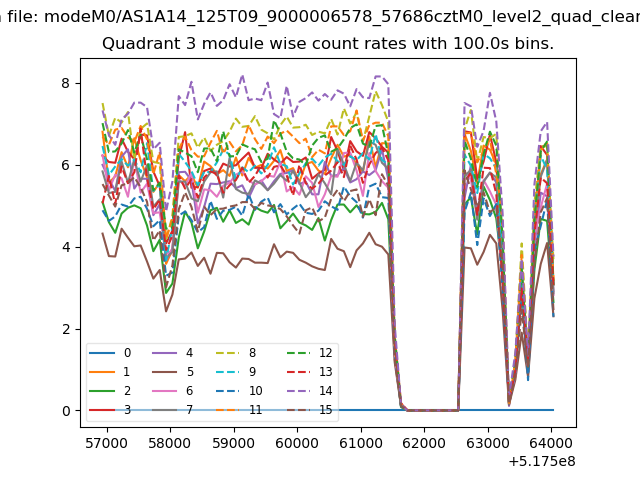
| Module-wise count rates for Quadrant A Data is divided into 100 sec bins |
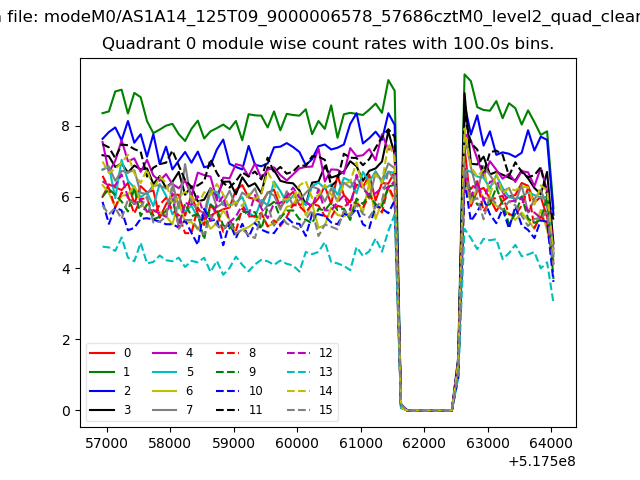 |
 |
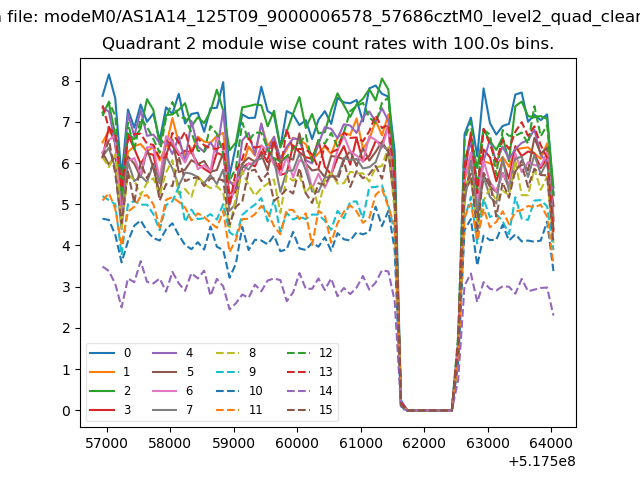
| Module-wise count rates for Quadrant B Data is divided into 100 sec bins |
 |
 |
| Module-wise count rates for Quadrant C Data is divided into 100 sec bins |
 |
 |
| Module-wise count rates for Quadrant D Data is divided into 100 sec bins |
 |
 |
| Parameter | Plot |
|---|---|
| CZT HV Monitor | 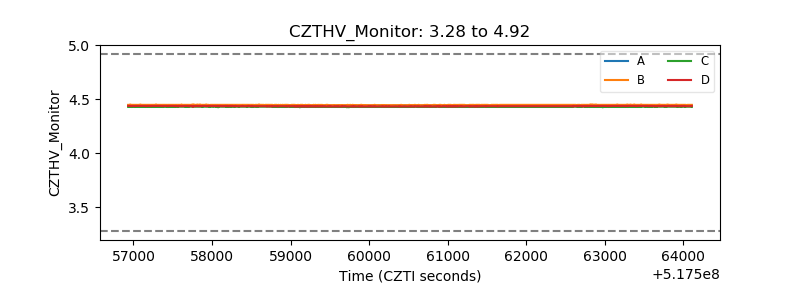 |
| D_VDD | 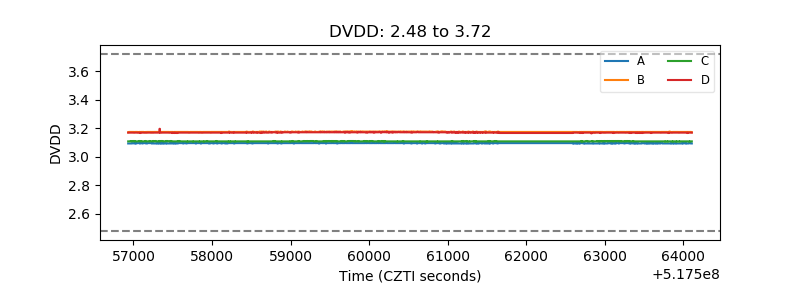 |
| Temperature 1 | 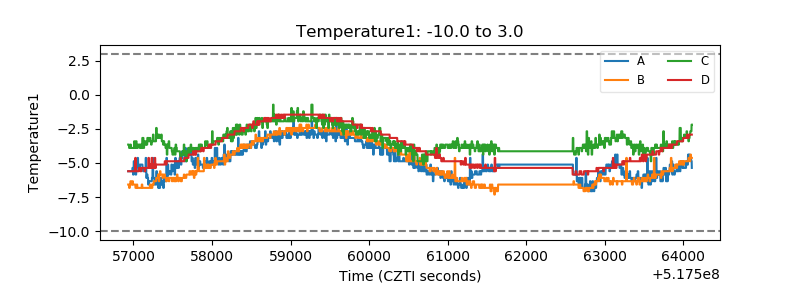 |
| Veto HV Monitor | 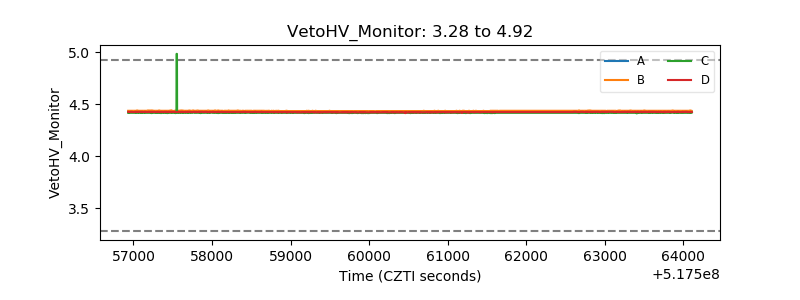 |
| Veto LLD | 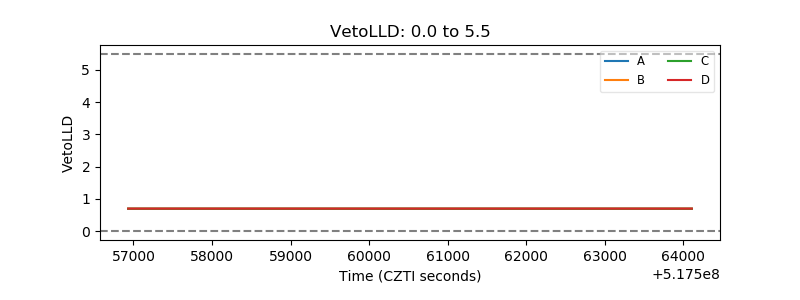 |
| Alpha Counter | 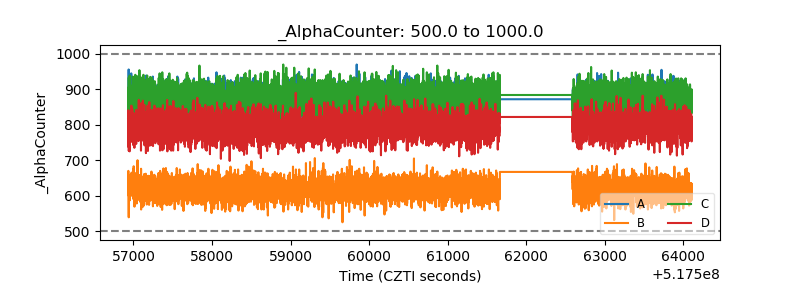 |
| _CPM_Rate | 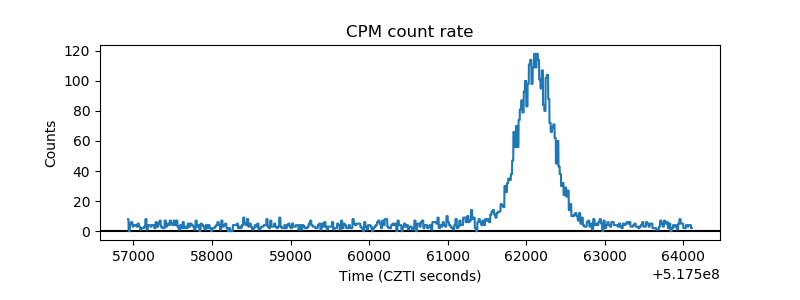 |
| CZT Counter | 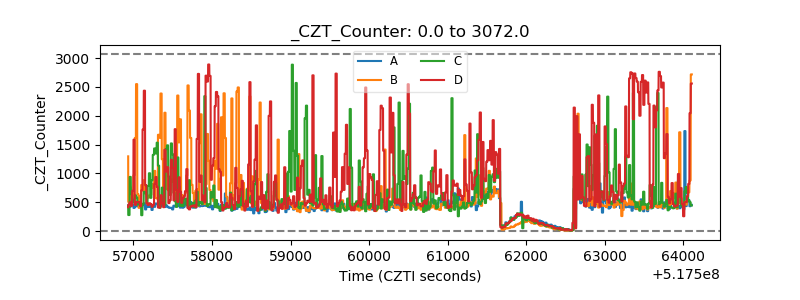 |
| +2.5 Volts monitor |  |
| +5 Volts monitor |  |
| _ROLL_ROT | 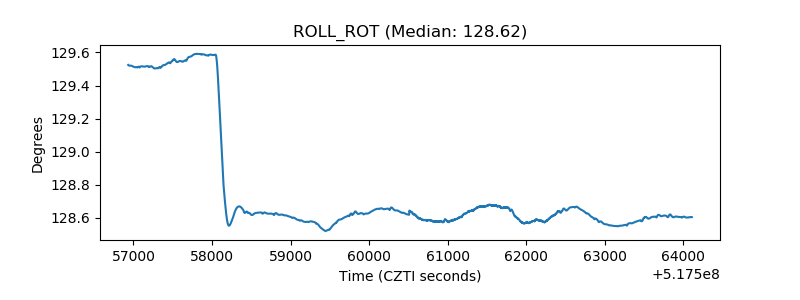 |
| _Roll_DEC | 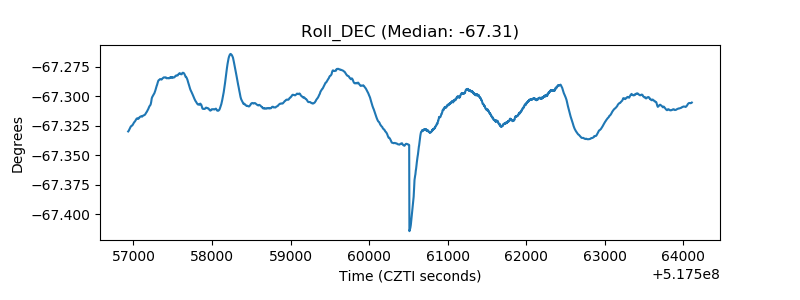 |
| _Roll_RA | 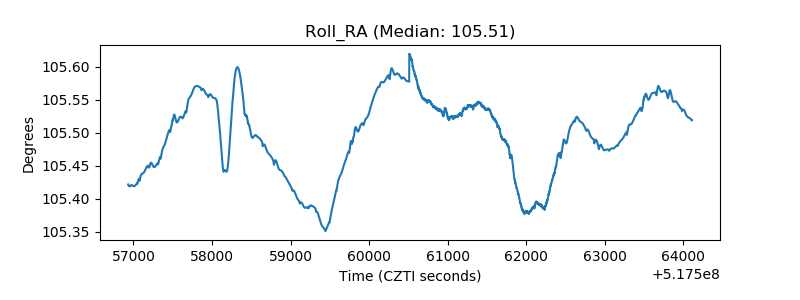 |
| Veto Counter | 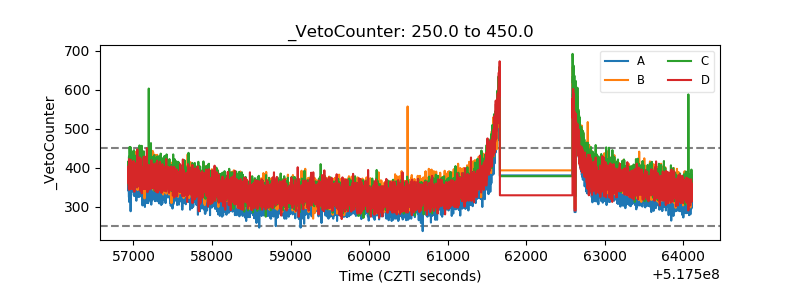 |