| Param | Original file | Final file |
|---|---|---|
| Filename | modeM0/AS1A14_125T09_9000006578_57687cztM0_level2.fits | modeM0/AS1A14_125T09_9000006578_57687cztM0_level2_quad_clean.evt |
| Size (bytes) | 639,956,160 | 91,751,040 |
| Size | 610.3 MB | 87.5 MB |
| Events in quadrant A | 3,534,897 | 653,166 |
| Events in quadrant B | 6,218,177 | 584,134 |
| Events in quadrant C | 5,219,807 | 600,200 |
| Events in quadrant D | 8,182,825 | 461,338 |
| Mode M9 | |||
|---|---|---|---|
| Quadrant | BADHDUFLAG | Total packets | Discarded packets |
| A | 0 | 4 | 0 |
| B | 0 | 4 | 0 |
| C | 0 | 4 | 0 |
| D | 0 | 4 | 0 |
| Mode SS | |||
|---|---|---|---|
| Quadrant | BADHDUFLAG | Total packets | Discarded packets |
| A | 0 | 140 | 0 |
| B | 0 | 140 | 0 |
| C | 0 | 140 | 0 |
| D | 0 | 140 | 0 |
| Mode M0 | |||
|---|---|---|---|
| Quadrant | BADHDUFLAG | Total packets | Discarded packets |
| A | 0 | 15156 | 1 |
| B | 0 | 23347 | 1 |
| C | 0 | 20327 | 1 |
| D | 0 | 29002 | 1 |
| Quadrant | Total seconds | Saturated seconds | Saturation percentage |
|---|---|---|---|
| A | 6872 | 187 | 2.721187% |
| B | 6872 | 1391 | 20.241560% |
| C | 6872 | 556 | 8.090803% |
| D | 6872 | 1673 | 24.345169% |
Noise dominated data is calculated using 1-second bins in cleaned event files. If a bin has >2000 counts, and if more than 50% of those come from <1% of pixels, then it is considered to be noise-dominated and hence unusable.
| Quadrant | # 1 sec bins | Bins with >0 counts | Bins with >2000 counts | High rate bins dominated by noise | Noise dominated (total time) | Noise dominated (detector-on time) | Marked lightcurve |
|---|---|---|---|---|---|---|---|
| A | 7317 | 6873 | 1 | 1 | 0.01% | 0.01% | 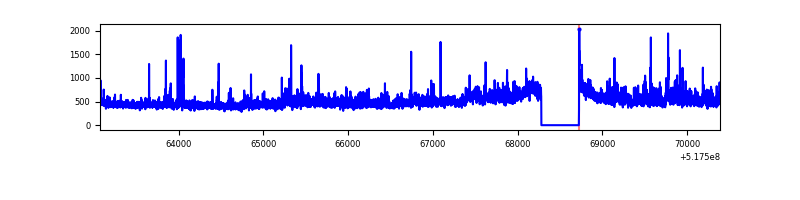 |
| B | 7317 | 6873 | 731 | 731 | 9.99% | 10.64% | 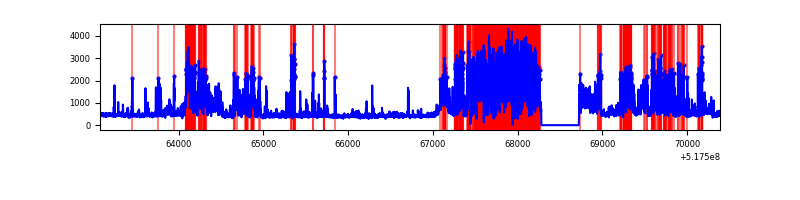 |
| C | 7317 | 6873 | 367 | 367 | 5.02% | 5.34% | 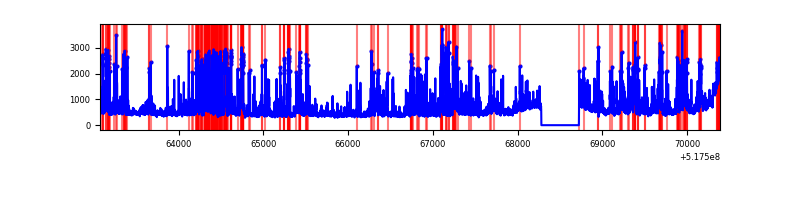 |
| D | 7317 | 6873 | 1491 | 1491 | 20.38% | 21.69% | 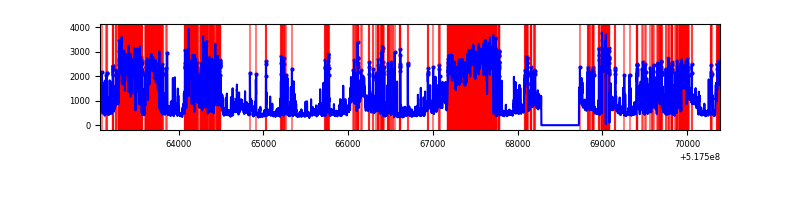 |
Top three noisy pixels from each quadrant. If the there are fewer than three noisy pixels in the level2.evt file, extra rows are filled as -1
| Pixel properties | Quadrant properties | ||||||
|---|---|---|---|---|---|---|---|
| Quadrant | DetID | PixID | Counts | Sigma | Mean | Median | Sigma |
| A | 3 | 14 | 473439 | 2553.97 | 754 | 733 | 185.1 |
| A | 3 | 245 | 66470 | 355.17 | 754 | 733 | 185.1 |
| A | 3 | 128 | 38251 | 202.7 | 754 | 733 | 185.1 |
| B | 5 | 185 | 3330180 | 24207.13 | 646 | 621 | 137.5 |
| B | 2 | 249 | 120120 | 868.8 | 646 | 621 | 137.5 |
| B | 10 | 247 | 64731 | 466.1 | 646 | 621 | 137.5 |
| C | 15 | 224 | 966953 | 4904.12 | 722 | 713 | 197.0 |
| C | 12 | 249 | 637798 | 3233.51 | 722 | 713 | 197.0 |
| C | 12 | 254 | 284811 | 1441.93 | 722 | 713 | 197.0 |
| D | 8 | 240 | 2962462 | 16178.21 | 651 | 620 | 183.1 |
| D | 8 | 160 | 1681200 | 9179.69 | 651 | 620 | 183.1 |
| D | 2 | 120 | 528900 | 2885.58 | 651 | 620 | 183.1 |
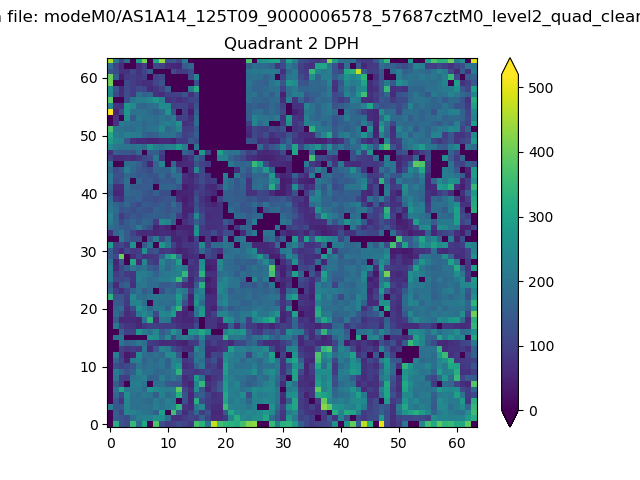
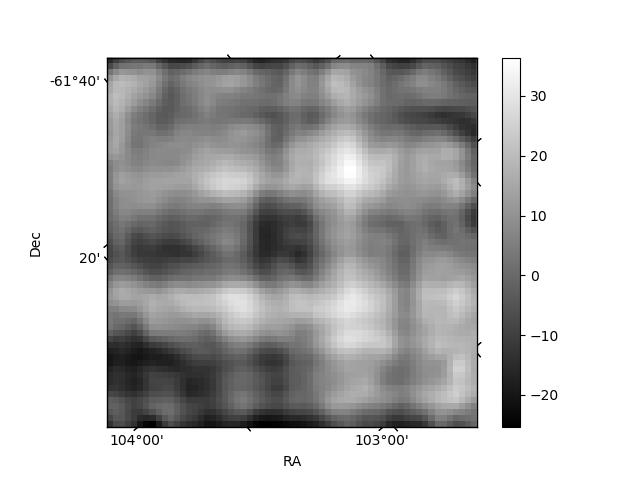
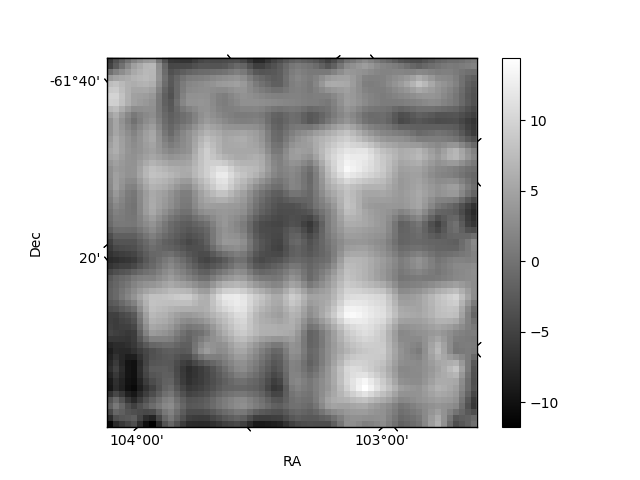
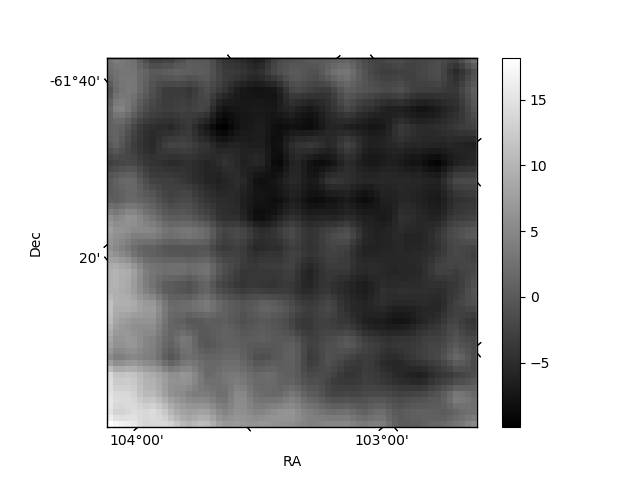
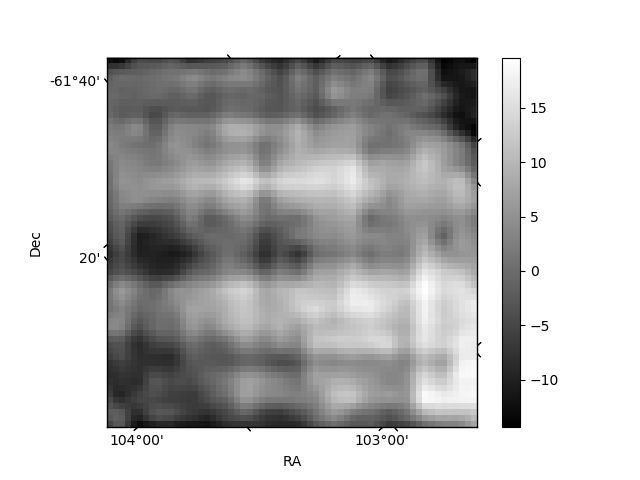
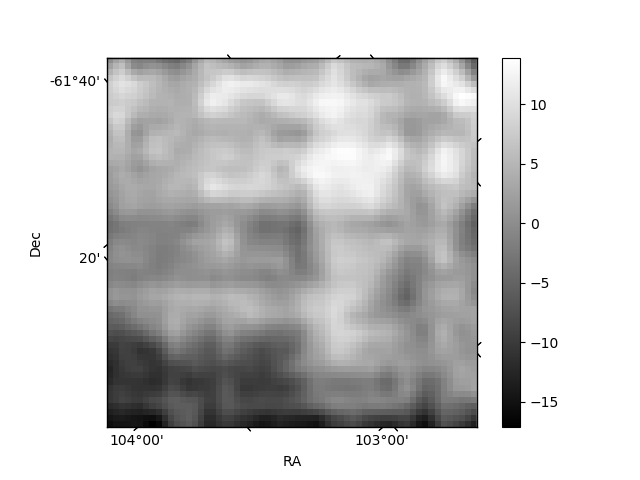
Histogram calculated using DETX and DETY for each event in the final _common_clean file
| Quadrant A | 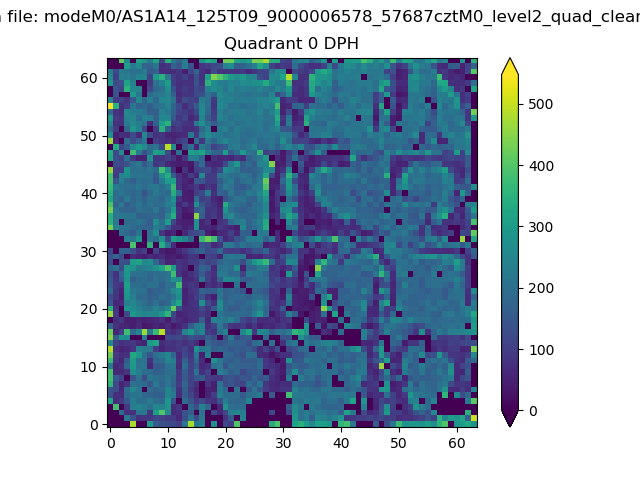 |
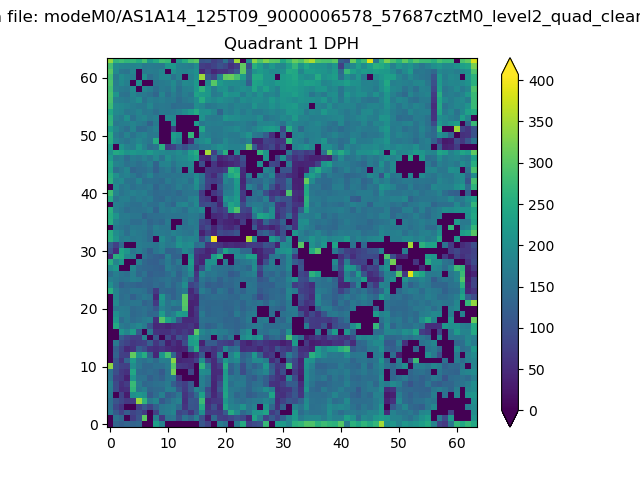 |
Quadrant B |
|---|---|---|---|
| Quadrant D | 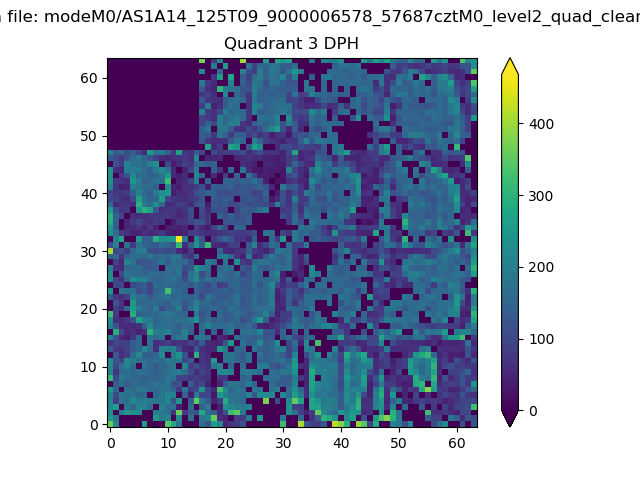 |
 |
Quadrant C |
| Plot type | Count rate plots | Images |
|---|---|---|
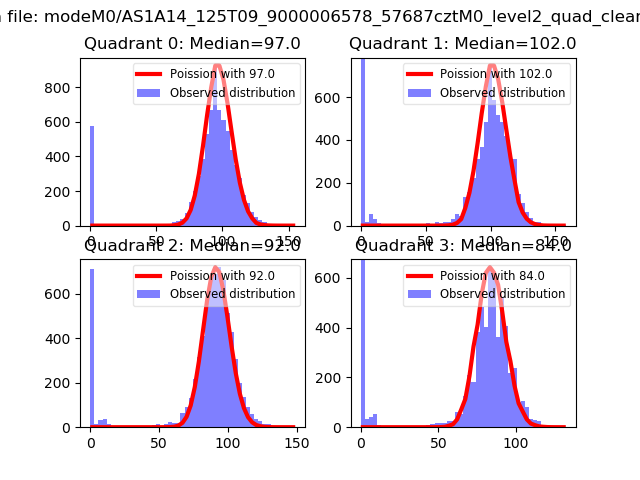
| Comparison with Poisson distribution Blue bars denote a histogram of data divided into 1 sec bins. Red curve is a Poisson curve with rate = median count rate of data. |
 |
 |
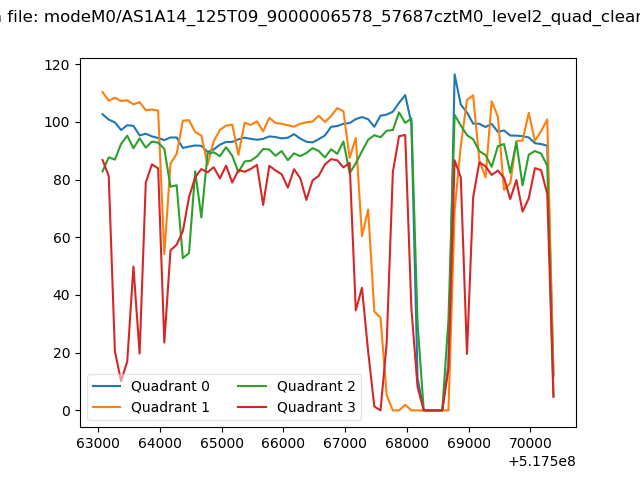
| Quadrant-wise count rates Data is divided into 100 sec bins |
 |
|
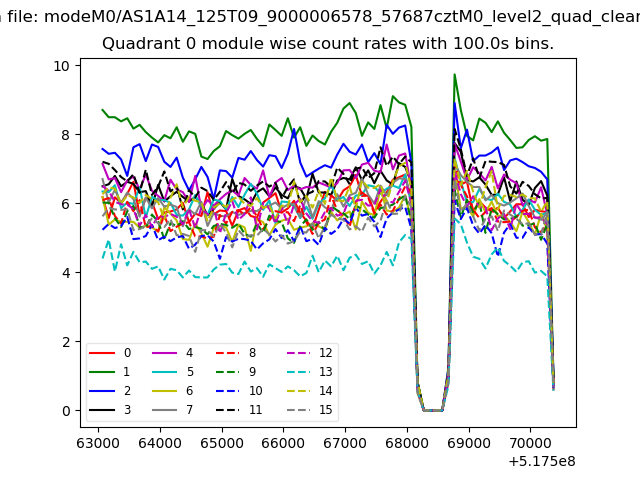
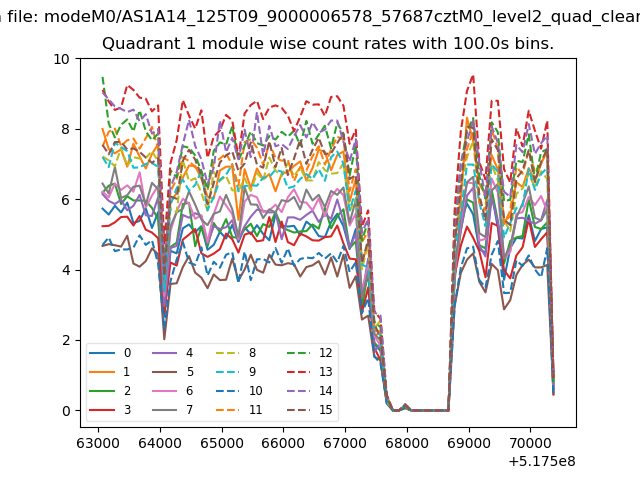
| Module-wise count rates for Quadrant A Data is divided into 100 sec bins |
 |
 |
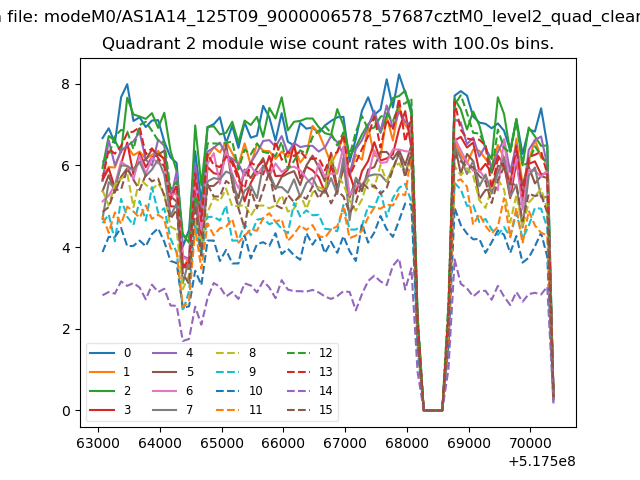
| Module-wise count rates for Quadrant B Data is divided into 100 sec bins |
 |
 |
| Module-wise count rates for Quadrant C Data is divided into 100 sec bins |
 |
 |
| Module-wise count rates for Quadrant D Data is divided into 100 sec bins |
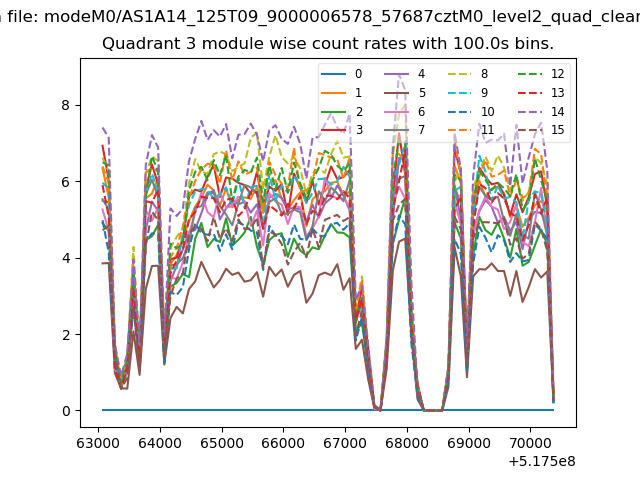 |
 |
| Parameter | Plot |
|---|---|
| CZT HV Monitor | 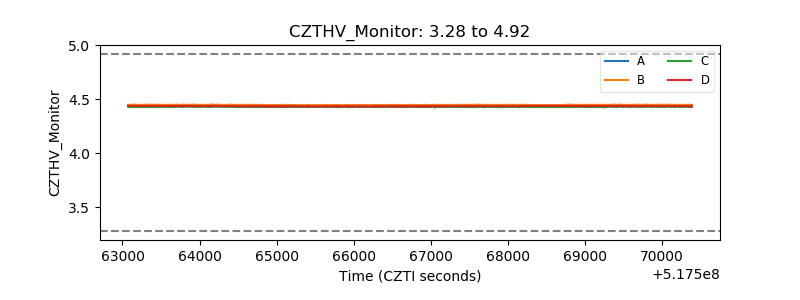 |
| D_VDD | 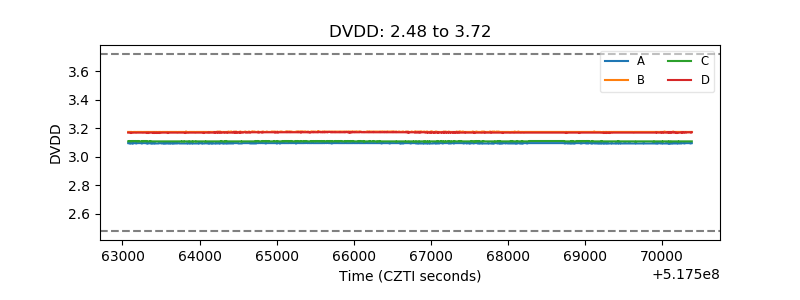 |
| Temperature 1 | 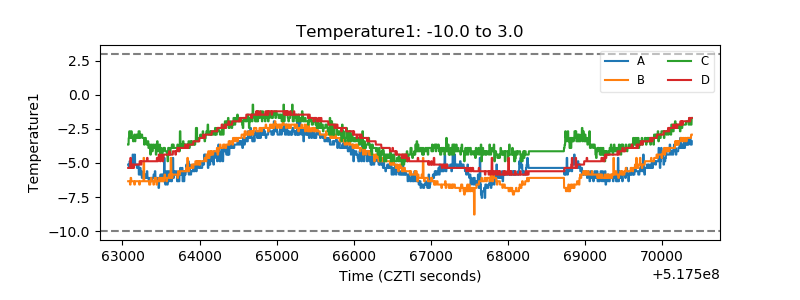 |
| Veto HV Monitor |  |
| Veto LLD | 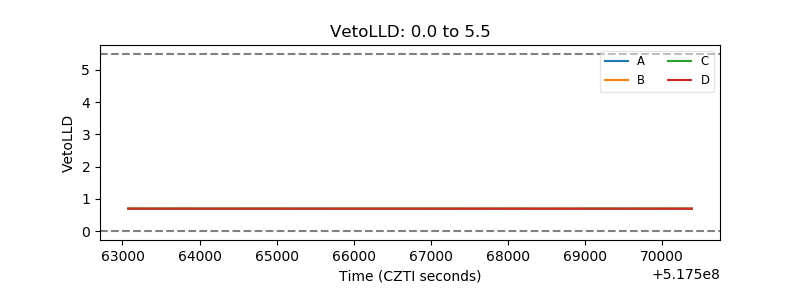 |
| Alpha Counter | 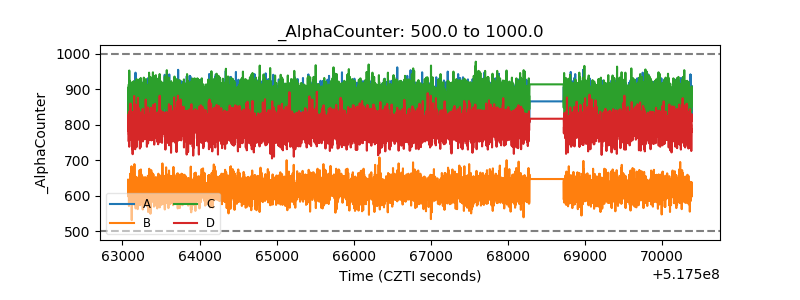 |
| _CPM_Rate | 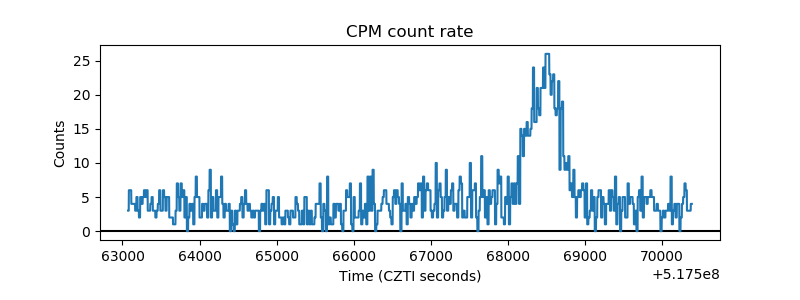 |
| CZT Counter | 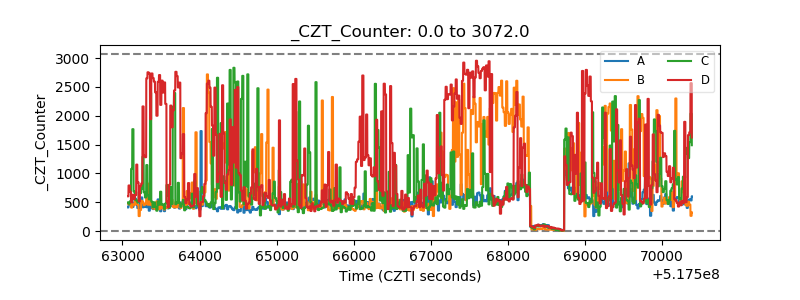 |
| +2.5 Volts monitor | 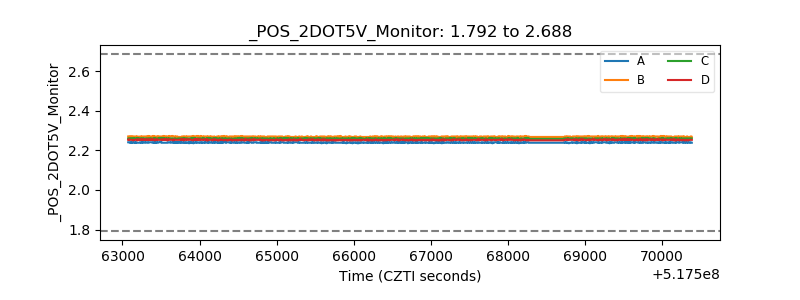 |
| +5 Volts monitor | 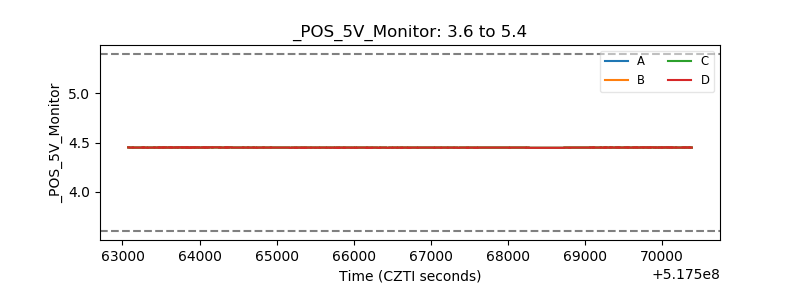 |
| _ROLL_ROT | 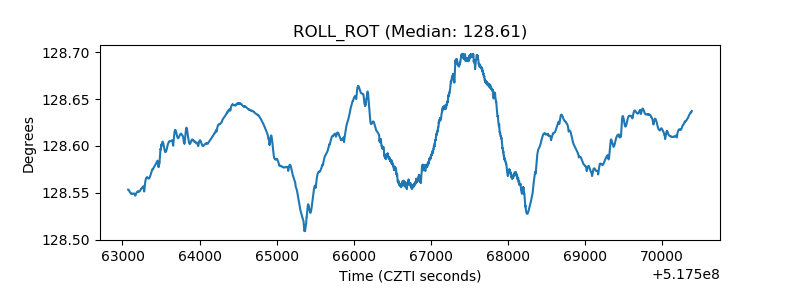 |
| _Roll_DEC | 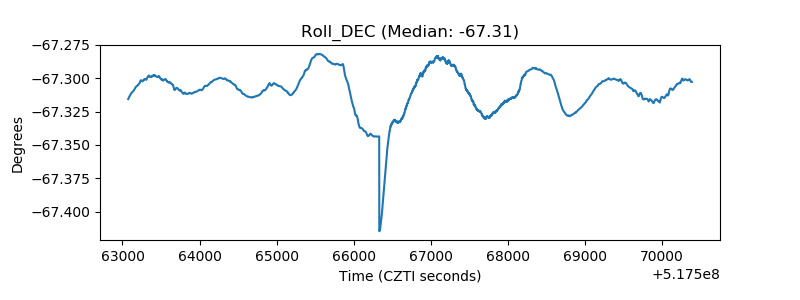 |
| _Roll_RA | 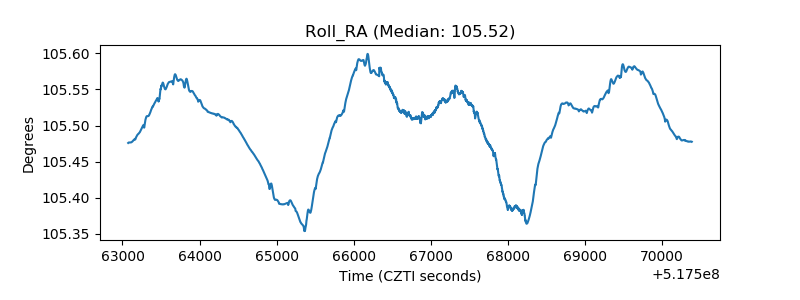 |
| Veto Counter | 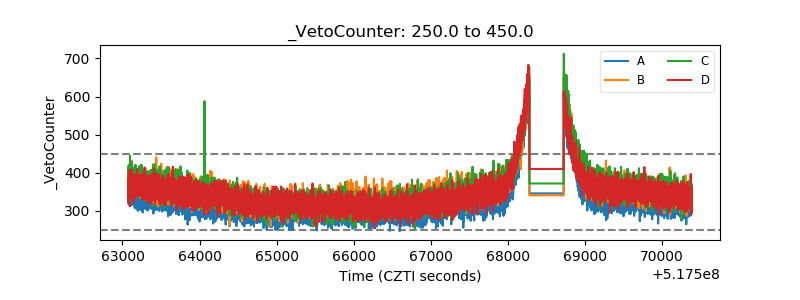 |