| Param | Original file | Final file |
|---|---|---|
| Filename | modeM0/AS1A14_125T09_9000006578_57688cztM0_level2.fits | modeM0/AS1A14_125T09_9000006578_57688cztM0_level2_quad_clean.evt |
| Size (bytes) | 743,515,200 | 98,383,680 |
| Size | 709.1 MB | 93.8 MB |
| Events in quadrant A | 3,822,774 | 695,556 |
| Events in quadrant B | 5,633,976 | 704,012 |
| Events in quadrant C | 8,115,628 | 571,247 |
| Events in quadrant D | 9,388,208 | 502,637 |
| Mode SS | |||
|---|---|---|---|
| Quadrant | BADHDUFLAG | Total packets | Discarded packets |
| A | 0 | 144 | 0 |
| B | 0 | 144 | 0 |
| C | 0 | 144 | 0 |
| D | 0 | 144 | 0 |
| Mode M0 | |||
|---|---|---|---|
| Quadrant | BADHDUFLAG | Total packets | Discarded packets |
| A | 0 | 16085 | 0 |
| B | 0 | 21983 | 0 |
| C | 0 | 29204 | 0 |
| D | 0 | 32934 | 0 |
| Quadrant | Total seconds | Saturated seconds | Saturation percentage |
|---|---|---|---|
| A | 7259 | 22 | 0.303072% |
| B | 7260 | 679 | 9.352617% |
| C | 7260 | 1296 | 17.851240% |
| D | 7260 | 1671 | 23.016529% |
Noise dominated data is calculated using 1-second bins in cleaned event files. If a bin has >2000 counts, and if more than 50% of those come from <1% of pixels, then it is considered to be noise-dominated and hence unusable.
| Quadrant | # 1 sec bins | Bins with >0 counts | Bins with >2000 counts | High rate bins dominated by noise | Noise dominated (total time) | Noise dominated (detector-on time) | Marked lightcurve |
|---|---|---|---|---|---|---|---|
| A | 7259 | 7259 | 3 | 3 | 0.04% | 0.04% | 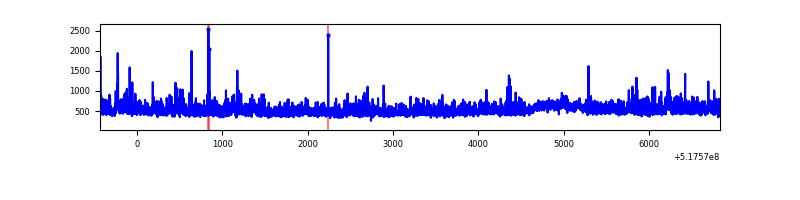 |
| B | 7260 | 7260 | 375 | 375 | 5.17% | 5.17% | 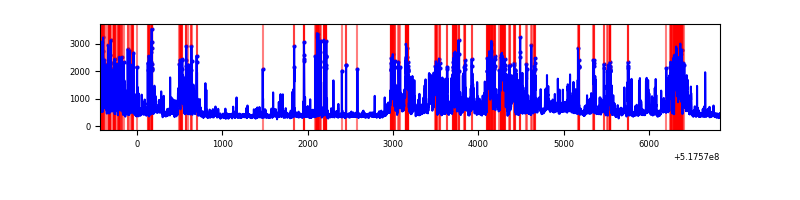 |
| C | 7260 | 7260 | 1157 | 1157 | 15.94% | 15.94% | 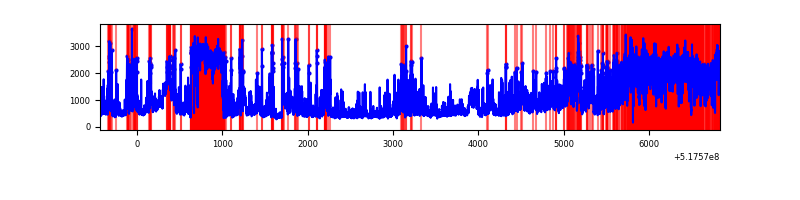 |
| D | 7260 | 7260 | 1694 | 1694 | 23.33% | 23.33% | 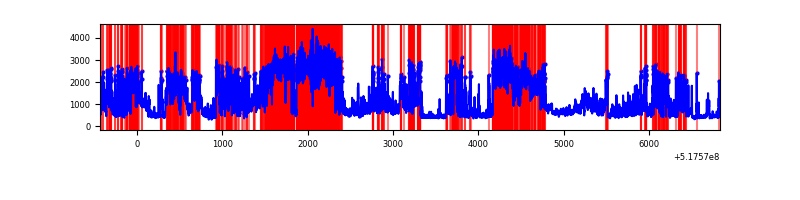 |
Top three noisy pixels from each quadrant. If the there are fewer than three noisy pixels in the level2.evt file, extra rows are filled as -1
| Pixel properties | Quadrant properties | ||||||
|---|---|---|---|---|---|---|---|
| Quadrant | DetID | PixID | Counts | Sigma | Mean | Median | Sigma |
| A | 3 | 14 | 641419 | 3297.61 | 790 | 769 | 194.3 |
| A | 3 | 245 | 28805 | 144.31 | 790 | 769 | 194.3 |
| A | 8 | 9 | 20064 | 99.32 | 790 | 769 | 194.3 |
| B | 5 | 185 | 2278213 | 13974.22 | 758 | 728 | 163.0 |
| B | 10 | 247 | 224807 | 1374.91 | 758 | 728 | 163.0 |
| B | 0 | 245 | 29677 | 177.63 | 758 | 728 | 163.0 |
| C | 12 | 254 | 2191462 | 11151.67 | 724 | 716 | 196.5 |
| C | 12 | 249 | 1551550 | 7894.29 | 724 | 716 | 196.5 |
| C | 15 | 224 | 1224521 | 6229.6 | 724 | 716 | 196.5 |
| D | 8 | 240 | 3556467 | 18141.59 | 694 | 662 | 196.0 |
| D | 8 | 160 | 2600876 | 13266.2 | 694 | 662 | 196.0 |
| D | 13 | 138 | 169288 | 860.32 | 694 | 662 | 196.0 |
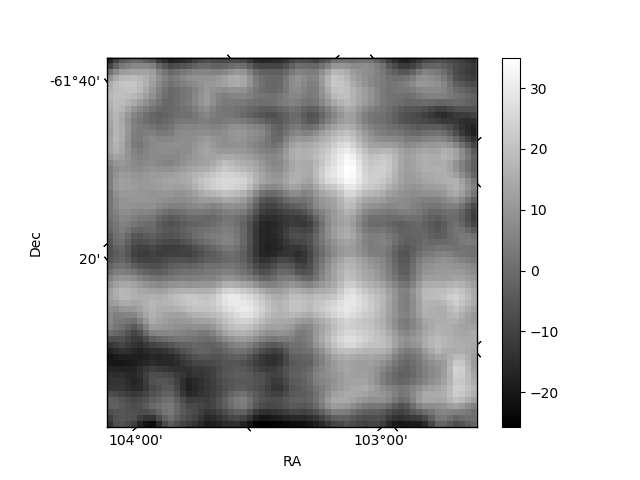
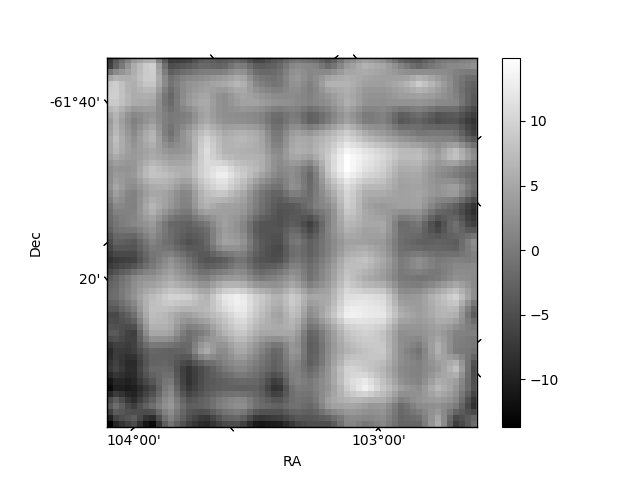
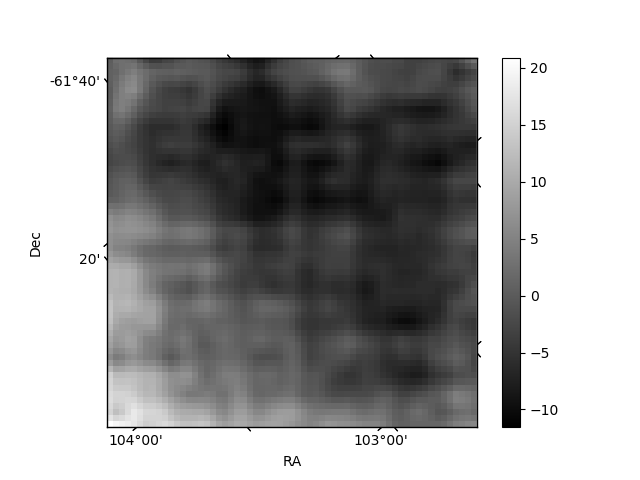
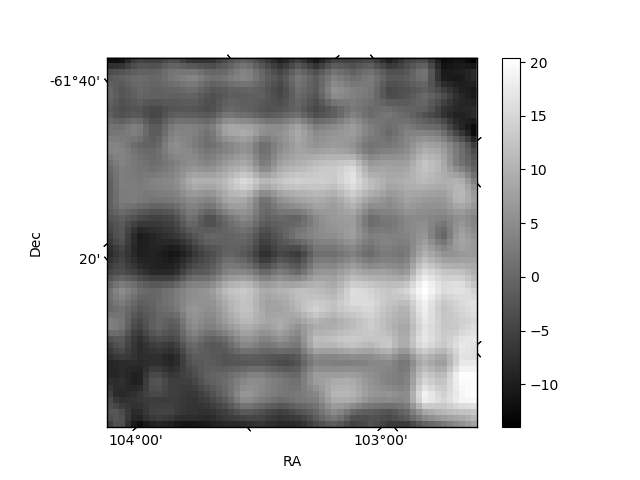
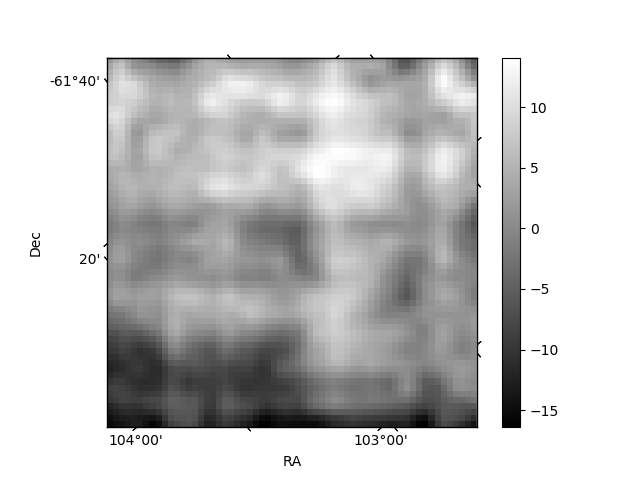
Histogram calculated using DETX and DETY for each event in the final _common_clean file
| Quadrant A | 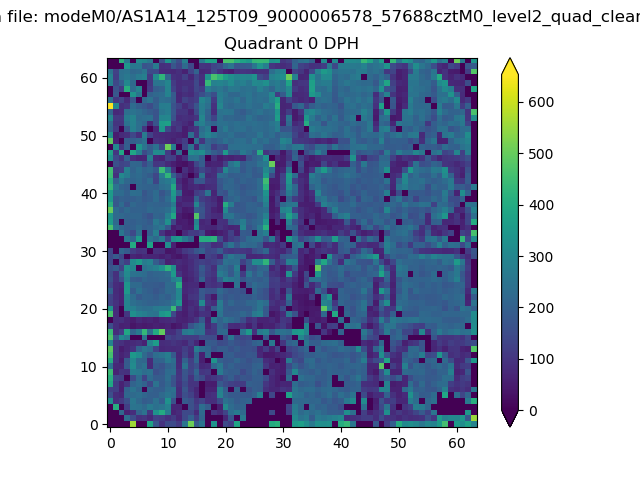 |
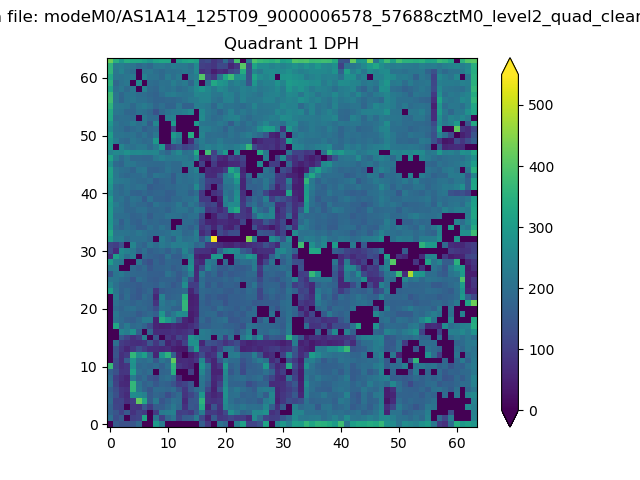 |
Quadrant B |
|---|---|---|---|
| Quadrant D | 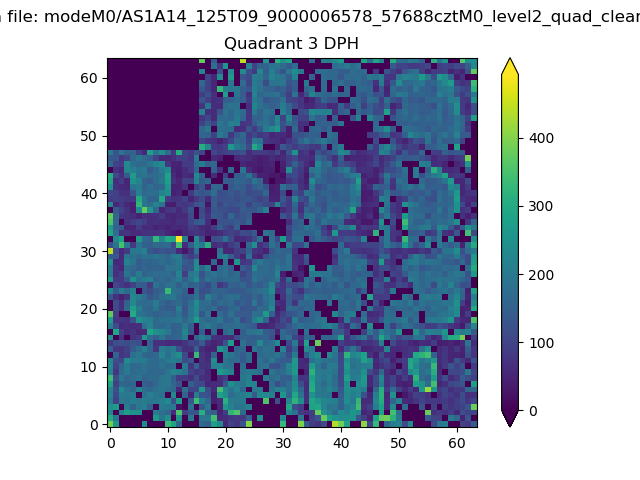 |
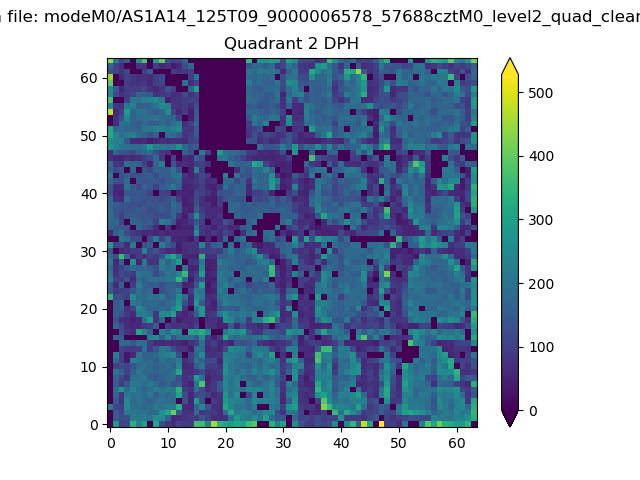 |
Quadrant C |
| Plot type | Count rate plots | Images |
|---|---|---|
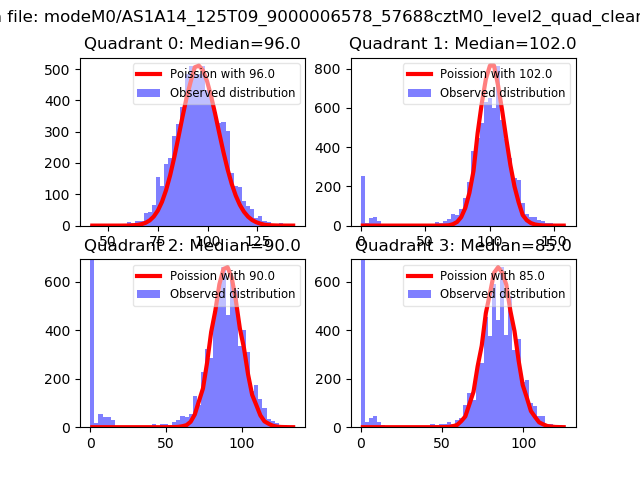
| Comparison with Poisson distribution Blue bars denote a histogram of data divided into 1 sec bins. Red curve is a Poisson curve with rate = median count rate of data. |
 |
 |
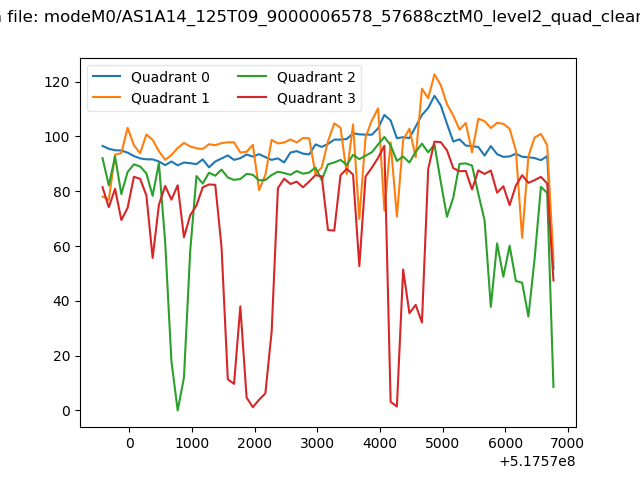
| Quadrant-wise count rates Data is divided into 100 sec bins |
 |
|
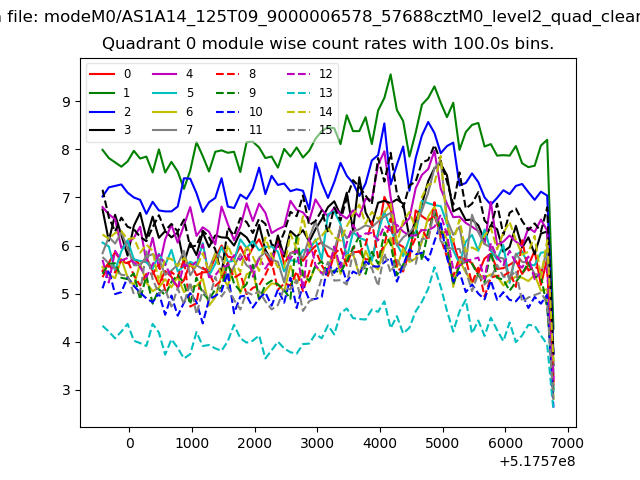
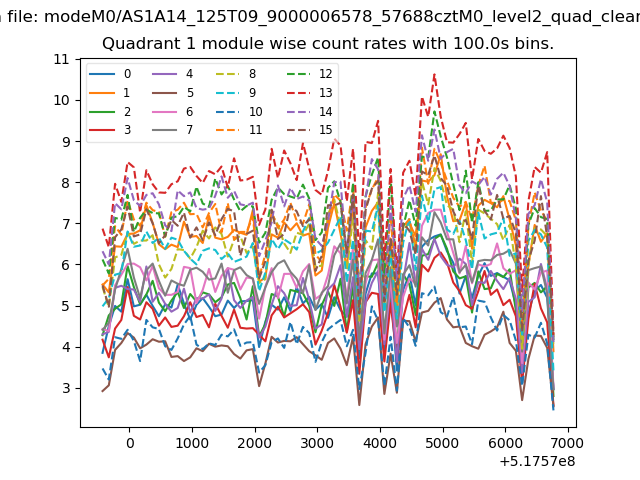
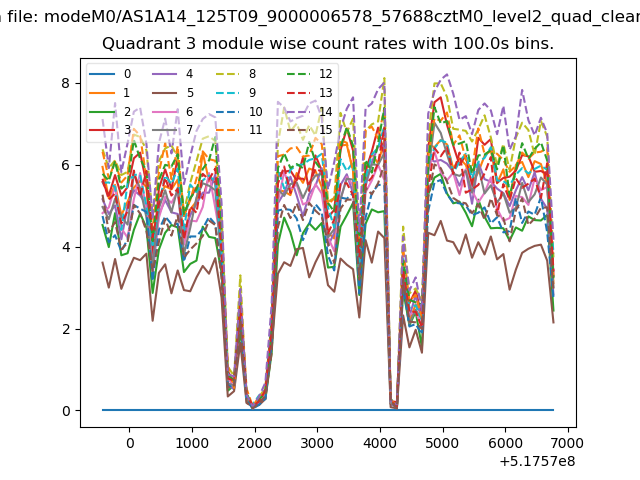
| Module-wise count rates for Quadrant A Data is divided into 100 sec bins |
 |
 |
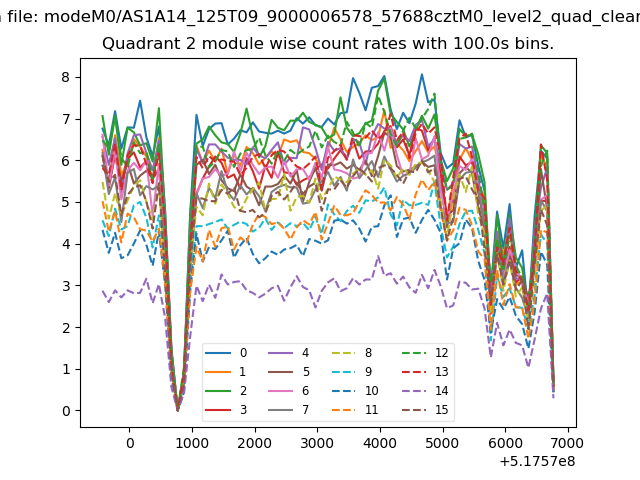
| Module-wise count rates for Quadrant B Data is divided into 100 sec bins |
 |
 |
| Module-wise count rates for Quadrant C Data is divided into 100 sec bins |
 |
 |
| Module-wise count rates for Quadrant D Data is divided into 100 sec bins |
 |
 |
| Parameter | Plot |
|---|---|
| CZT HV Monitor | 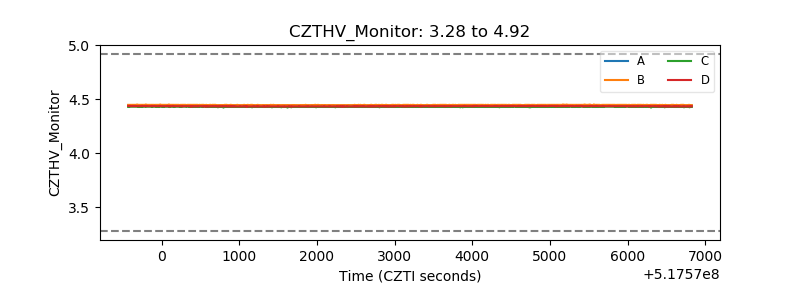 |
| D_VDD | 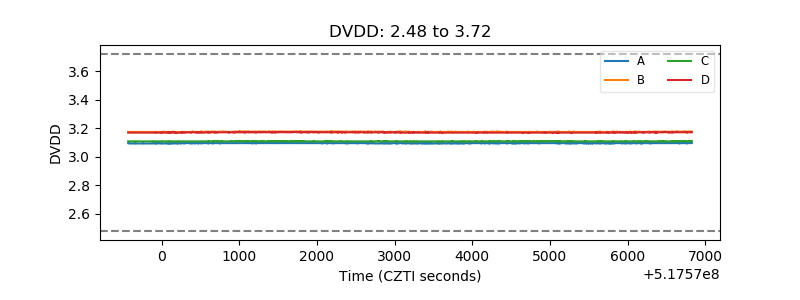 |
| Temperature 1 | 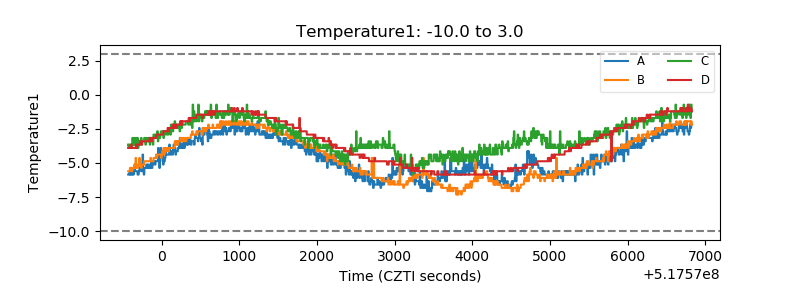 |
| Veto HV Monitor | 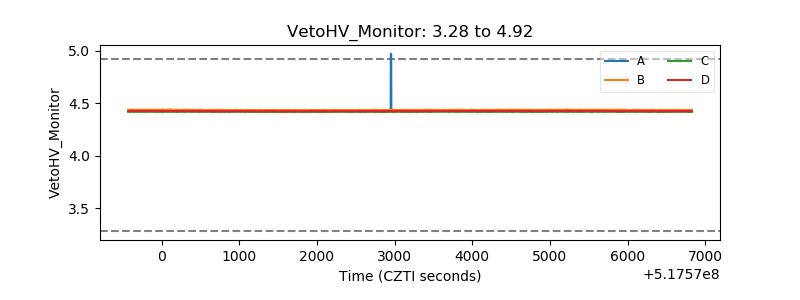 |
| Veto LLD | 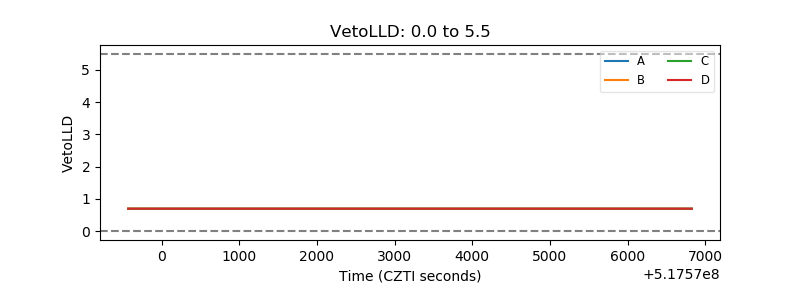 |
| Alpha Counter | 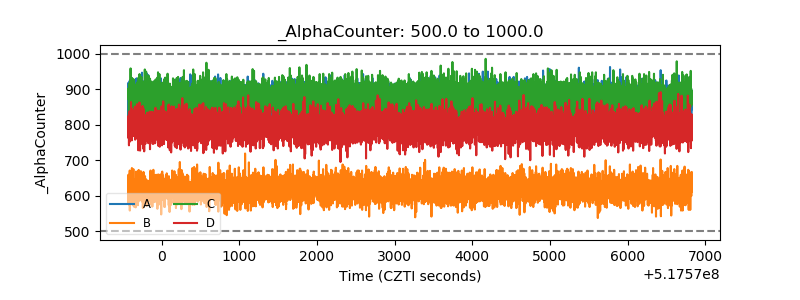 |
| _CPM_Rate | 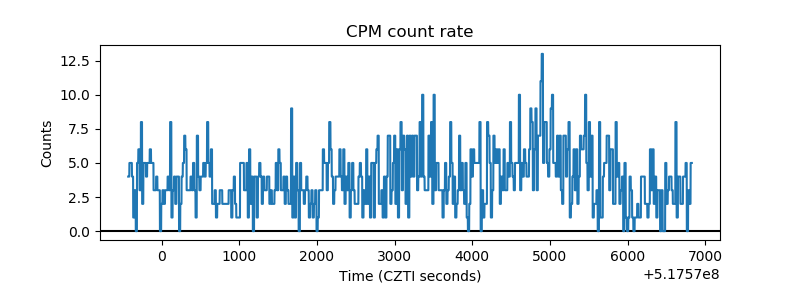 |
| CZT Counter | 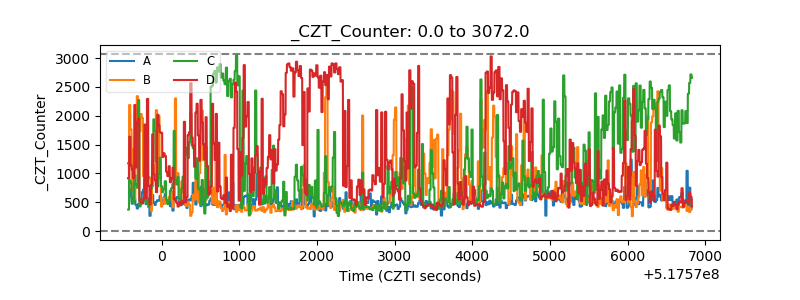 |
| +2.5 Volts monitor |  |
| +5 Volts monitor |  |
| _ROLL_ROT | 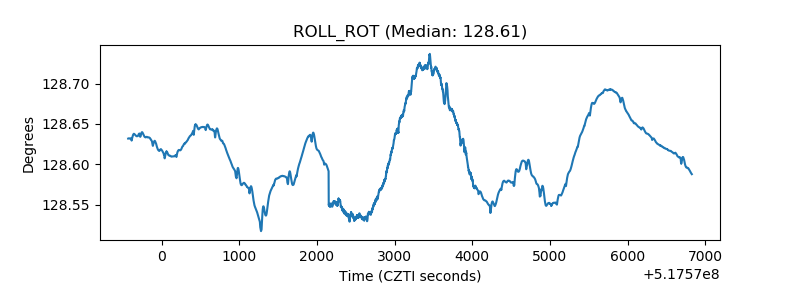 |
| _Roll_DEC | 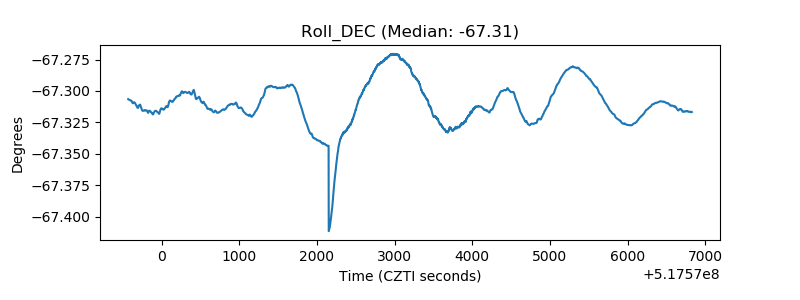 |
| _Roll_RA | 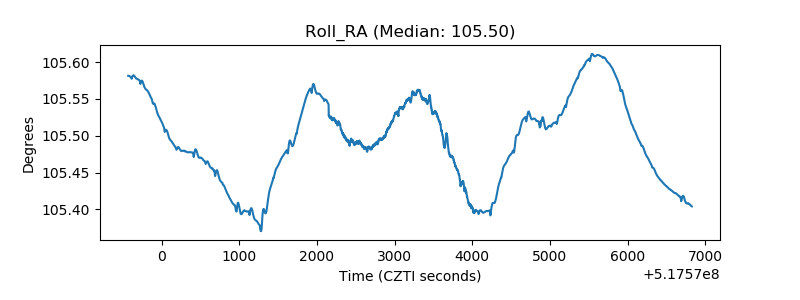 |
| Veto Counter | 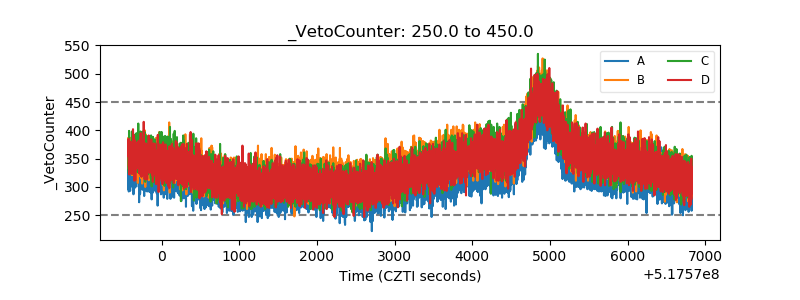 |