| Param | Original file | Final file |
|---|---|---|
| Filename | modeM0/AS1A14_125T09_9000006578_57689cztM0_level2.fits | modeM0/AS1A14_125T09_9000006578_57689cztM0_level2_quad_clean.evt |
| Size (bytes) | 701,167,680 | 97,951,680 |
| Size | 668.7 MB | 93.4 MB |
| Events in quadrant A | 3,664,498 | 690,417 |
| Events in quadrant B | 4,690,850 | 705,755 |
| Events in quadrant C | 11,334,667 | 468,773 |
| Events in quadrant D | 5,704,524 | 597,004 |
| Mode SS | |||
|---|---|---|---|
| Quadrant | BADHDUFLAG | Total packets | Discarded packets |
| A | 0 | 144 | 0 |
| B | 0 | 144 | 0 |
| C | 0 | 144 | 0 |
| D | 0 | 144 | 0 |
| Mode M0 | |||
|---|---|---|---|
| Quadrant | BADHDUFLAG | Total packets | Discarded packets |
| A | 0 | 15550 | 0 |
| B | 0 | 19051 | 0 |
| C | 0 | 38680 | 0 |
| D | 0 | 21717 | 0 |
| Quadrant | Total seconds | Saturated seconds | Saturation percentage |
|---|---|---|---|
| A | 7233 | 24 | 0.331813% |
| B | 7233 | 436 | 6.027928% |
| C | 7233 | 2629 | 36.347297% |
| D | 7233 | 403 | 5.571685% |
Noise dominated data is calculated using 1-second bins in cleaned event files. If a bin has >2000 counts, and if more than 50% of those come from <1% of pixels, then it is considered to be noise-dominated and hence unusable.
| Quadrant | # 1 sec bins | Bins with >0 counts | Bins with >2000 counts | High rate bins dominated by noise | Noise dominated (total time) | Noise dominated (detector-on time) | Marked lightcurve |
|---|---|---|---|---|---|---|---|
| A | 7233 | 7233 | 16 | 16 | 0.22% | 0.22% | 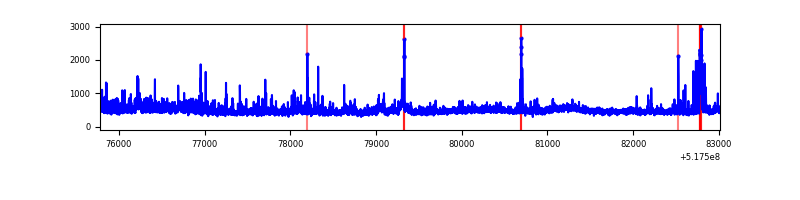 |
| B | 7233 | 7233 | 264 | 264 | 3.65% | 3.65% | 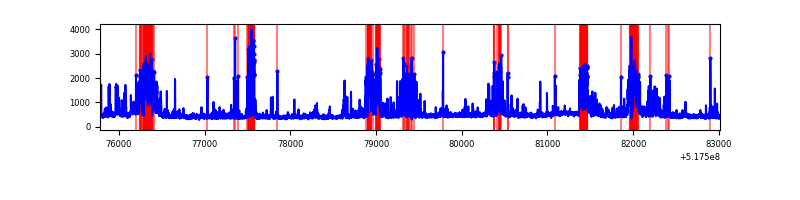 |
| C | 7233 | 7233 | 2381 | 2381 | 32.92% | 32.92% | 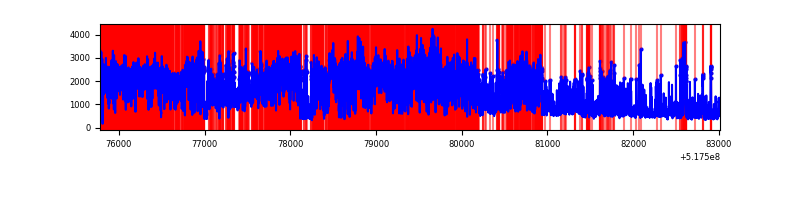 |
| D | 7233 | 7233 | 491 | 491 | 6.79% | 6.79% | 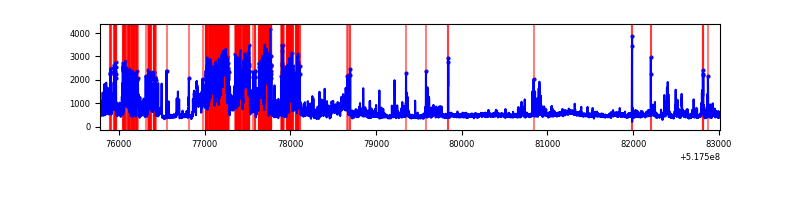 |
Top three noisy pixels from each quadrant. If the there are fewer than three noisy pixels in the level2.evt file, extra rows are filled as -1
| Pixel properties | Quadrant properties | ||||||
|---|---|---|---|---|---|---|---|
| Quadrant | DetID | PixID | Counts | Sigma | Mean | Median | Sigma |
| A | 3 | 14 | 414040 | 2171.53 | 778 | 757 | 190.3 |
| A | 7 | 223 | 66079 | 343.22 | 778 | 757 | 190.3 |
| A | 4 | 13 | 49434 | 255.77 | 778 | 757 | 190.3 |
| B | 5 | 185 | 1355496 | 8369.68 | 755 | 727 | 161.9 |
| B | 10 | 247 | 179887 | 1106.84 | 755 | 727 | 161.9 |
| B | 0 | 171 | 38721 | 234.72 | 755 | 727 | 161.9 |
| C | 12 | 254 | 7187665 | 40107.85 | 661 | 653 | 179.2 |
| C | 15 | 224 | 1242276 | 6929.0 | 661 | 653 | 179.2 |
| C | 12 | 2 | 151030 | 839.19 | 661 | 653 | 179.2 |
| D | 8 | 160 | 1219369 | 5750.84 | 746 | 713 | 211.9 |
| D | 8 | 240 | 1152527 | 5435.41 | 746 | 713 | 211.9 |
| D | 2 | 120 | 97902 | 458.63 | 746 | 713 | 211.9 |
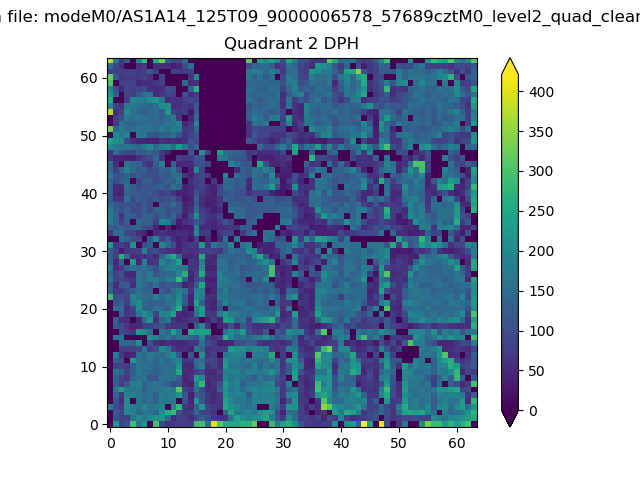
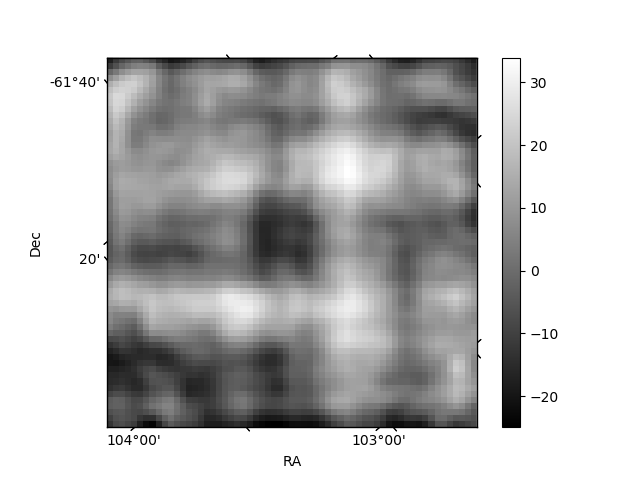
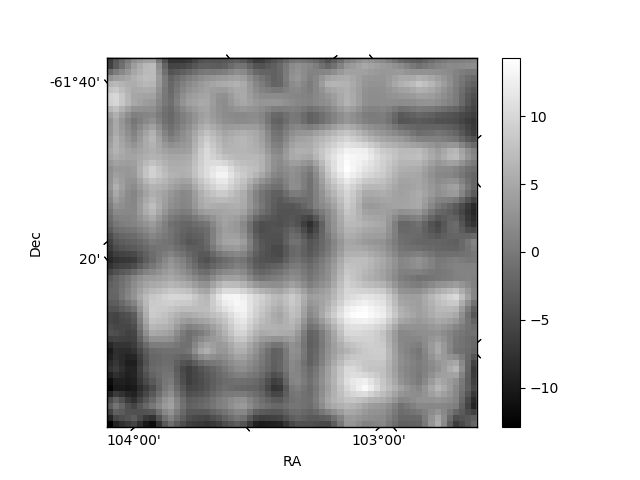
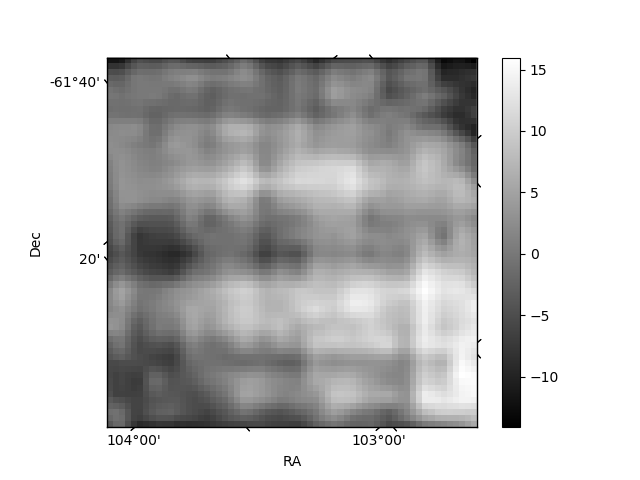
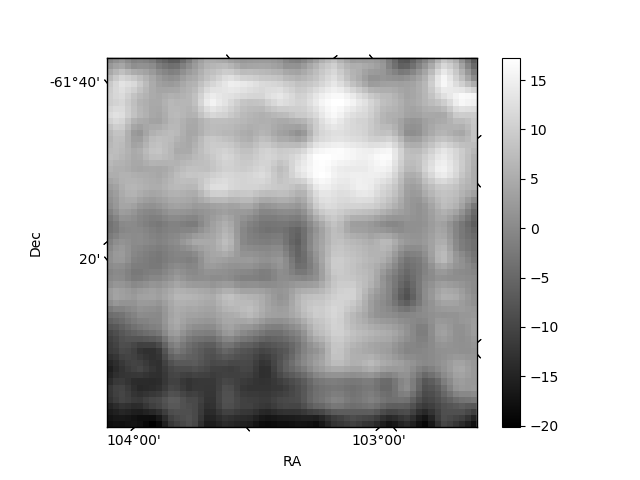
Histogram calculated using DETX and DETY for each event in the final _common_clean file
| Quadrant A | 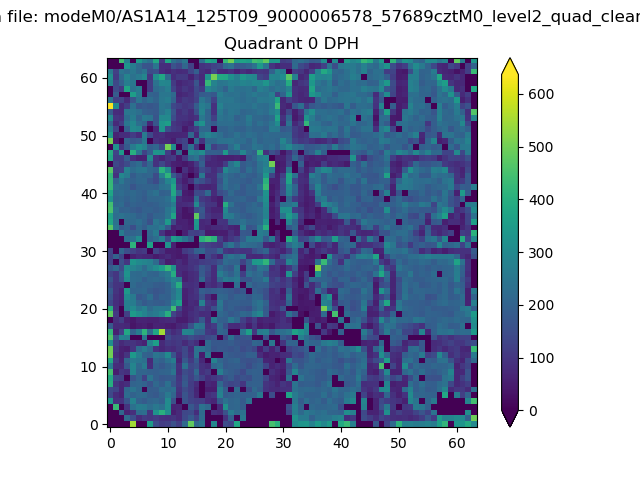 |
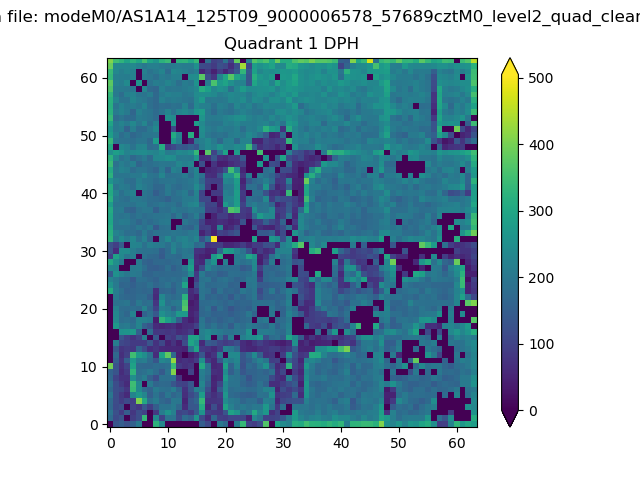 |
Quadrant B |
|---|---|---|---|
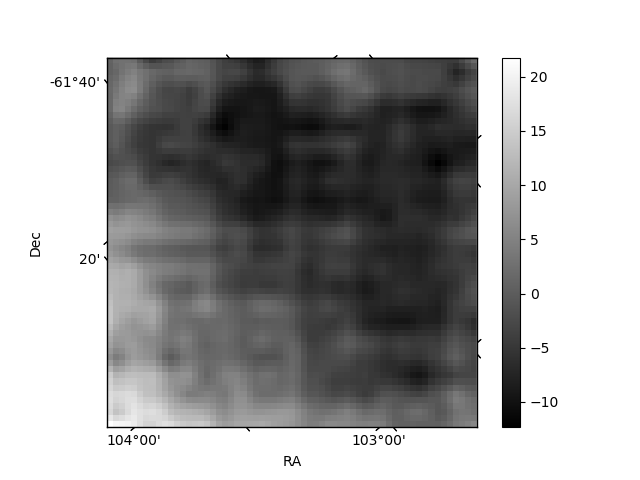
| Quadrant D | 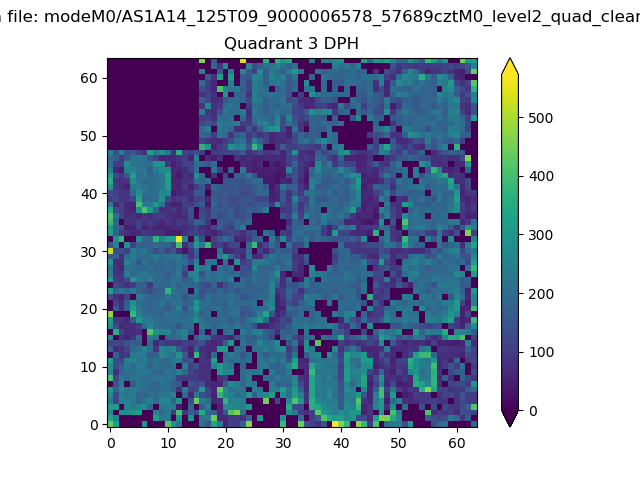 |
 |
Quadrant C |
| Plot type | Count rate plots | Images |
|---|---|---|
| Comparison with Poisson distribution Blue bars denote a histogram of data divided into 1 sec bins. Red curve is a Poisson curve with rate = median count rate of data. |
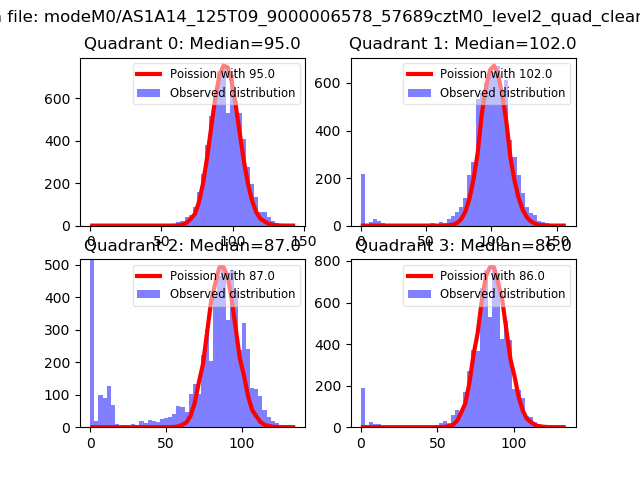 |
 |
| Quadrant-wise count rates Data is divided into 100 sec bins |
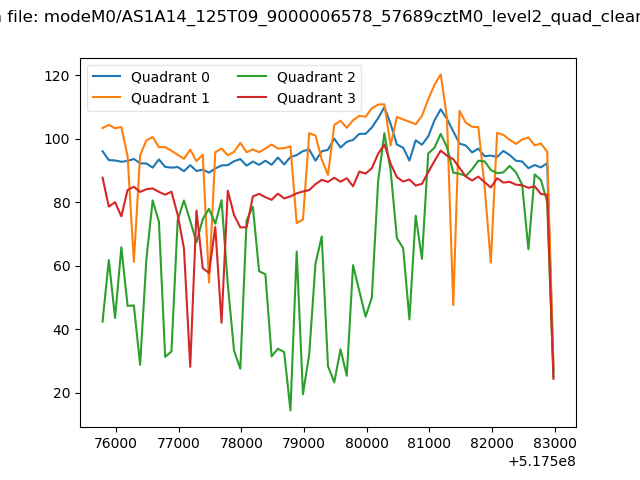 |
|
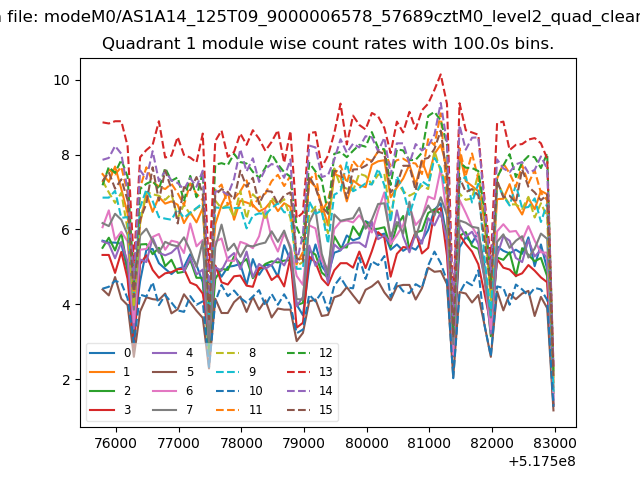
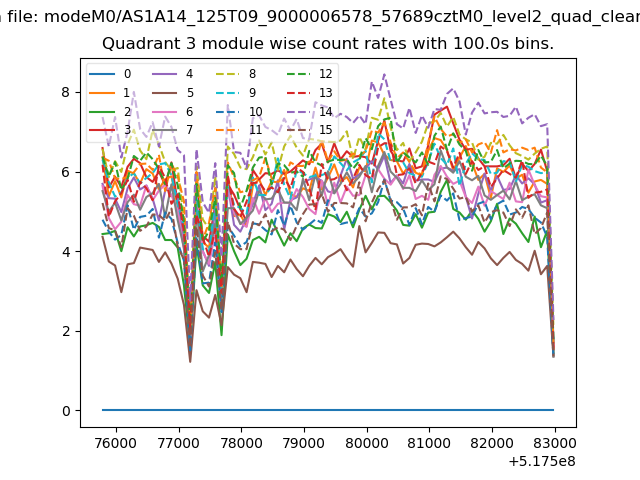
| Module-wise count rates for Quadrant A Data is divided into 100 sec bins |
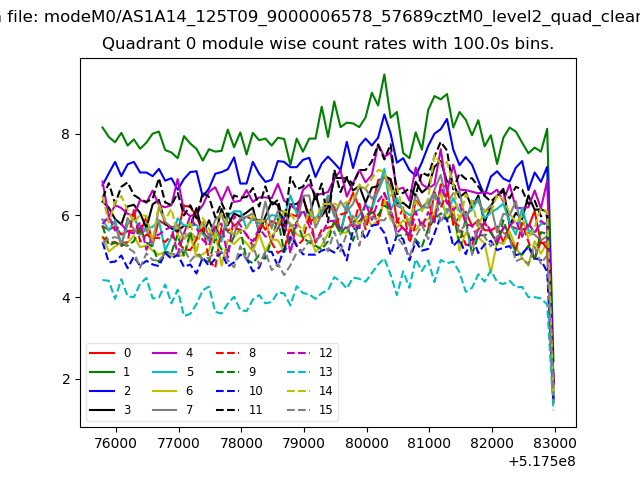 |
 |
| Module-wise count rates for Quadrant B Data is divided into 100 sec bins |
 |
 |
| Module-wise count rates for Quadrant C Data is divided into 100 sec bins |
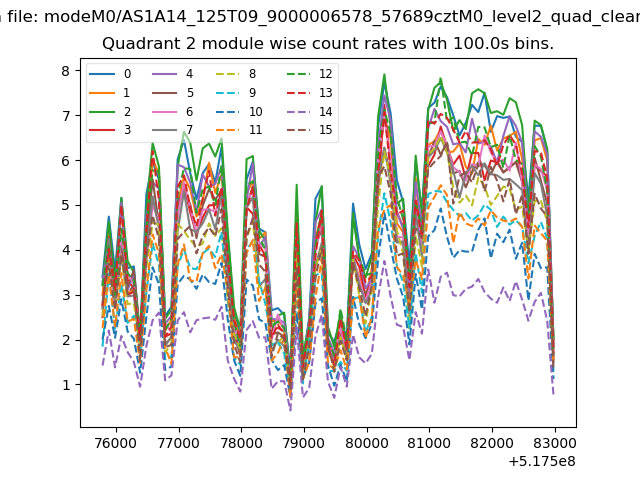 |
 |
| Module-wise count rates for Quadrant D Data is divided into 100 sec bins |
 |
 |
| Parameter | Plot |
|---|---|
| CZT HV Monitor |  |
| D_VDD | 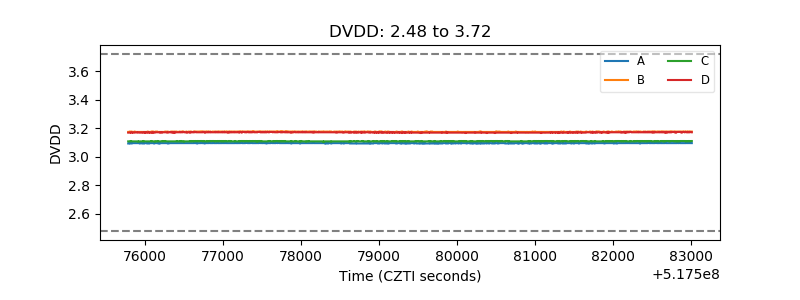 |
| Temperature 1 | 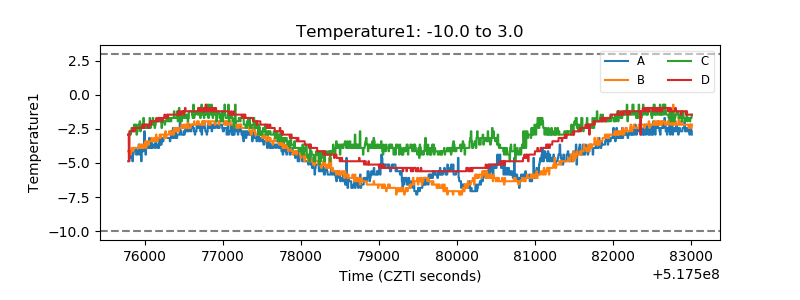 |
| Veto HV Monitor | 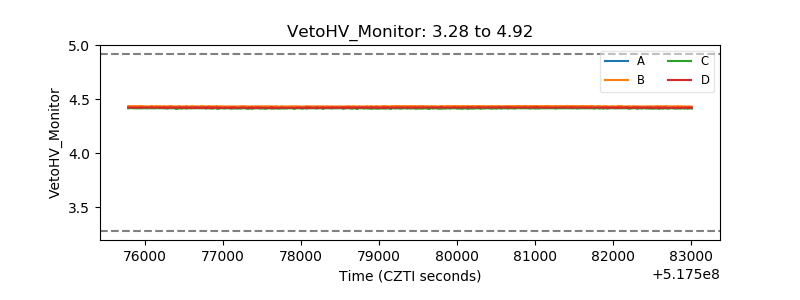 |
| Veto LLD | 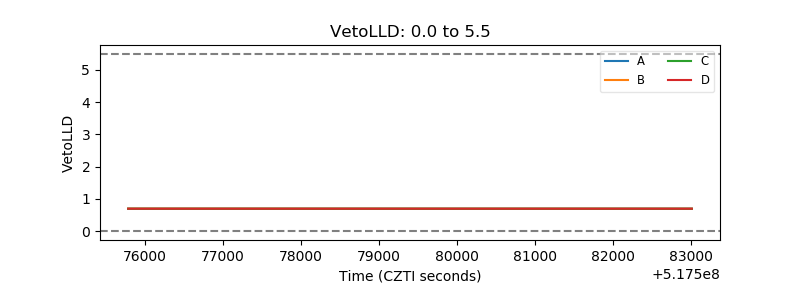 |
| Alpha Counter | 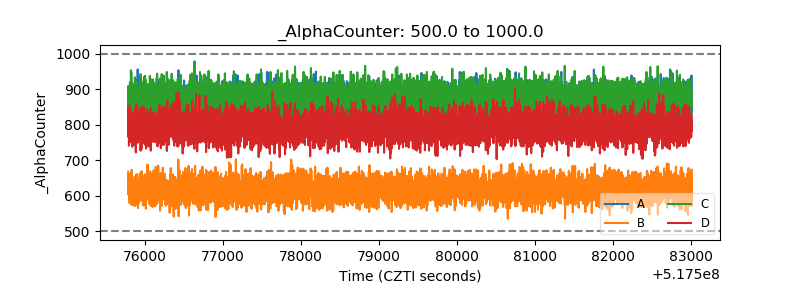 |
| _CPM_Rate | 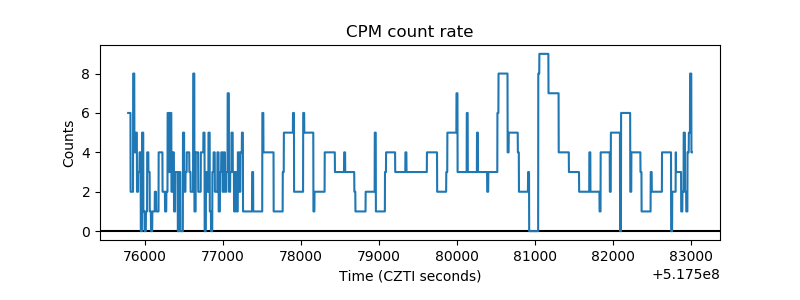 |
| CZT Counter | 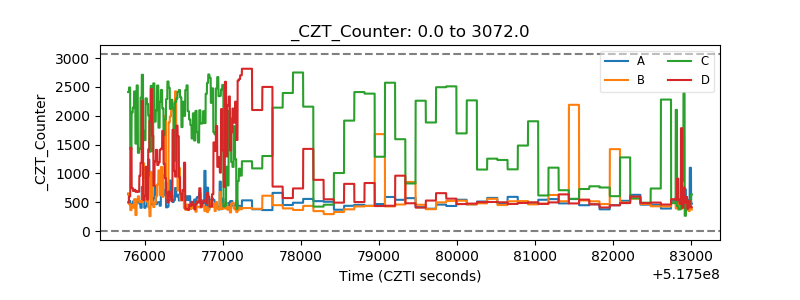 |
| +2.5 Volts monitor |  |
| +5 Volts monitor |  |
| _ROLL_ROT | 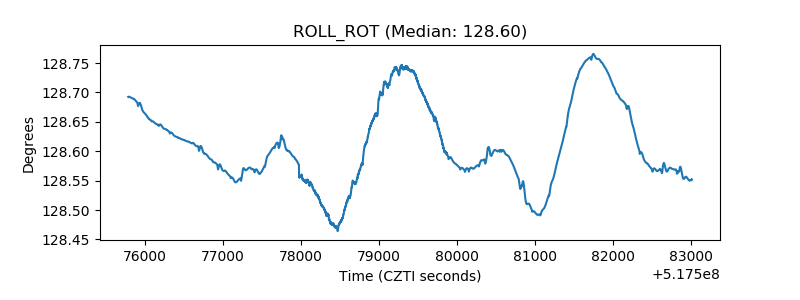 |
| _Roll_DEC | 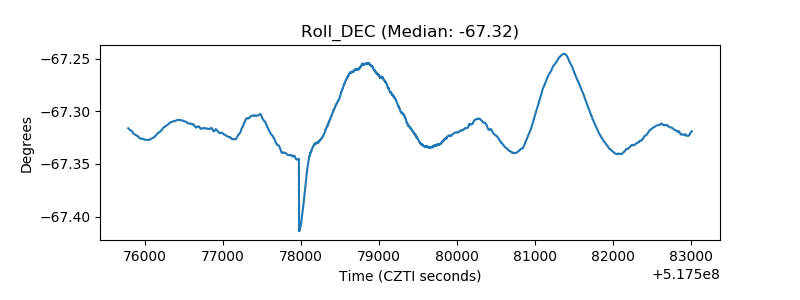 |
| _Roll_RA | 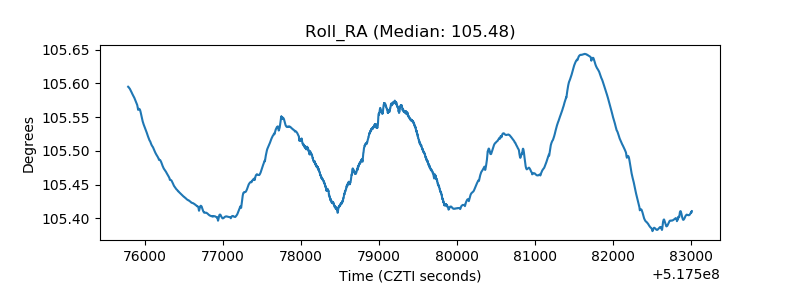 |
| Veto Counter | 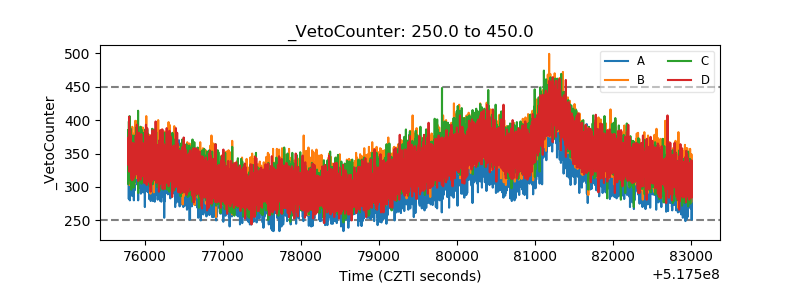 |