| Param | Original file | Final file |
|---|---|---|
| Filename | modeM0/AS1A14_125T09_9000006578_57690cztM0_level2.fits | modeM0/AS1A14_125T09_9000006578_57690cztM0_level2_quad_clean.evt |
| Size (bytes) | 546,805,440 | 103,708,800 |
| Size | 521.5 MB | 98.9 MB |
| Events in quadrant A | 4,030,706 | 692,248 |
| Events in quadrant B | 3,680,272 | 736,731 |
| Events in quadrant C | 7,231,027 | 598,018 |
| Events in quadrant D | 4,736,330 | 607,960 |
| Mode SS | |||
|---|---|---|---|
| Quadrant | BADHDUFLAG | Total packets | Discarded packets |
| A | 0 | 146 | 0 |
| B | 0 | 146 | 0 |
| C | 0 | 146 | 0 |
| D | 0 | 146 | 0 |
| Mode M0 | |||
|---|---|---|---|
| Quadrant | BADHDUFLAG | Total packets | Discarded packets |
| A | 0 | 16692 | 0 |
| B | 0 | 16162 | 1 |
| C | 0 | 26495 | 0 |
| D | 0 | 19055 | 0 |
| Quadrant | Total seconds | Saturated seconds | Saturation percentage |
|---|---|---|---|
| A | 7250 | 78 | 1.075862% |
| B | 7250 | 137 | 1.889655% |
| C | 7250 | 942 | 12.993103% |
| D | 7250 | 295 | 4.068966% |
Noise dominated data is calculated using 1-second bins in cleaned event files. If a bin has >2000 counts, and if more than 50% of those come from <1% of pixels, then it is considered to be noise-dominated and hence unusable.
| Quadrant | # 1 sec bins | Bins with >0 counts | Bins with >2000 counts | High rate bins dominated by noise | Noise dominated (total time) | Noise dominated (detector-on time) | Marked lightcurve |
|---|---|---|---|---|---|---|---|
| A | 7250 | 7250 | 49 | 49 | 0.68% | 0.68% | 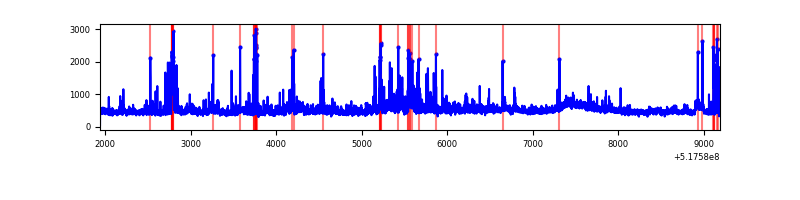 |
| B | 7250 | 7250 | 60 | 60 | 0.83% | 0.83% | 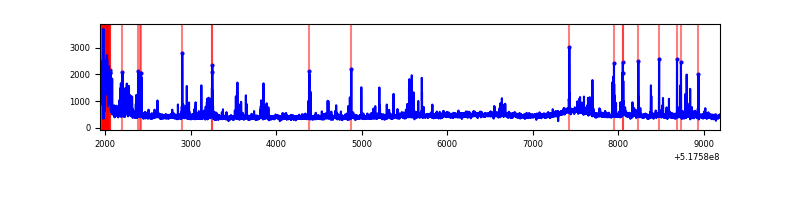 |
| C | 7250 | 7250 | 797 | 797 | 10.99% | 10.99% | 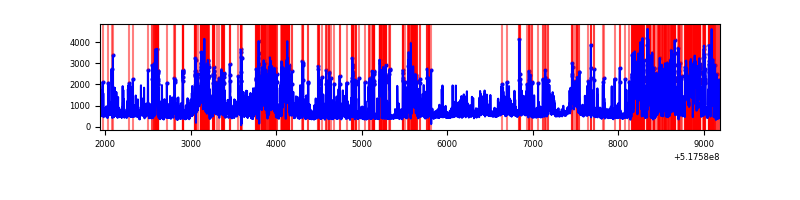 |
| D | 7250 | 7250 | 312 | 312 | 4.30% | 4.30% | 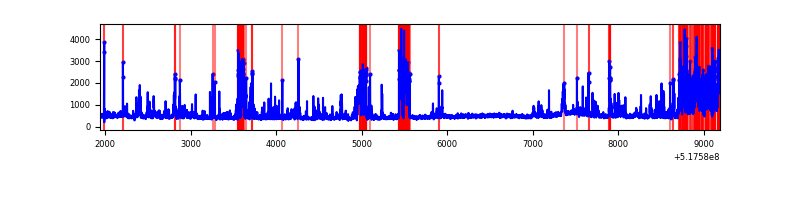 |
Top three noisy pixels from each quadrant. If the there are fewer than three noisy pixels in the level2.evt file, extra rows are filled as -1
| Pixel properties | Quadrant properties | ||||||
|---|---|---|---|---|---|---|---|
| Quadrant | DetID | PixID | Counts | Sigma | Mean | Median | Sigma |
| A | 3 | 14 | 502409 | 2565.77 | 791 | 771 | 195.5 |
| A | 7 | 160 | 231021 | 1177.68 | 791 | 771 | 195.5 |
| A | 7 | 223 | 63751 | 322.13 | 791 | 771 | 195.5 |
| B | 5 | 185 | 283514 | 1661.56 | 780 | 749 | 170.2 |
| B | 10 | 247 | 114146 | 666.33 | 780 | 749 | 170.2 |
| B | 0 | 171 | 62695 | 364.0 | 780 | 749 | 170.2 |
| C | 15 | 224 | 1607706 | 8129.08 | 728 | 723 | 197.7 |
| C | 12 | 254 | 1598141 | 8080.69 | 728 | 723 | 197.7 |
| C | 12 | 252 | 426190 | 2152.27 | 728 | 723 | 197.7 |
| D | 8 | 240 | 877183 | 4126.69 | 756 | 723 | 212.4 |
| D | 8 | 160 | 430896 | 2025.41 | 756 | 723 | 212.4 |
| D | 2 | 120 | 116032 | 542.92 | 756 | 723 | 212.4 |
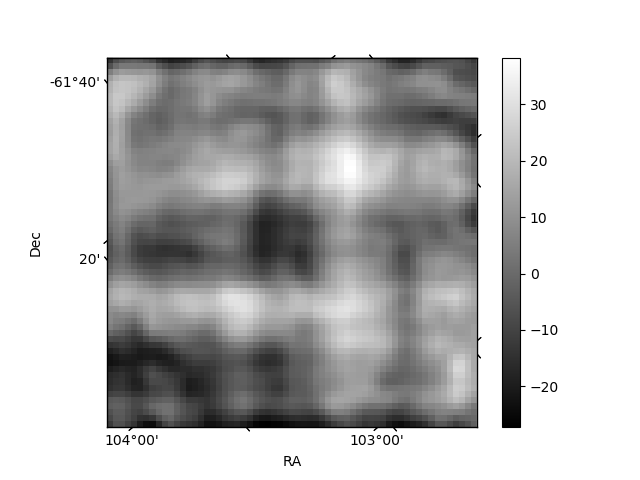
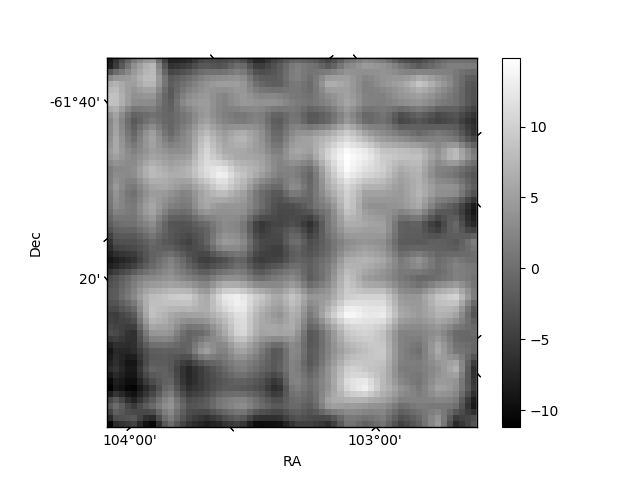
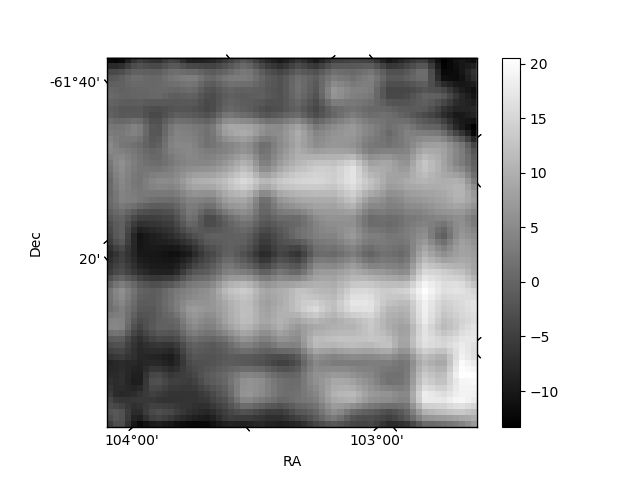
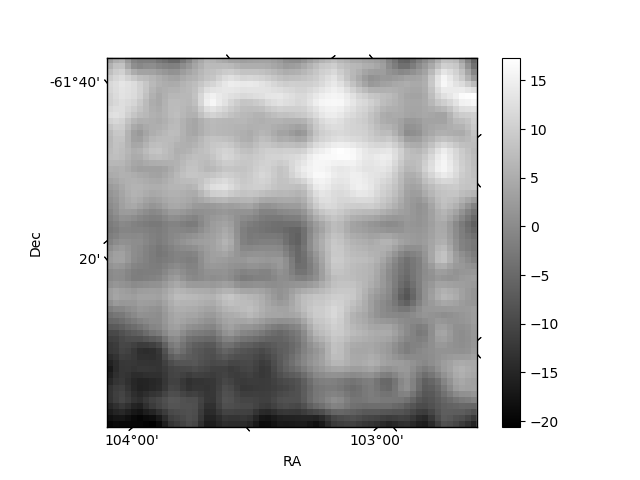
Histogram calculated using DETX and DETY for each event in the final _common_clean file
| Quadrant A | 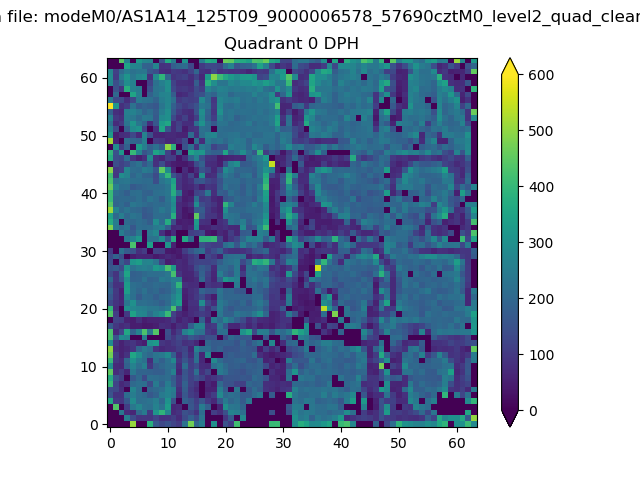 |
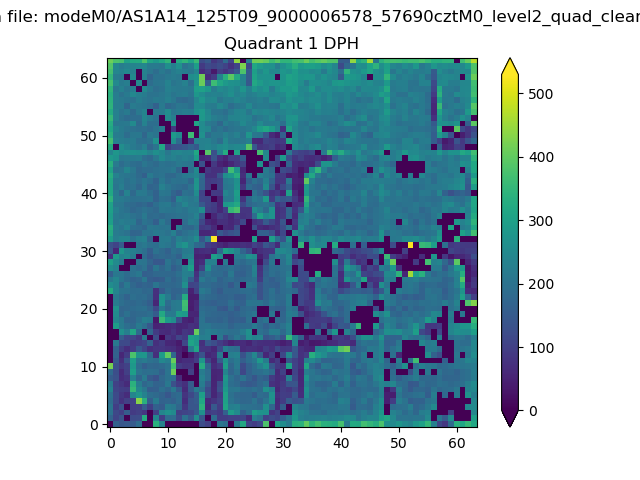 |
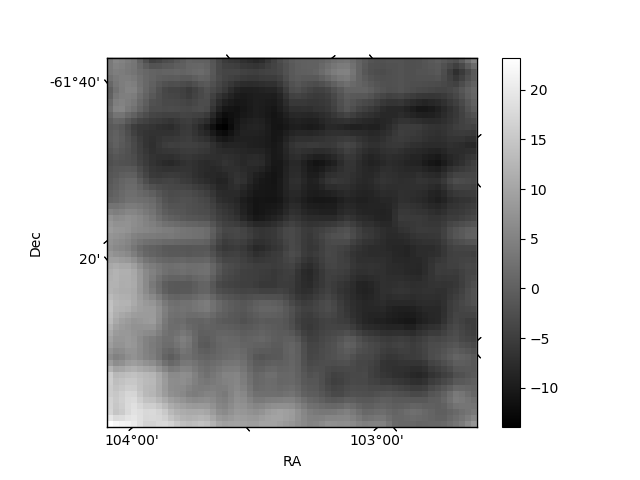
Quadrant B |
|---|---|---|---|
| Quadrant D | 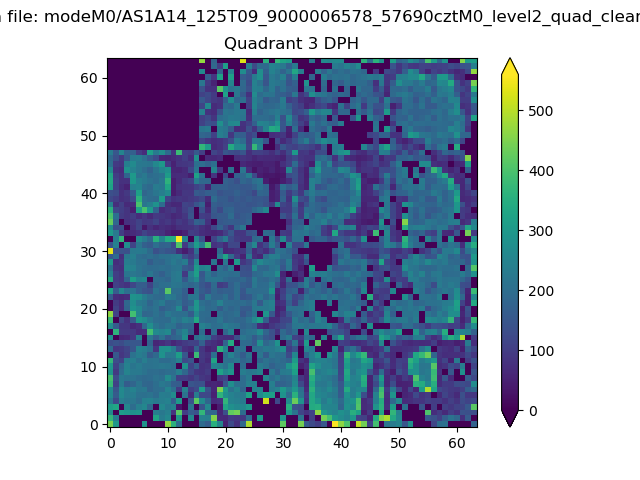 |
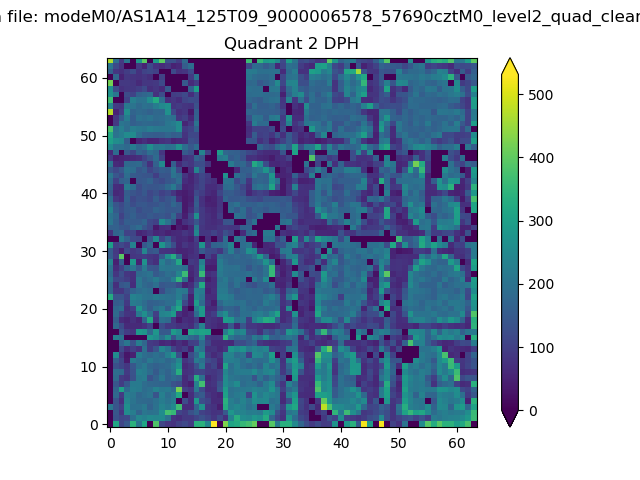 |
Quadrant C |
| Plot type | Count rate plots | Images |
|---|---|---|
| Comparison with Poisson distribution Blue bars denote a histogram of data divided into 1 sec bins. Red curve is a Poisson curve with rate = median count rate of data. |
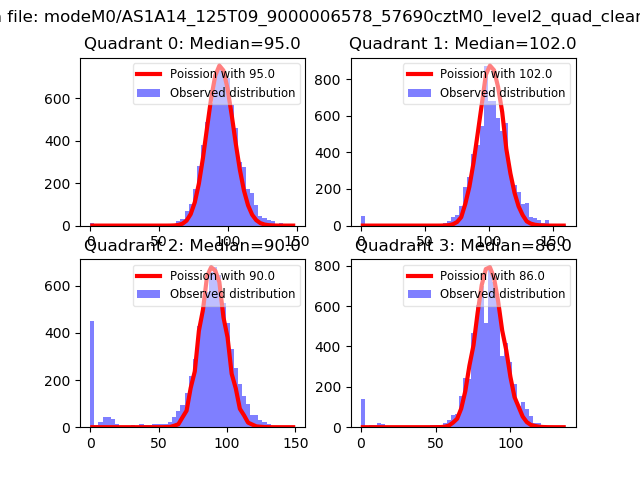 |
 |
| Quadrant-wise count rates Data is divided into 100 sec bins |
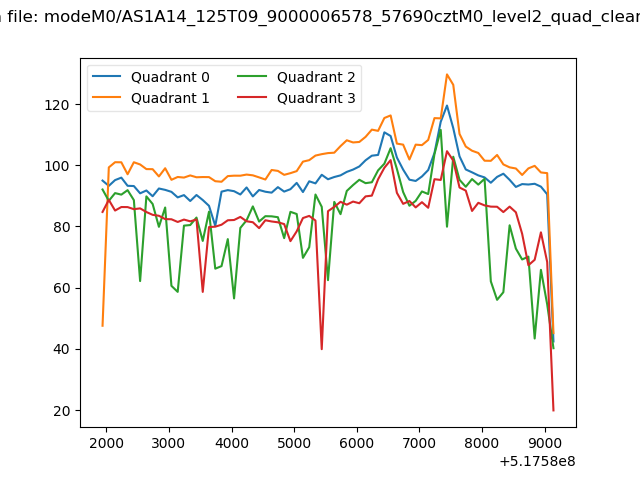 |
|
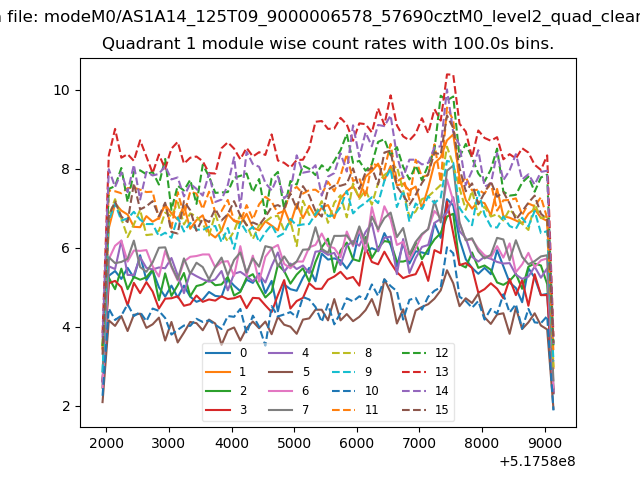
| Module-wise count rates for Quadrant A Data is divided into 100 sec bins |
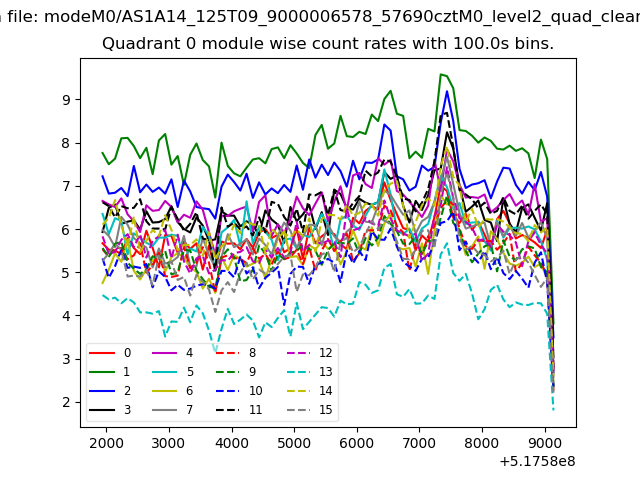 |
 |
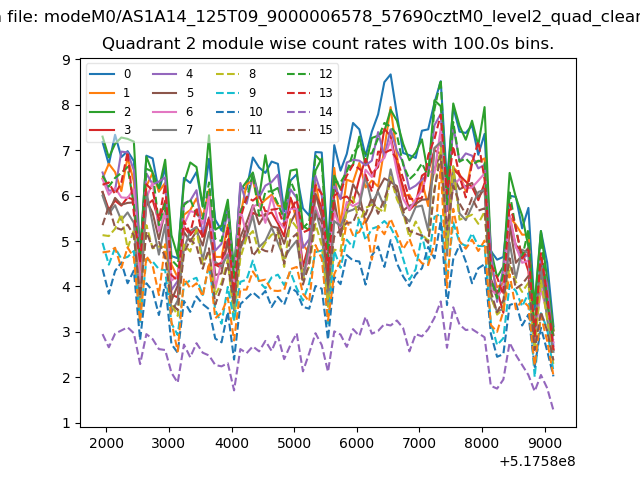
| Module-wise count rates for Quadrant B Data is divided into 100 sec bins |
 |
 |
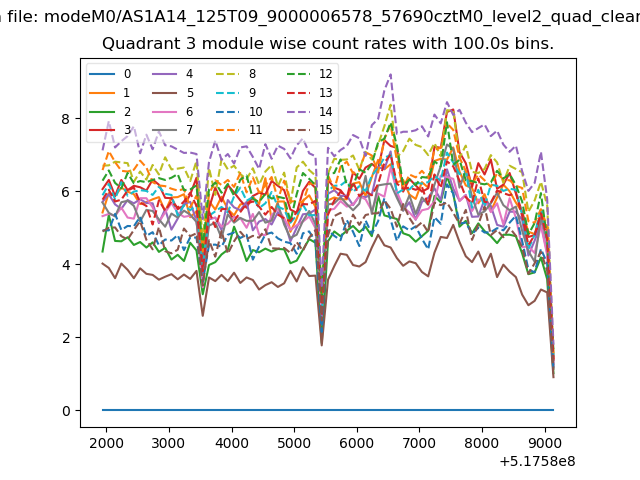
| Module-wise count rates for Quadrant C Data is divided into 100 sec bins |
 |
 |
| Module-wise count rates for Quadrant D Data is divided into 100 sec bins |
 |
 |
| Parameter | Plot |
|---|---|
| CZT HV Monitor | 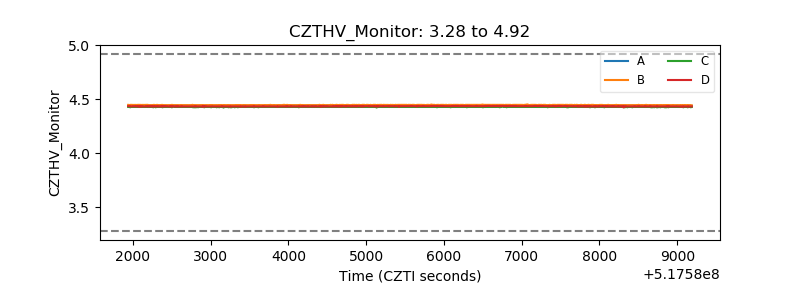 |
| D_VDD | 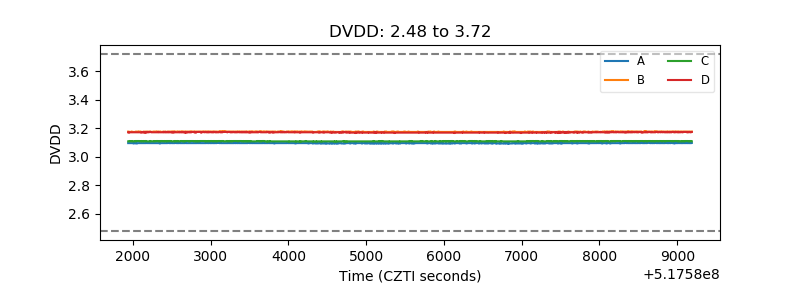 |
| Temperature 1 | 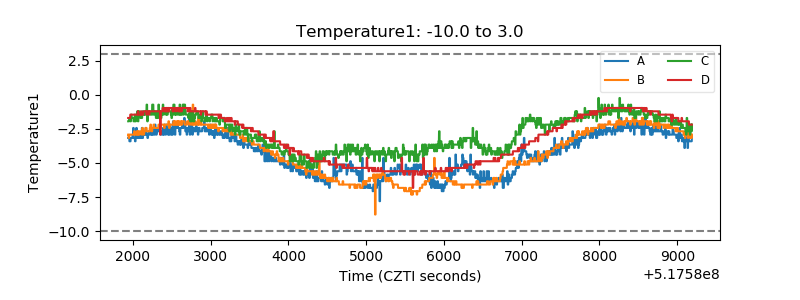 |
| Veto HV Monitor | 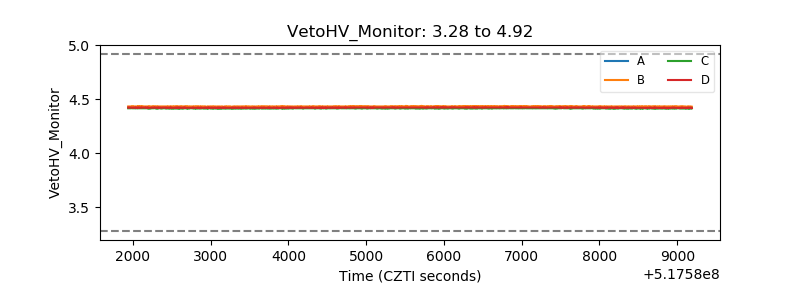 |
| Veto LLD | 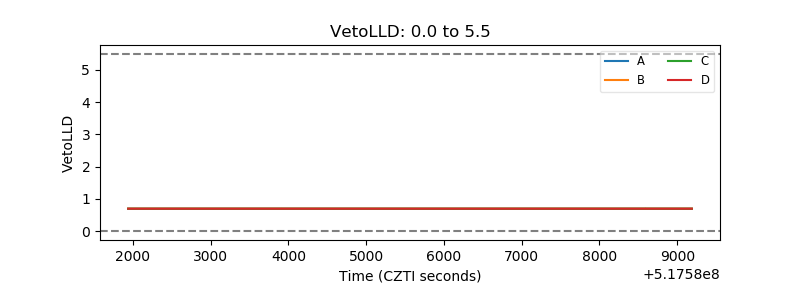 |
| Alpha Counter | 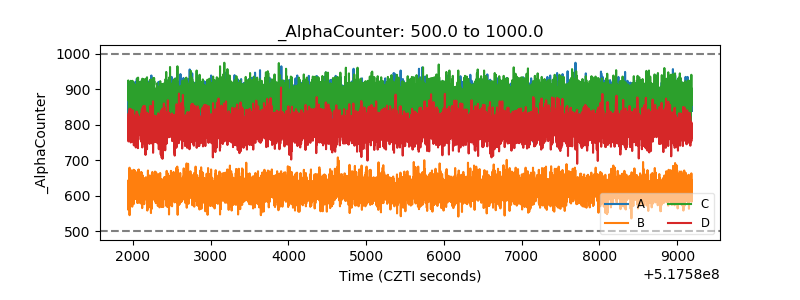 |
| _CPM_Rate | 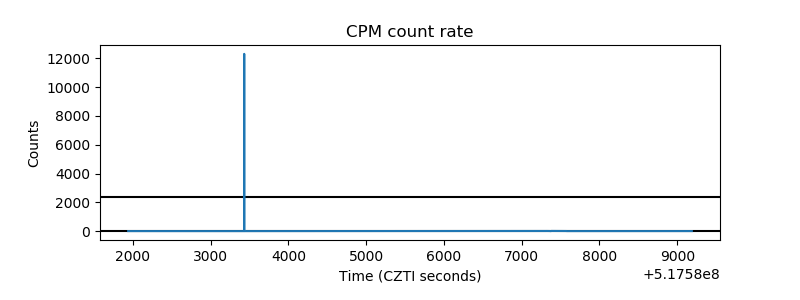 |
| CZT Counter | 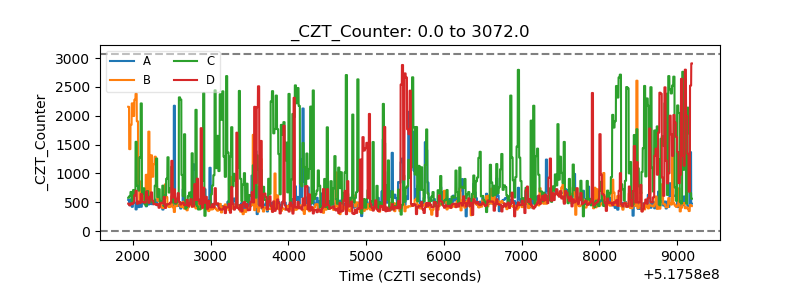 |
| +2.5 Volts monitor |  |
| +5 Volts monitor |  |
| _ROLL_ROT | 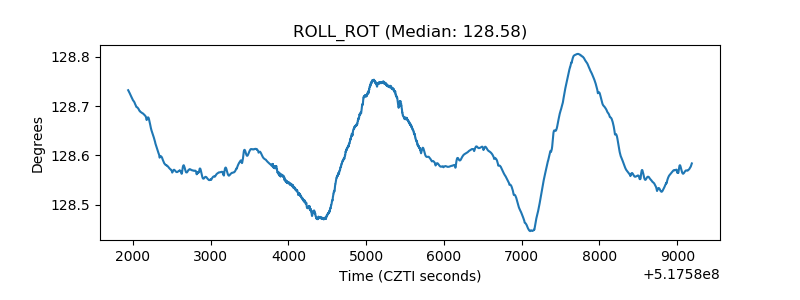 |
| _Roll_DEC | 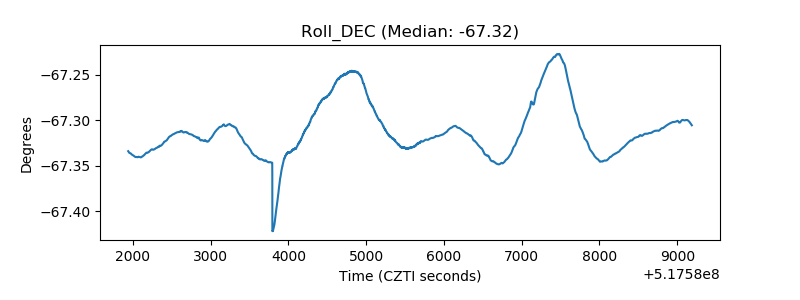 |
| _Roll_RA | 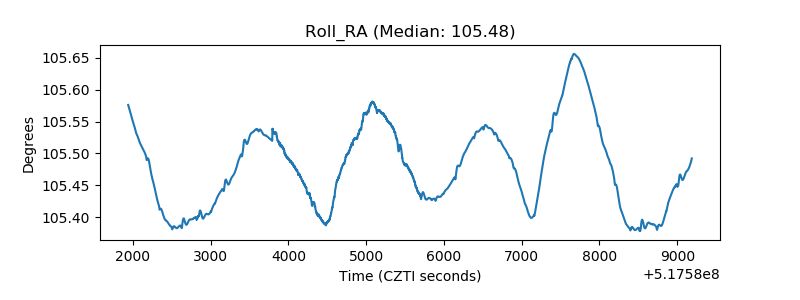 |
| Veto Counter | 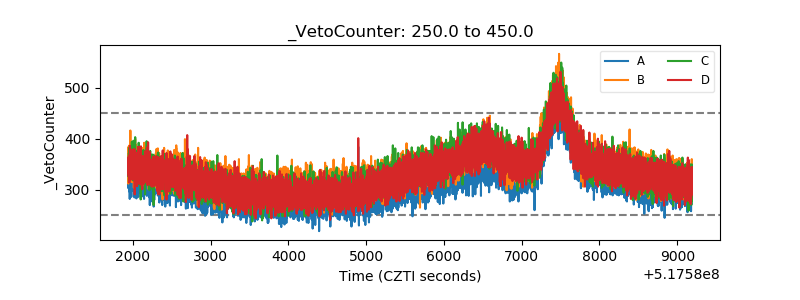 |