| Param | Original file | Final file |
|---|---|---|
| Filename | modeM0/AS1A14_125T09_9000006578_57693cztM0_level2.fits | modeM0/AS1A14_125T09_9000006578_57693cztM0_level2_quad_clean.evt |
| Size (bytes) | 1,591,640,640 | 249,416,640 |
| Size | 1.5 GB | 237.9 MB |
| Events in quadrant A | 13,628,059 | 1,637,656 |
| Events in quadrant B | 10,073,930 | 1,817,558 |
| Events in quadrant C | 13,698,387 | 1,576,582 |
| Events in quadrant D | 20,082,090 | 1,238,815 |
| Mode M9 | |||
|---|---|---|---|
| Quadrant | BADHDUFLAG | Total packets | Discarded packets |
| A | 0 | 16 | 0 |
| B | 0 | 16 | 0 |
| C | 0 | 16 | 0 |
| D | 0 | 16 | 0 |
| Mode SS | |||
|---|---|---|---|
| Quadrant | BADHDUFLAG | Total packets | Discarded packets |
| A | 0 | 378 | 0 |
| B | 0 | 378 | 0 |
| C | 0 | 378 | 0 |
| D | 0 | 378 | 0 |
| Mode M0 | |||
|---|---|---|---|
| Quadrant | BADHDUFLAG | Total packets | Discarded packets |
| A | 0 | 53391 | 3 |
| B | 0 | 43096 | 3 |
| C | 0 | 53555 | 3 |
| D | 0 | 72588 | 10 |
| Quadrant | Total seconds | Saturated seconds | Saturation percentage |
|---|---|---|---|
| A | 18580 | 1086 | 5.844995% |
| B | 18580 | 671 | 3.611410% |
| C | 18580 | 1027 | 5.527449% |
| D | 18579 | 3589 | 19.317509% |
Noise dominated data is calculated using 1-second bins in cleaned event files. If a bin has >2000 counts, and if more than 50% of those come from <1% of pixels, then it is considered to be noise-dominated and hence unusable.
| Quadrant | # 1 sec bins | Bins with >0 counts | Bins with >2000 counts | High rate bins dominated by noise | Noise dominated (total time) | Noise dominated (detector-on time) | Marked lightcurve |
|---|---|---|---|---|---|---|---|
| A | 20215 | 18583 | 927 | 927 | 4.59% | 4.99% | 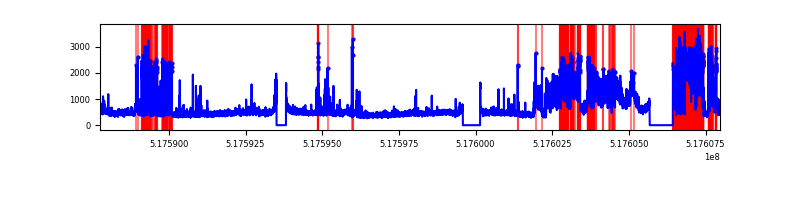 |
| B | 20215 | 18583 | 326 | 326 | 1.61% | 1.75% | 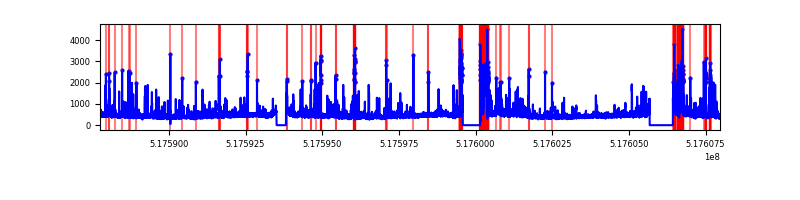 |
| C | 20215 | 18583 | 852 | 852 | 4.21% | 4.58% | 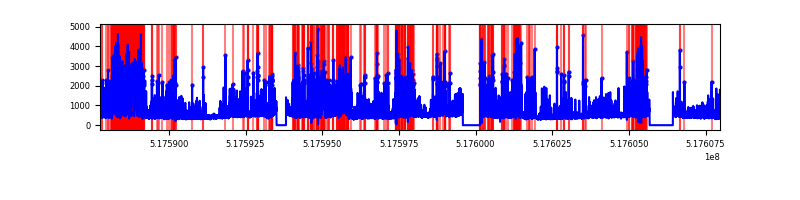 |
| D | 20214 | 18582 | 3460 | 3460 | 17.12% | 18.62% | 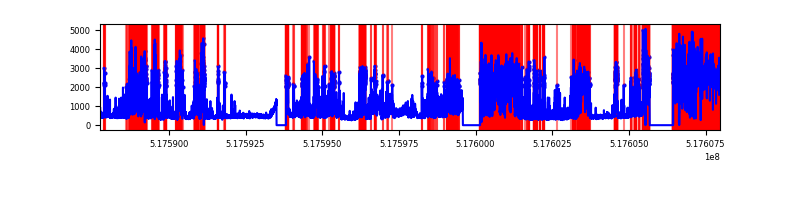 |
Top three noisy pixels from each quadrant. If the there are fewer than three noisy pixels in the level2.evt file, extra rows are filled as -1
| Pixel properties | Quadrant properties | ||||||
|---|---|---|---|---|---|---|---|
| Quadrant | DetID | PixID | Counts | Sigma | Mean | Median | Sigma |
| A | 3 | 14 | 5319491 | 10873.73 | 1982 | 1932 | 489.0 |
| A | 3 | 128 | 262499 | 532.83 | 1982 | 1932 | 489.0 |
| A | 3 | 245 | 226533 | 459.28 | 1982 | 1932 | 489.0 |
| B | 10 | 16 | 669974 | 1599.25 | 1959 | 1882 | 417.8 |
| B | 4 | 80 | 602196 | 1437.0 | 1959 | 1882 | 417.8 |
| B | 10 | 247 | 289507 | 688.5 | 1959 | 1882 | 417.8 |
| C | 15 | 224 | 3310255 | 6448.85 | 1897 | 1877 | 513.0 |
| C | 12 | 254 | 1168232 | 2273.52 | 1897 | 1877 | 513.0 |
| C | 12 | 252 | 570697 | 1108.77 | 1897 | 1877 | 513.0 |
| D | 8 | 160 | 5961187 | 12050.16 | 1750 | 1670 | 494.6 |
| D | 8 | 240 | 5717210 | 11556.84 | 1750 | 1670 | 494.6 |
| D | 3 | 12 | 536264 | 1080.95 | 1750 | 1670 | 494.6 |
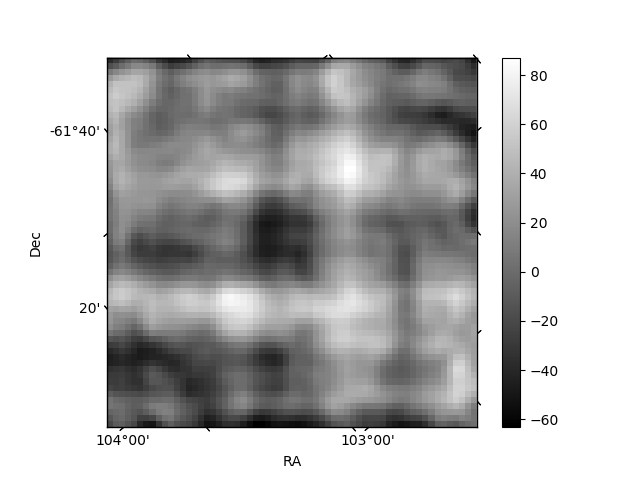
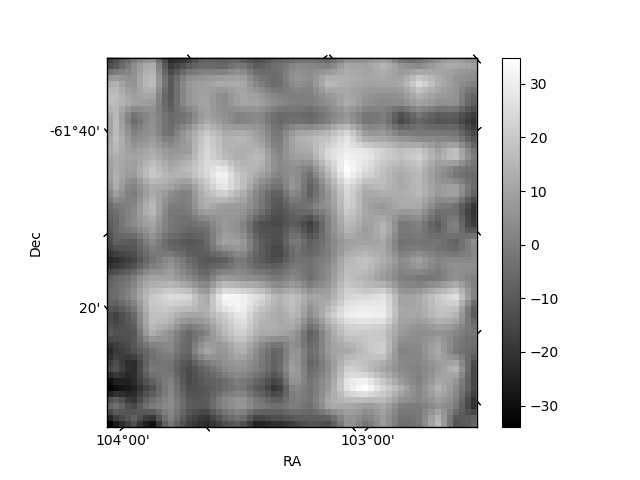
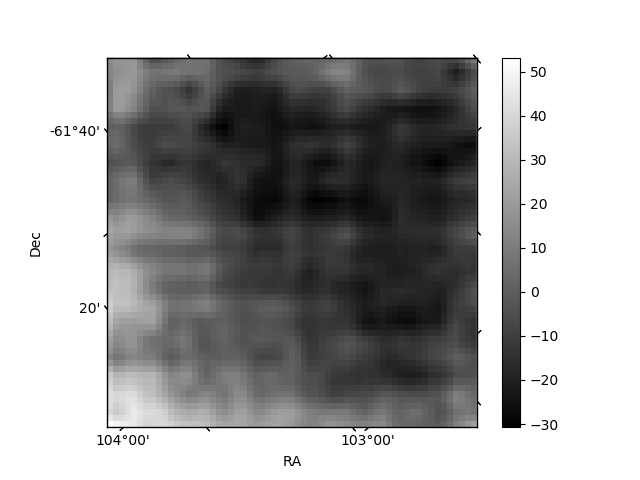
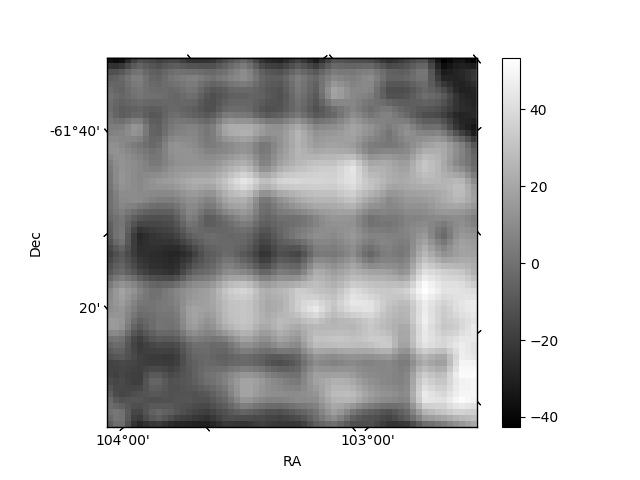
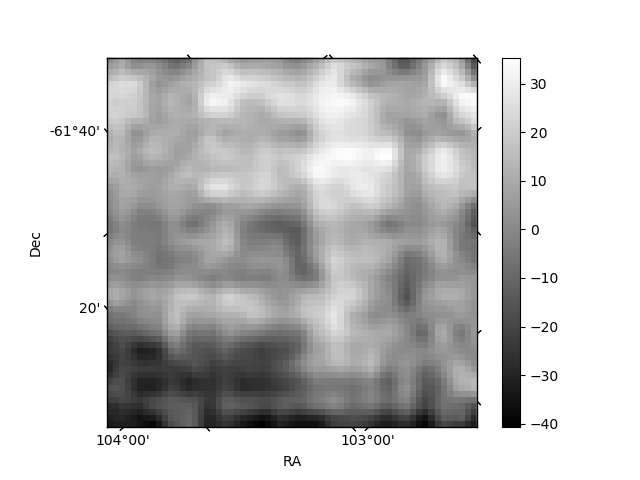
Histogram calculated using DETX and DETY for each event in the final _common_clean file
| Quadrant A | 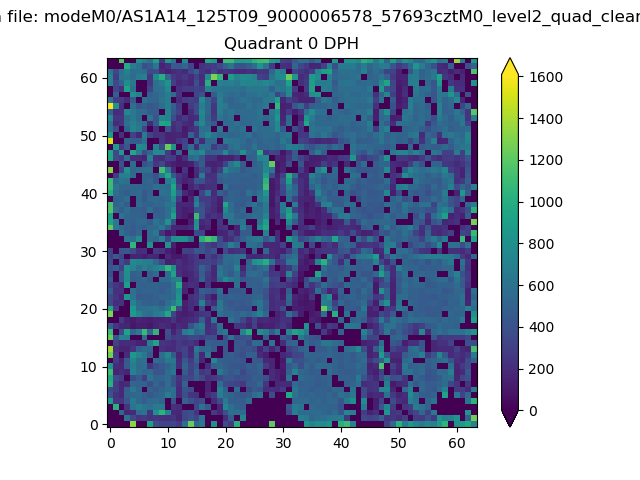 |
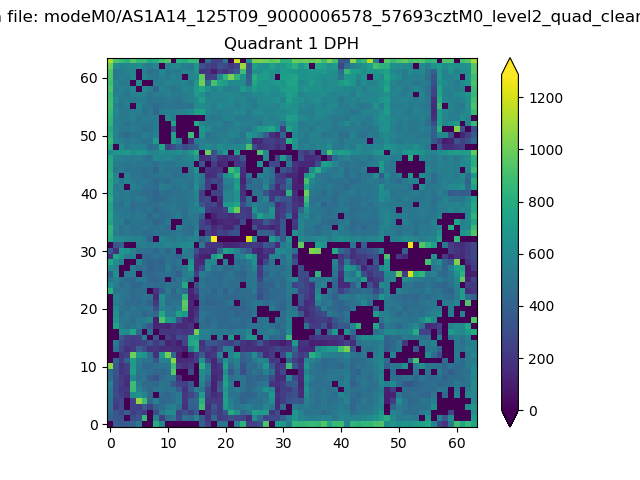 |
Quadrant B |
|---|---|---|---|
| Quadrant D | 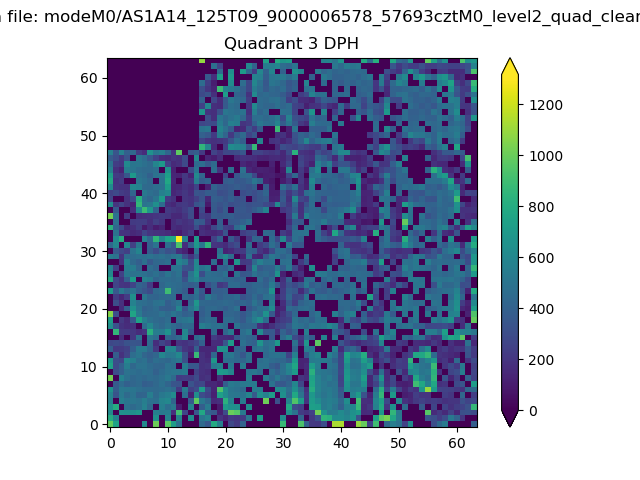 |
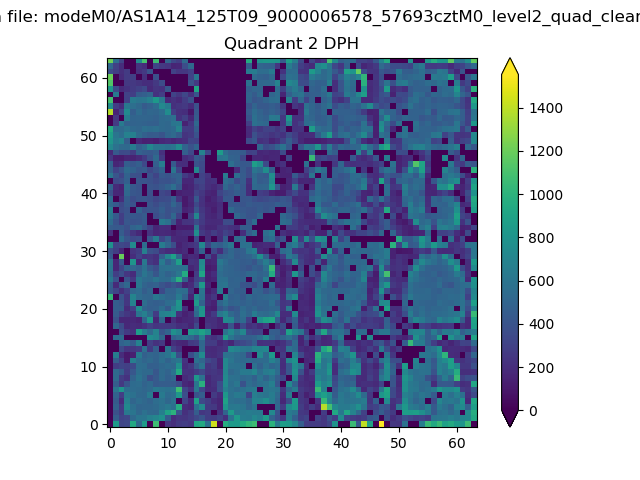 |
Quadrant C |
| Plot type | Count rate plots | Images |
|---|---|---|
| Comparison with Poisson distribution Blue bars denote a histogram of data divided into 1 sec bins. Red curve is a Poisson curve with rate = median count rate of data. |
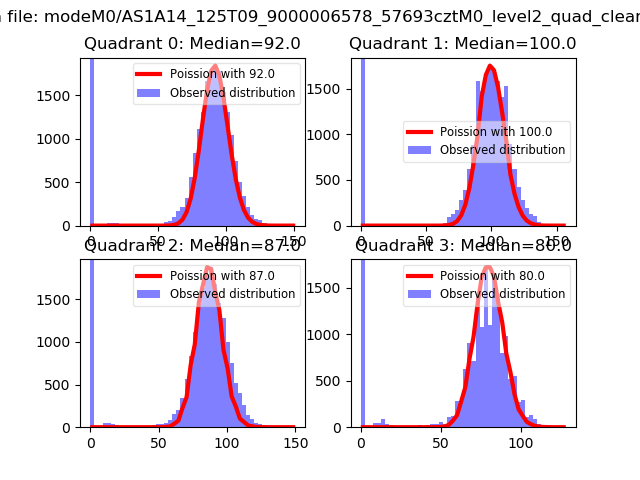 |
 |
| Quadrant-wise count rates Data is divided into 100 sec bins |
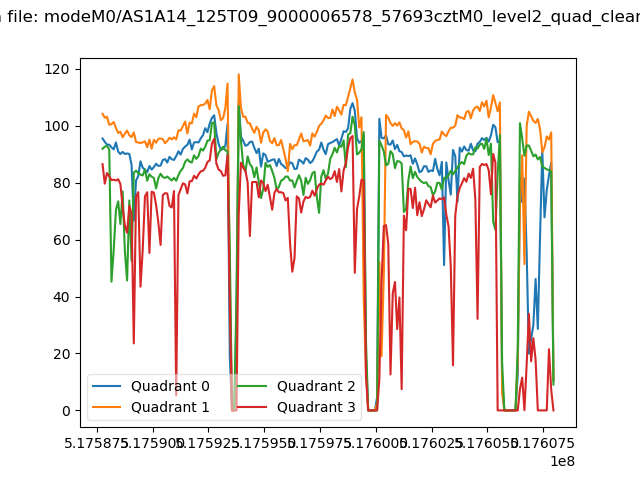 |
|
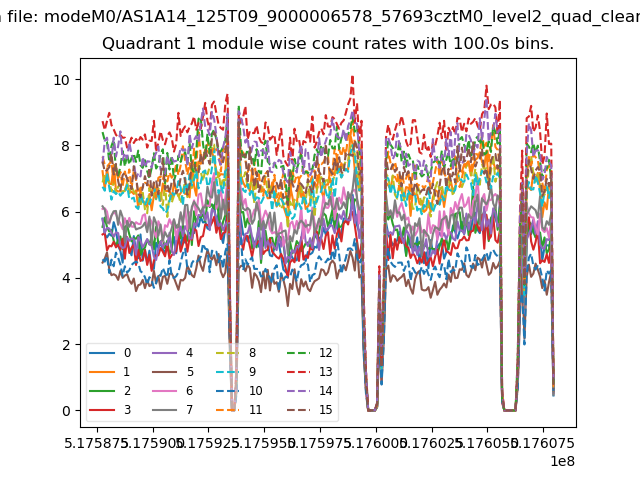
| Module-wise count rates for Quadrant A Data is divided into 100 sec bins |
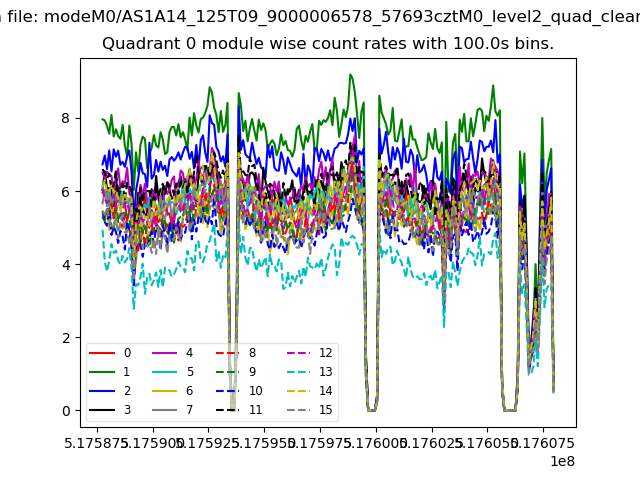 |
 |
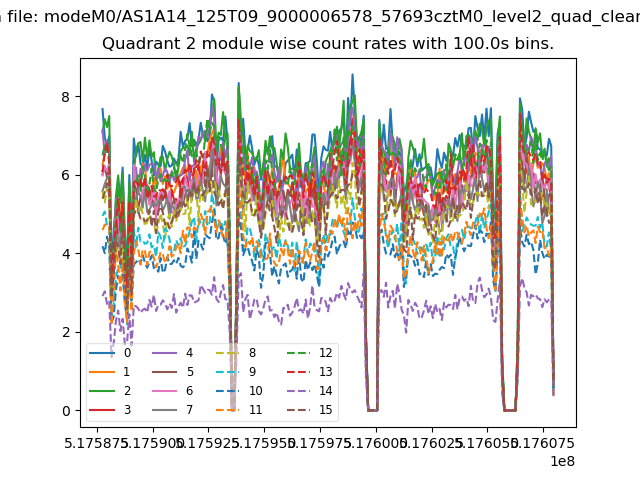
| Module-wise count rates for Quadrant B Data is divided into 100 sec bins |
 |
 |
| Module-wise count rates for Quadrant C Data is divided into 100 sec bins |
 |
 |
| Module-wise count rates for Quadrant D Data is divided into 100 sec bins |
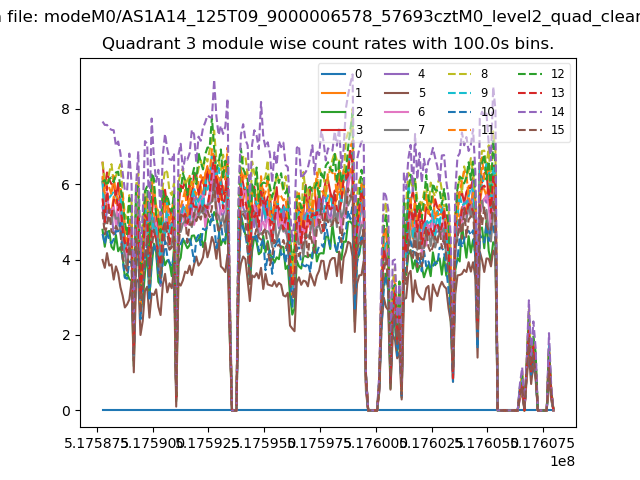 |
 |
| Parameter | Plot |
|---|---|
| CZT HV Monitor | 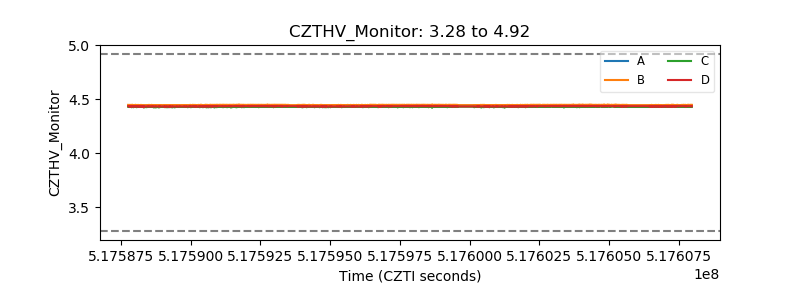 |
| D_VDD | 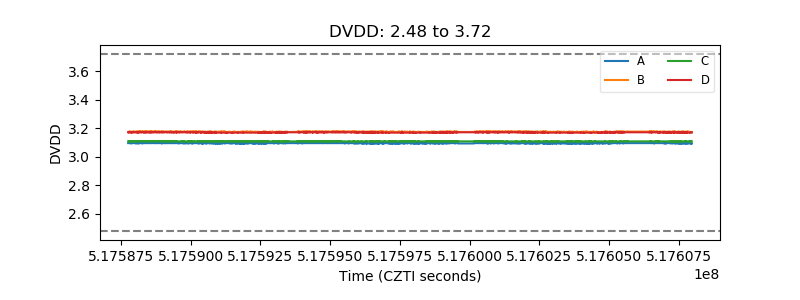 |
| Temperature 1 | 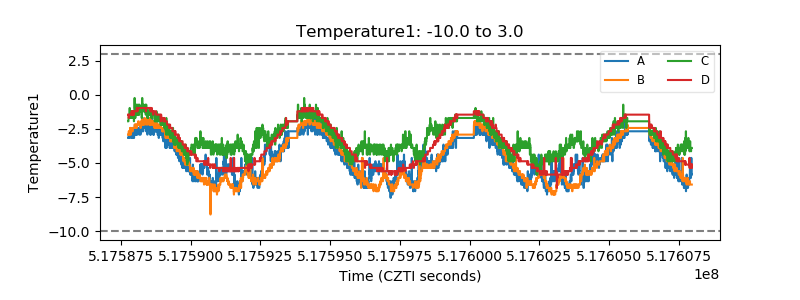 |
| Veto HV Monitor | 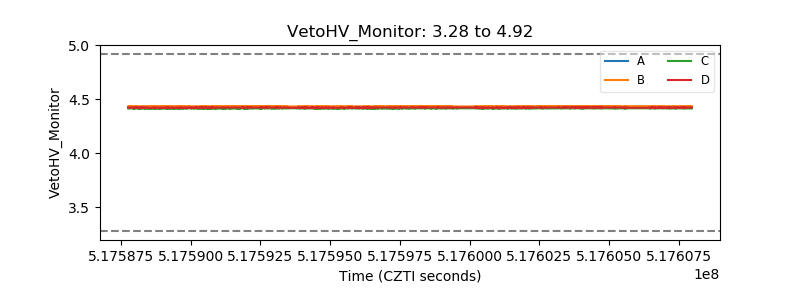 |
| Veto LLD | 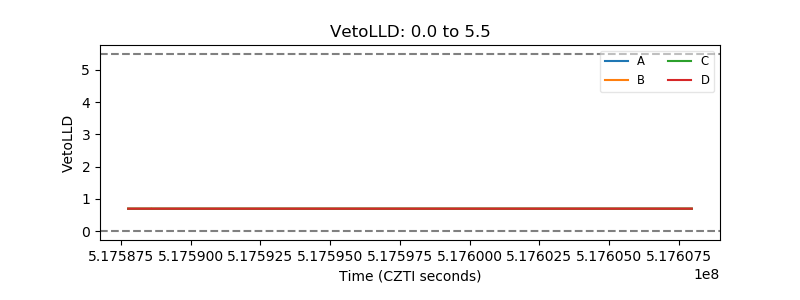 |
| Alpha Counter | 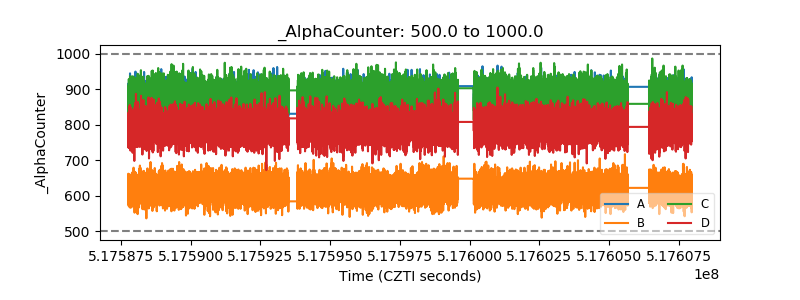 |
| _CPM_Rate | 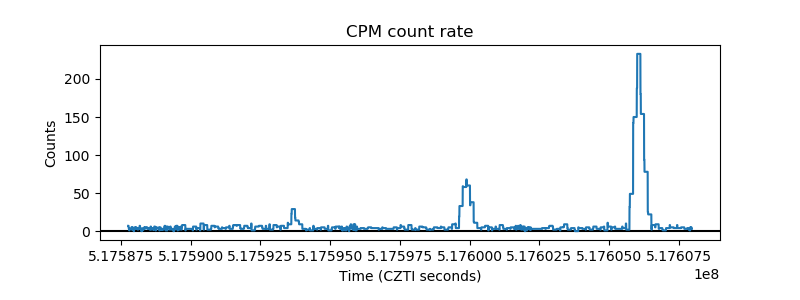 |
| CZT Counter | 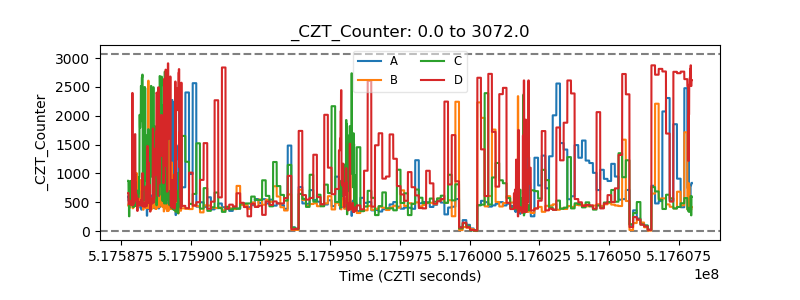 |
| +2.5 Volts monitor | 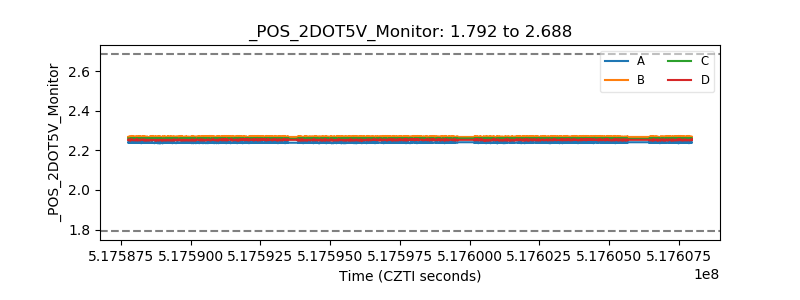 |
| +5 Volts monitor | 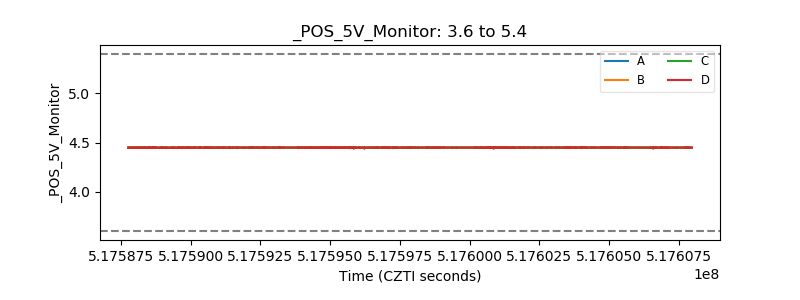 |
| _ROLL_ROT | 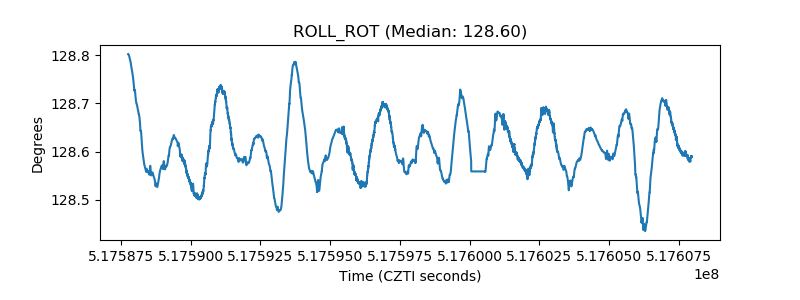 |
| _Roll_DEC | 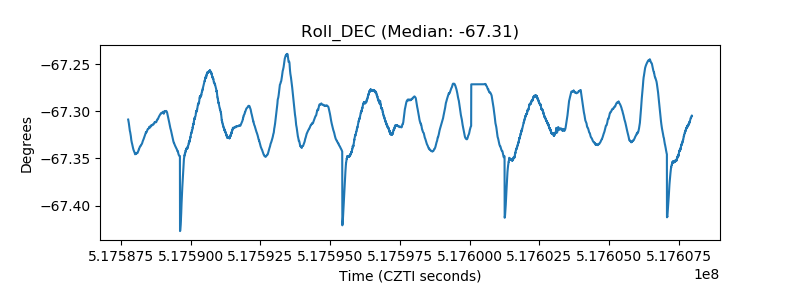 |
| _Roll_RA | 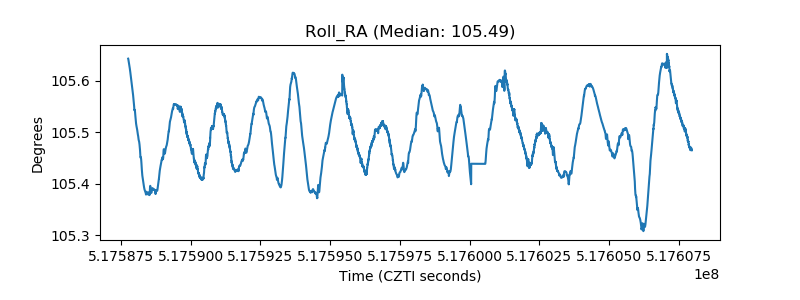 |
| Veto Counter | 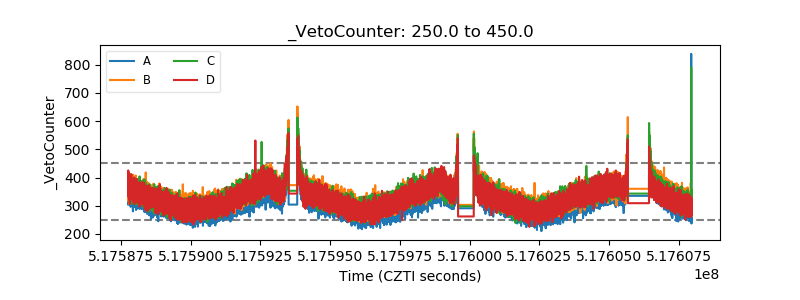 |