| Param | Original file | Final file |
|---|---|---|
| Filename | modeM0/AS1A14_125T09_9000006578_57696cztM0_level2.fits | modeM0/AS1A14_125T09_9000006578_57696cztM0_level2_quad_clean.evt |
| Size (bytes) | 583,303,680 | 90,293,760 |
| Size | 556.3 MB | 86.1 MB |
| Events in quadrant A | 2,829,915 | 644,755 |
| Events in quadrant B | 3,472,934 | 677,438 |
| Events in quadrant C | 3,797,549 | 602,087 |
| Events in quadrant D | 10,983,487 | 353,320 |
| Mode M9 | |||
|---|---|---|---|
| Quadrant | BADHDUFLAG | Total packets | Discarded packets |
| A | 0 | 13 | 0 |
| B | 0 | 14 | 0 |
| C | 0 | 14 | 0 |
| D | 0 | 14 | 0 |
| Mode SS | |||
|---|---|---|---|
| Quadrant | BADHDUFLAG | Total packets | Discarded packets |
| A | 0 | 134 | 0 |
| B | 0 | 134 | 0 |
| C | 0 | 134 | 0 |
| D | 0 | 134 | 0 |
| Mode M0 | |||
|---|---|---|---|
| Quadrant | BADHDUFLAG | Total packets | Discarded packets |
| A | 0 | 13301 | 2 |
| B | 0 | 14978 | 2 |
| C | 0 | 15796 | 2 |
| D | 0 | 37178 | 2 |
| Quadrant | Total seconds | Saturated seconds | Saturation percentage |
|---|---|---|---|
| A | 6540 | 14 | 0.214067% |
| B | 6540 | 191 | 2.920489% |
| C | 6540 | 110 | 1.681957% |
| D | 6540 | 2680 | 40.978593% |
Noise dominated data is calculated using 1-second bins in cleaned event files. If a bin has >2000 counts, and if more than 50% of those come from <1% of pixels, then it is considered to be noise-dominated and hence unusable.
| Quadrant | # 1 sec bins | Bins with >0 counts | Bins with >2000 counts | High rate bins dominated by noise | Noise dominated (total time) | Noise dominated (detector-on time) | Marked lightcurve |
|---|---|---|---|---|---|---|---|
| A | 7625 | 6541 | 4 | 4 | 0.05% | 0.06% | 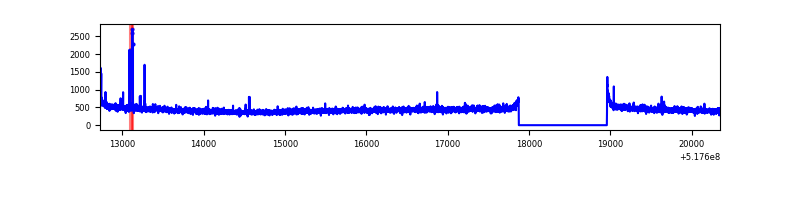 |
| B | 7625 | 6541 | 90 | 90 | 1.18% | 1.38% | 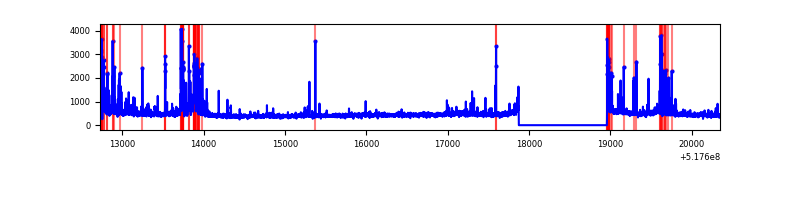 |
| C | 7625 | 6541 | 89 | 89 | 1.17% | 1.36% | 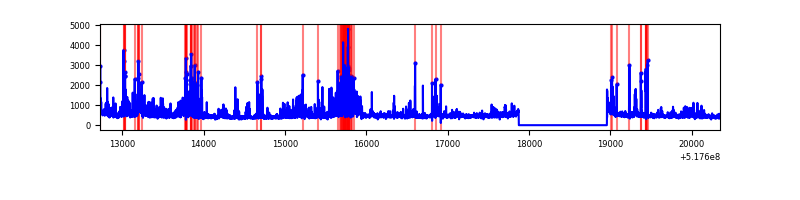 |
| D | 7625 | 6540 | 2732 | 2732 | 35.83% | 41.77% | 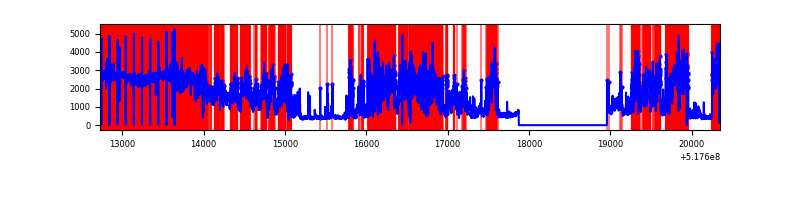 |
Top three noisy pixels from each quadrant. If the there are fewer than three noisy pixels in the level2.evt file, extra rows are filled as -1
| Pixel properties | Quadrant properties | ||||||
|---|---|---|---|---|---|---|---|
| Quadrant | DetID | PixID | Counts | Sigma | Mean | Median | Sigma |
| A | 3 | 14 | 25069 | 138.19 | 711 | 693 | 176.4 |
| A | 3 | 128 | 24523 | 135.09 | 711 | 693 | 176.4 |
| A | 3 | 245 | 15553 | 84.24 | 711 | 693 | 176.4 |
| B | 10 | 16 | 420878 | 2852.35 | 695 | 669 | 147.3 |
| B | 4 | 142 | 60540 | 406.4 | 695 | 669 | 147.3 |
| B | 10 | 247 | 37452 | 249.68 | 695 | 669 | 147.3 |
| C | 15 | 224 | 672587 | 3587.63 | 685 | 680 | 187.3 |
| C | 14 | 246 | 152433 | 810.28 | 685 | 680 | 187.3 |
| C | 14 | 67 | 84005 | 444.91 | 685 | 680 | 187.3 |
| D | 8 | 240 | 8656720 | 58690.87 | 514 | 489 | 147.5 |
| D | 8 | 160 | 66961 | 450.69 | 514 | 489 | 147.5 |
| D | 2 | 31 | 62688 | 421.72 | 514 | 489 | 147.5 |
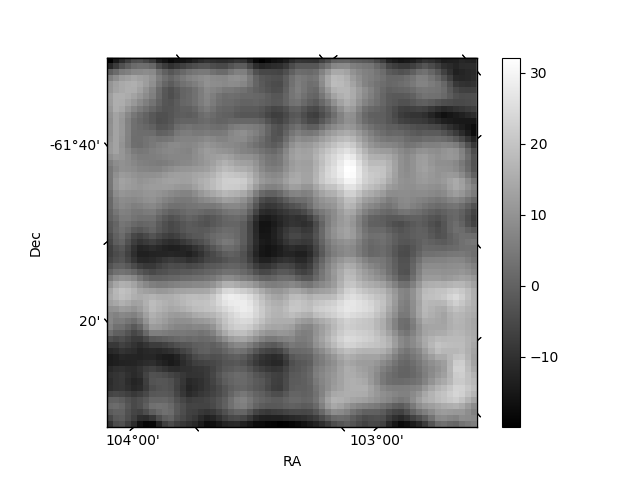
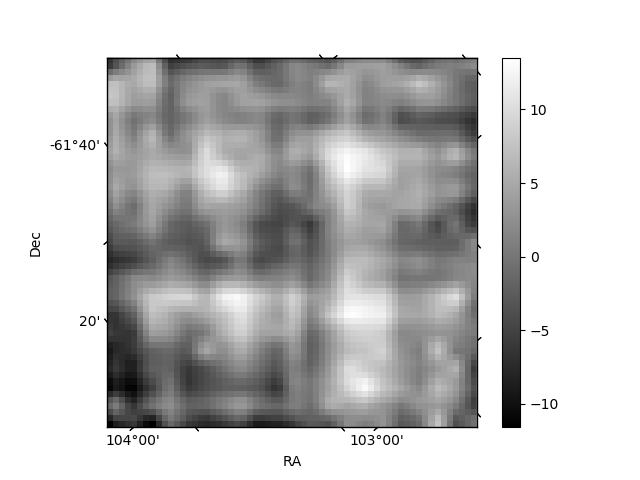
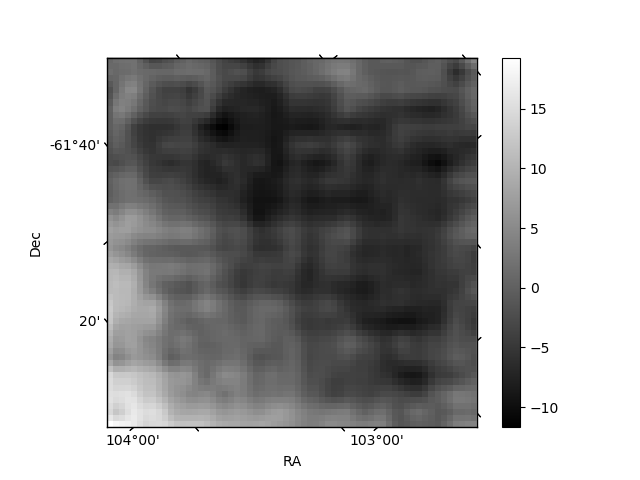
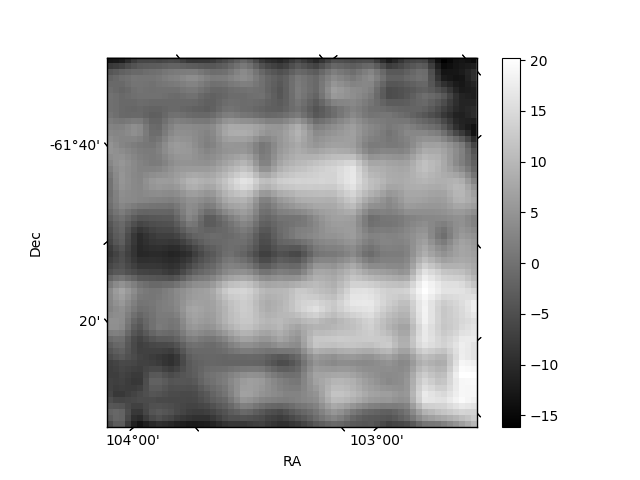
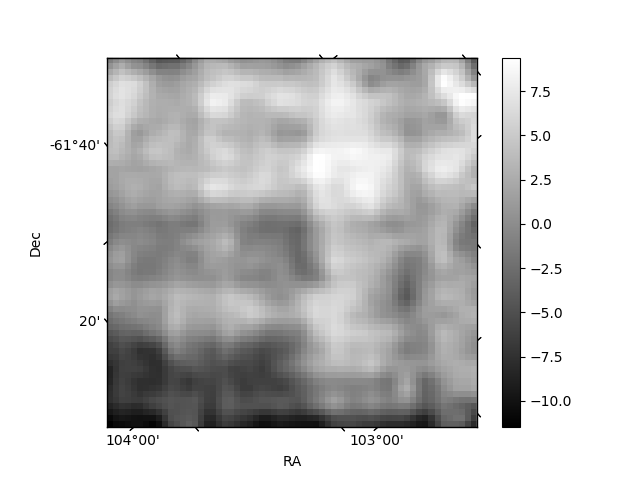
Histogram calculated using DETX and DETY for each event in the final _common_clean file
| Quadrant A | 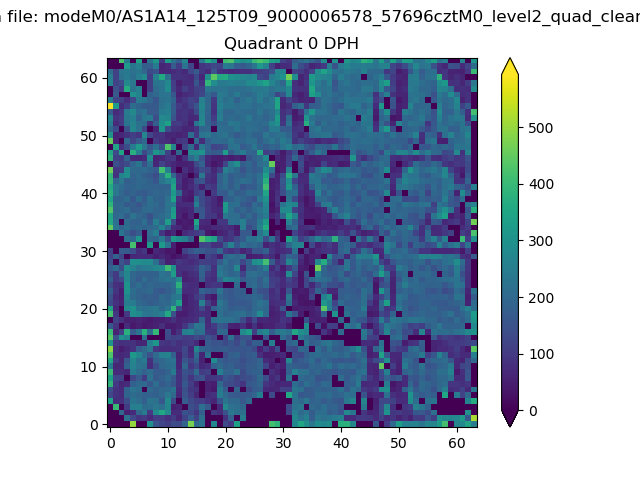 |
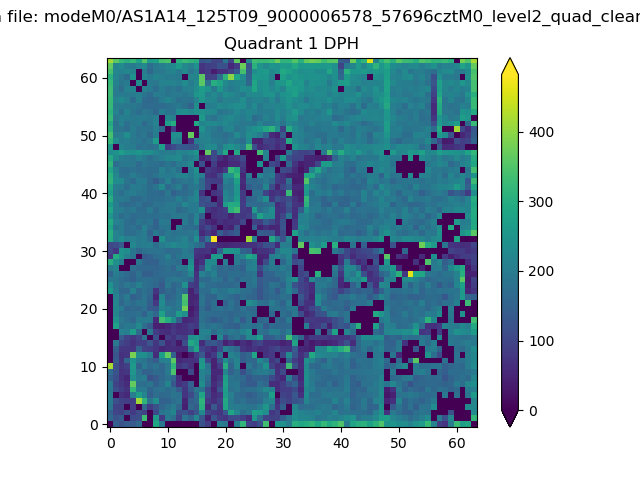 |
Quadrant B |
|---|---|---|---|
| Quadrant D | 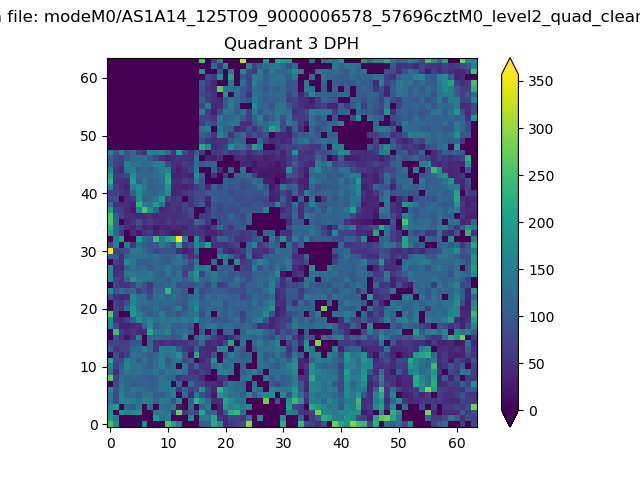 |
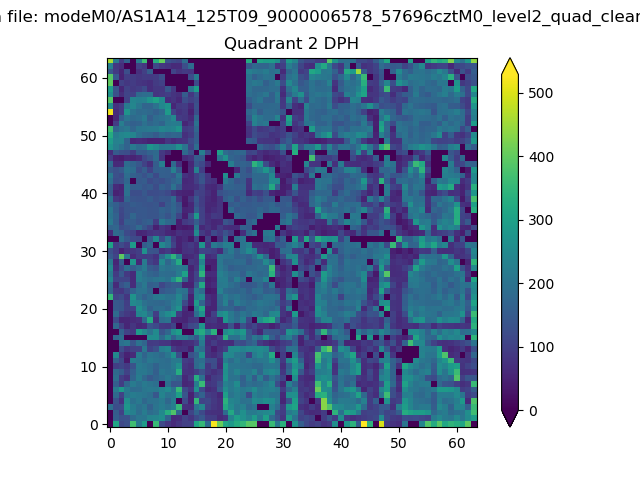 |
Quadrant C |
| Plot type | Count rate plots | Images |
|---|---|---|
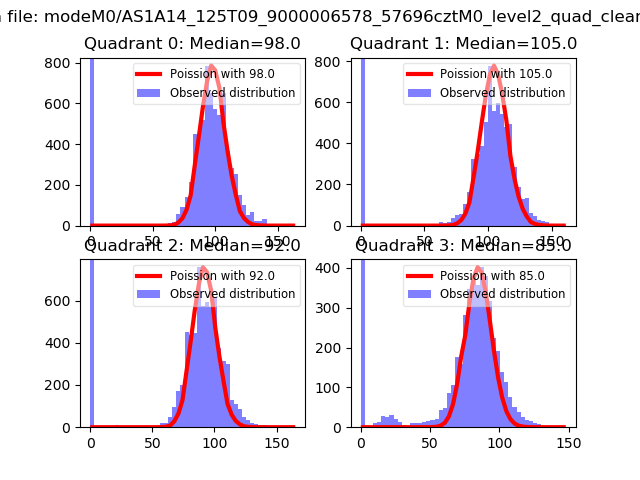
| Comparison with Poisson distribution Blue bars denote a histogram of data divided into 1 sec bins. Red curve is a Poisson curve with rate = median count rate of data. |
 |
 |
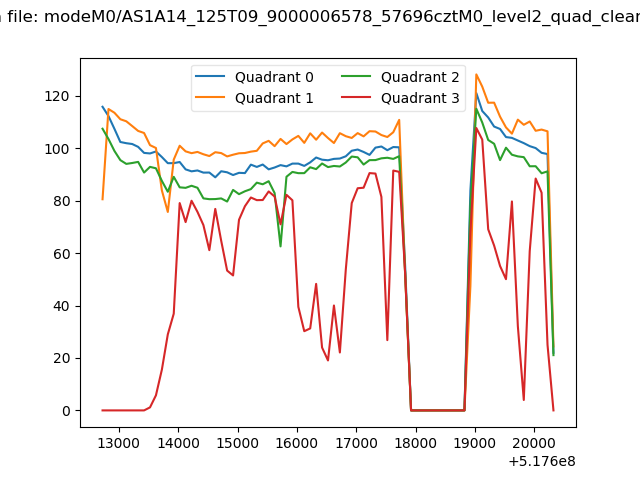
| Quadrant-wise count rates Data is divided into 100 sec bins |
 |
|
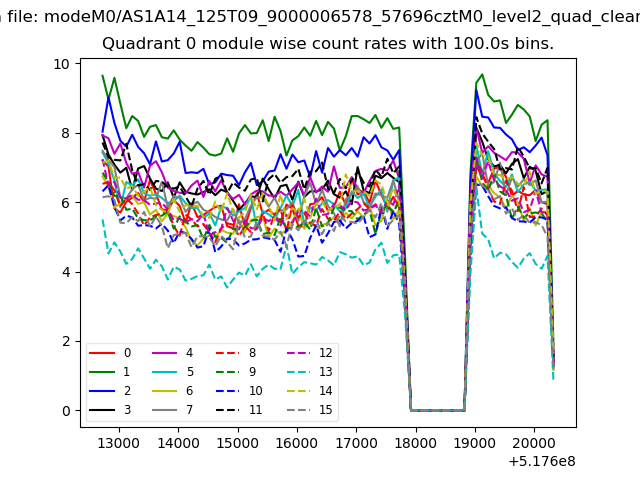
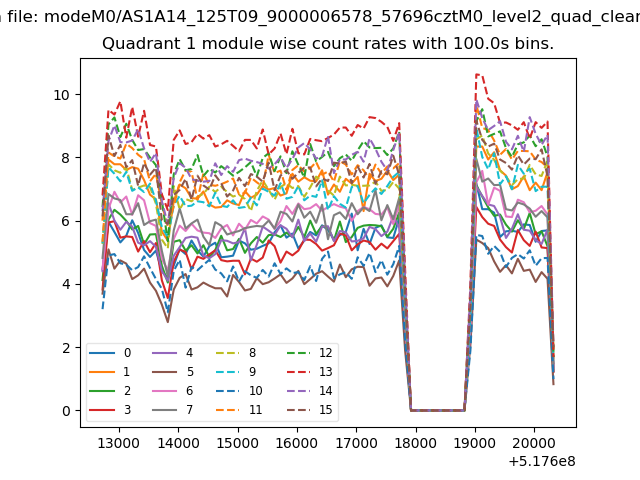
| Module-wise count rates for Quadrant A Data is divided into 100 sec bins |
 |
 |
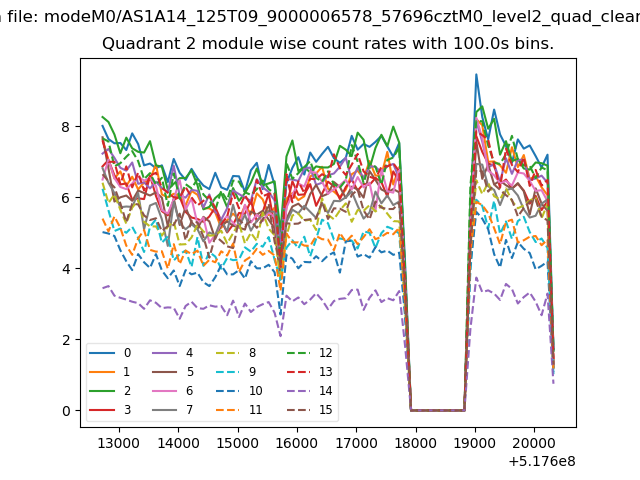
| Module-wise count rates for Quadrant B Data is divided into 100 sec bins |
 |
 |
| Module-wise count rates for Quadrant C Data is divided into 100 sec bins |
 |
 |
| Module-wise count rates for Quadrant D Data is divided into 100 sec bins |
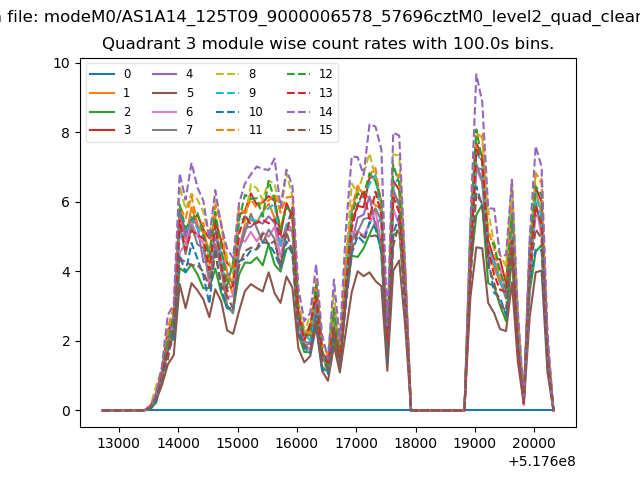 |
 |
| Parameter | Plot |
|---|---|
| CZT HV Monitor | 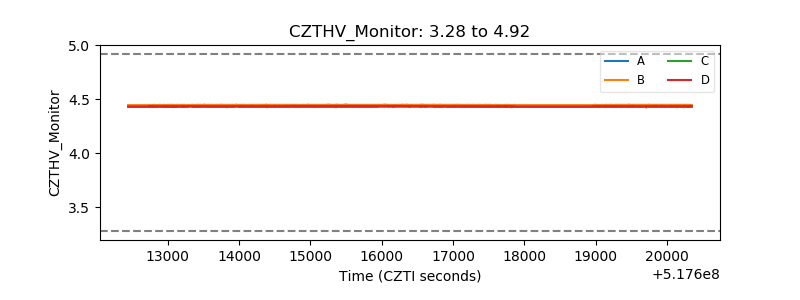 |
| D_VDD | 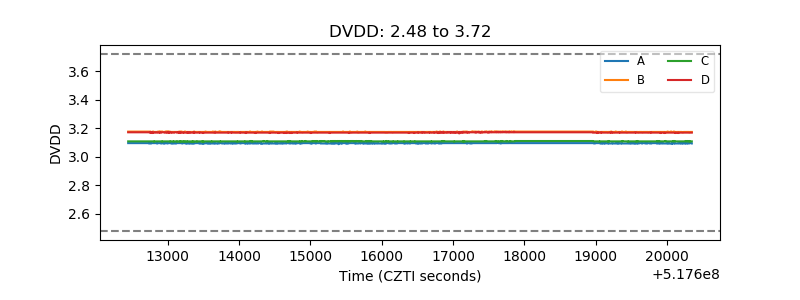 |
| Temperature 1 | 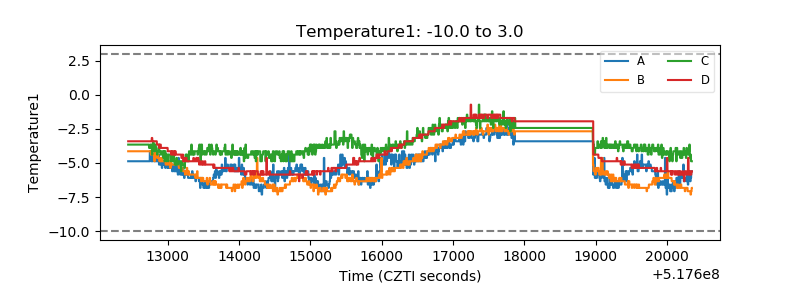 |
| Veto HV Monitor | 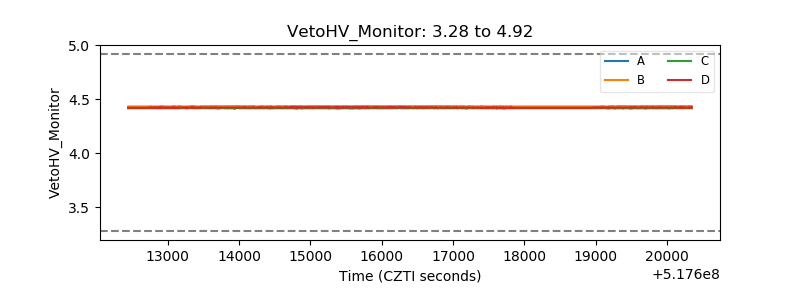 |
| Veto LLD | 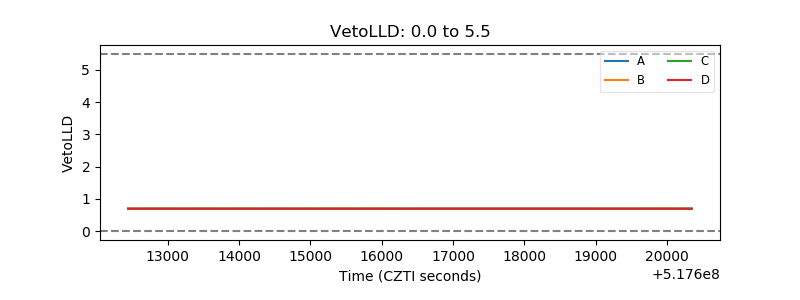 |
| Alpha Counter | 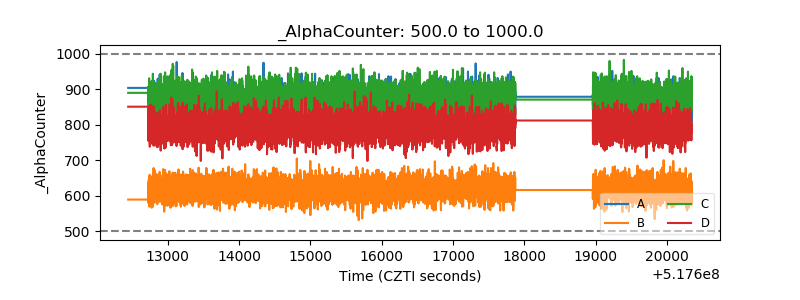 |
| _CPM_Rate | 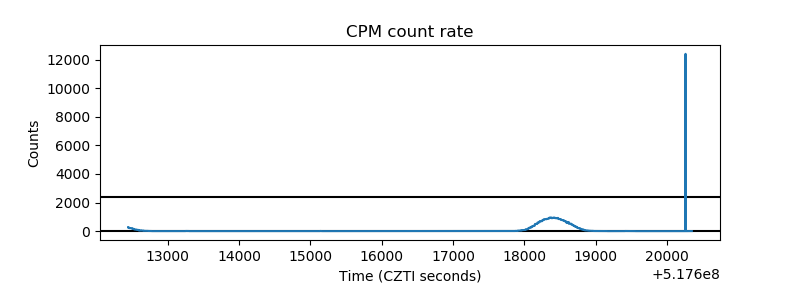 |
| CZT Counter | 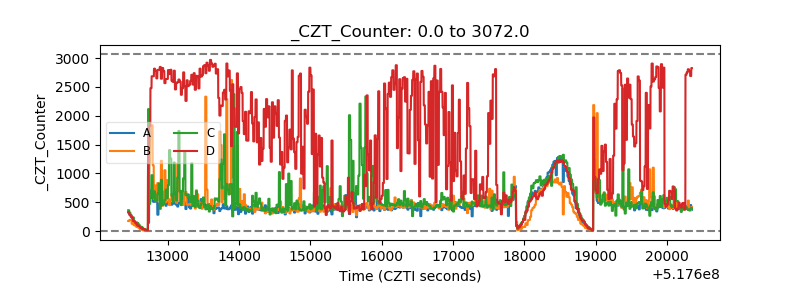 |
| +2.5 Volts monitor |  |
| +5 Volts monitor |  |
| _ROLL_ROT | 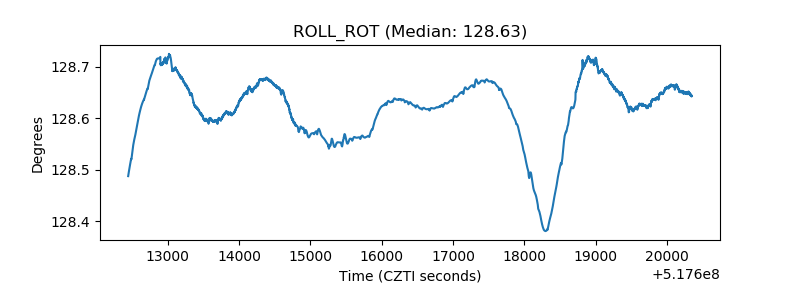 |
| _Roll_DEC | 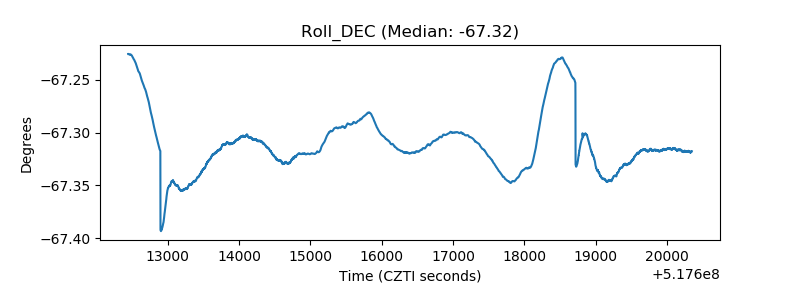 |
| _Roll_RA | 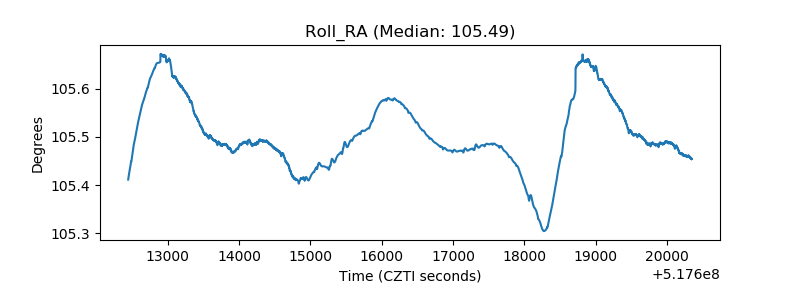 |
| Veto Counter | 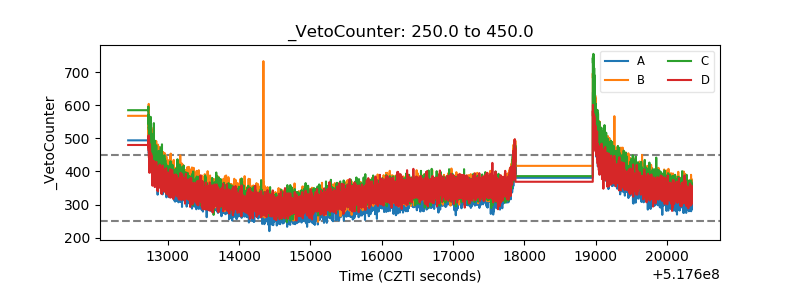 |