| Param | Original file | Final file |
|---|---|---|
| Filename | modeM0/AS1A14_125T09_9000006578_57701cztM0_level2.fits | modeM0/AS1A14_125T09_9000006578_57701cztM0_level2_quad_clean.evt |
| Size (bytes) | 406,244,160 | 96,217,920 |
| Size | 387.4 MB | 91.8 MB |
| Events in quadrant A | 3,291,610 | 628,010 |
| Events in quadrant B | 3,393,445 | 673,096 |
| Events in quadrant C | 4,462,255 | 594,655 |
| Events in quadrant D | 3,384,788 | 564,415 |
| Mode M9 | |||
|---|---|---|---|
| Quadrant | BADHDUFLAG | Total packets | Discarded packets |
| A | 0 | 8 | 0 |
| B | 0 | 8 | 0 |
| C | 0 | 8 | 0 |
| D | 0 | 8 | 0 |
| Mode SS | |||
|---|---|---|---|
| Quadrant | BADHDUFLAG | Total packets | Discarded packets |
| A | 0 | 132 | 0 |
| B | 0 | 132 | 0 |
| C | 0 | 132 | 0 |
| D | 0 | 132 | 0 |
| Mode M0 | |||
|---|---|---|---|
| Quadrant | BADHDUFLAG | Total packets | Discarded packets |
| A | 0 | 14131 | 1 |
| B | 0 | 14578 | 1 |
| C | 0 | 17796 | 2 |
| D | 0 | 14765 | 1 |
| Quadrant | Total seconds | Saturated seconds | Saturation percentage |
|---|---|---|---|
| A | 6499 | 122 | 1.877212% |
| B | 6500 | 174 | 2.676923% |
| C | 6499 | 258 | 3.969842% |
| D | 6499 | 138 | 2.123404% |
Noise dominated data is calculated using 1-second bins in cleaned event files. If a bin has >2000 counts, and if more than 50% of those come from <1% of pixels, then it is considered to be noise-dominated and hence unusable.
| Quadrant | # 1 sec bins | Bins with >0 counts | Bins with >2000 counts | High rate bins dominated by noise | Noise dominated (total time) | Noise dominated (detector-on time) | Marked lightcurve |
|---|---|---|---|---|---|---|---|
| A | 7244 | 6500 | 29 | 29 | 0.40% | 0.45% | 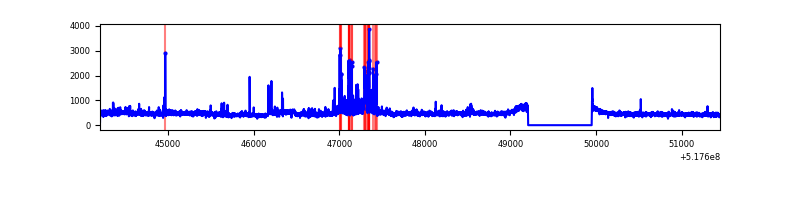 |
| B | 7245 | 6501 | 32 | 32 | 0.44% | 0.49% | 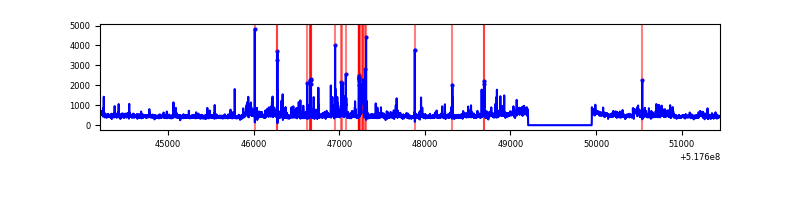 |
| C | 7244 | 6500 | 146 | 146 | 2.02% | 2.25% | 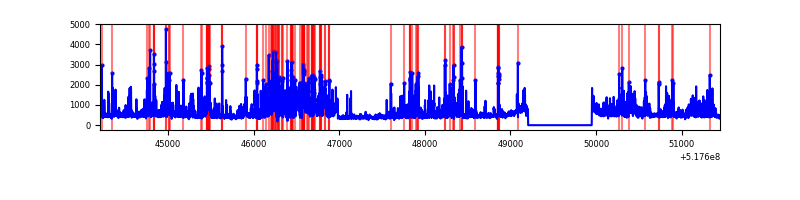 |
| D | 7244 | 6500 | 51 | 51 | 0.70% | 0.78% | 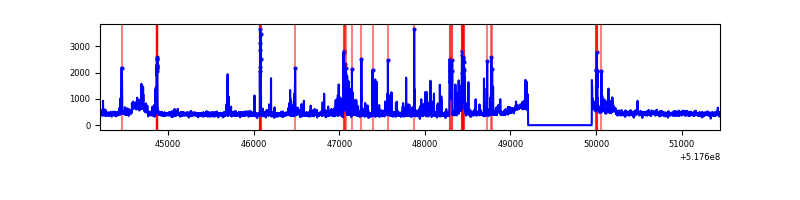 |
Top three noisy pixels from each quadrant. If the there are fewer than three noisy pixels in the level2.evt file, extra rows are filled as -1
| Pixel properties | Quadrant properties | ||||||
|---|---|---|---|---|---|---|---|
| Quadrant | DetID | PixID | Counts | Sigma | Mean | Median | Sigma |
| A | 3 | 14 | 257456 | 1462.68 | 713 | 694 | 175.5 |
| A | 3 | 245 | 178204 | 1011.21 | 713 | 694 | 175.5 |
| A | 3 | 128 | 70451 | 397.38 | 713 | 694 | 175.5 |
| B | 4 | 80 | 198235 | 1323.18 | 703 | 677 | 149.3 |
| B | 5 | 185 | 104160 | 693.1 | 703 | 677 | 149.3 |
| B | 10 | 247 | 66972 | 444.02 | 703 | 677 | 149.3 |
| C | 15 | 224 | 869009 | 4604.52 | 692 | 683 | 188.6 |
| C | 12 | 254 | 465373 | 2464.14 | 692 | 683 | 188.6 |
| C | 14 | 96 | 201758 | 1066.25 | 692 | 683 | 188.6 |
| D | 8 | 240 | 222215 | 1143.69 | 693 | 662 | 193.7 |
| D | 8 | 160 | 140717 | 722.99 | 693 | 662 | 193.7 |
| D | 2 | 31 | 91299 | 467.88 | 693 | 662 | 193.7 |
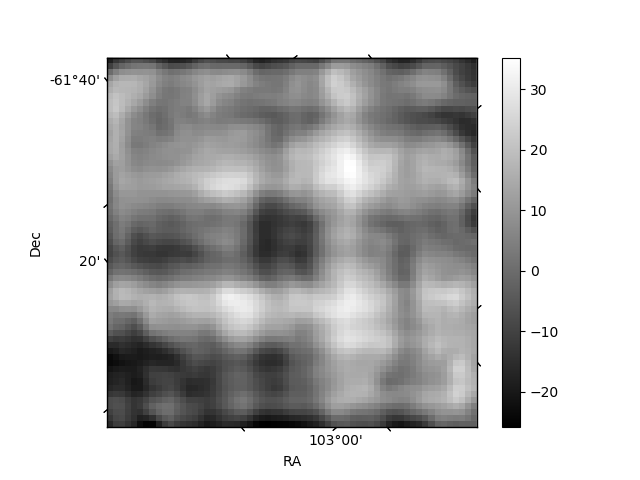
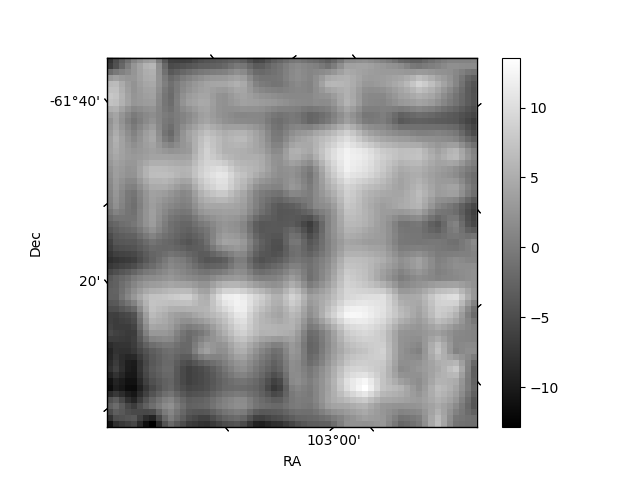
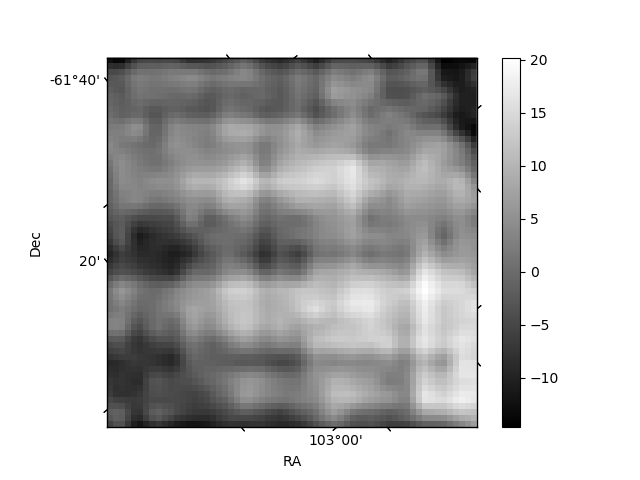
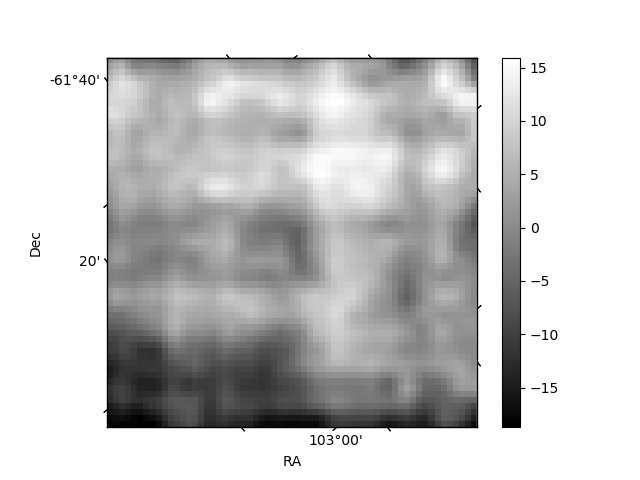
Histogram calculated using DETX and DETY for each event in the final _common_clean file
| Quadrant A | 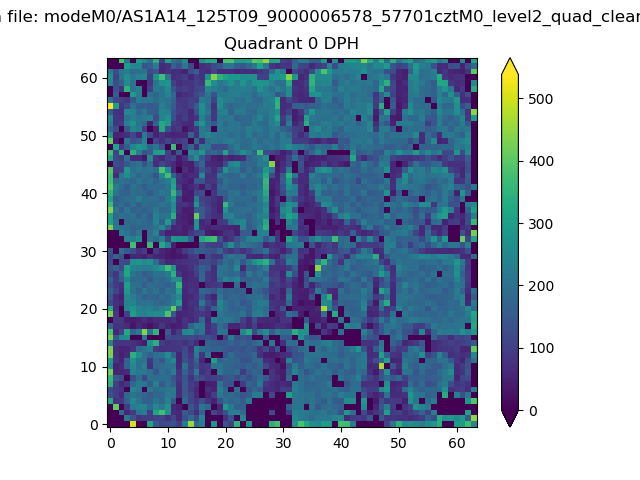 |
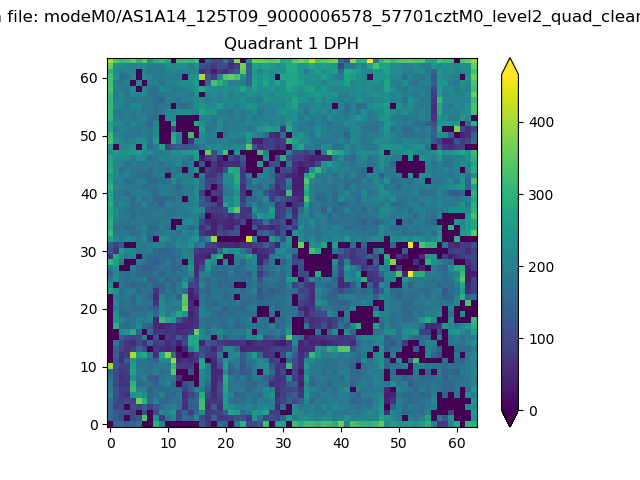 |
Quadrant B |
|---|---|---|---|
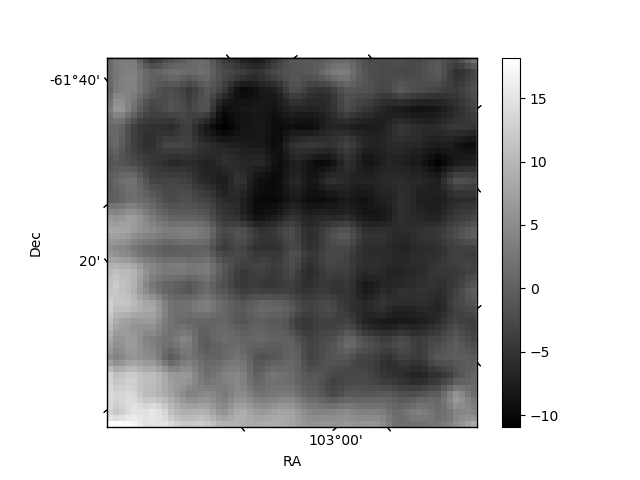
| Quadrant D | 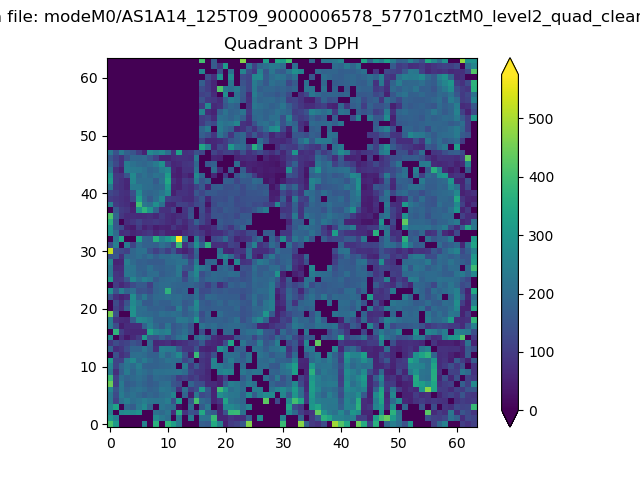 |
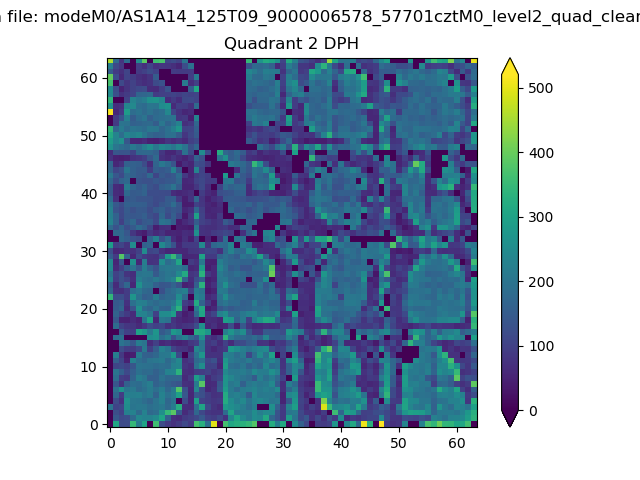 |
Quadrant C |
| Plot type | Count rate plots | Images |
|---|---|---|
| Comparison with Poisson distribution Blue bars denote a histogram of data divided into 1 sec bins. Red curve is a Poisson curve with rate = median count rate of data. |
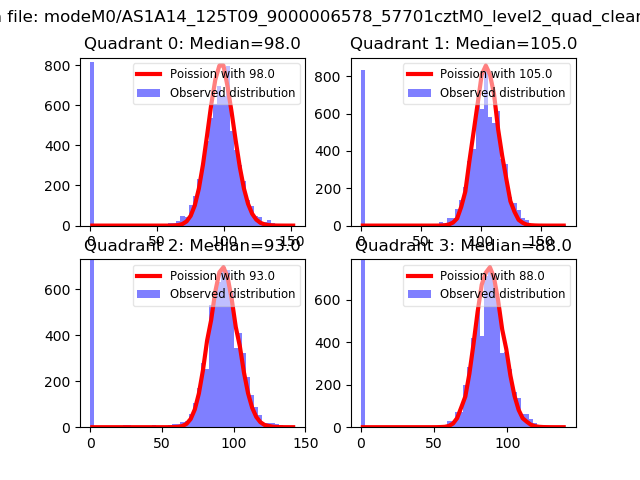 |
 |
| Quadrant-wise count rates Data is divided into 100 sec bins |
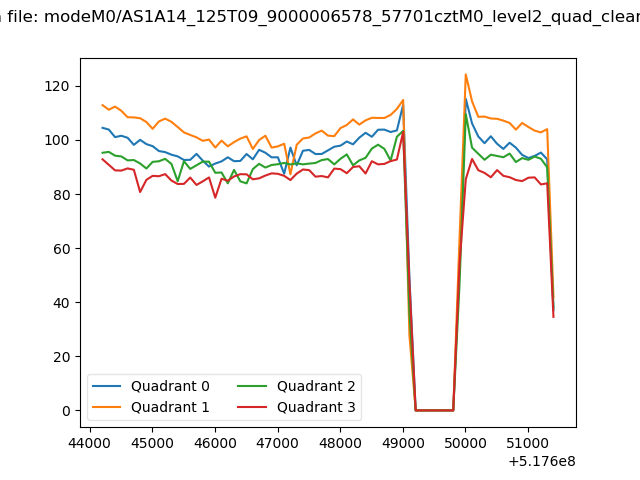 |
|
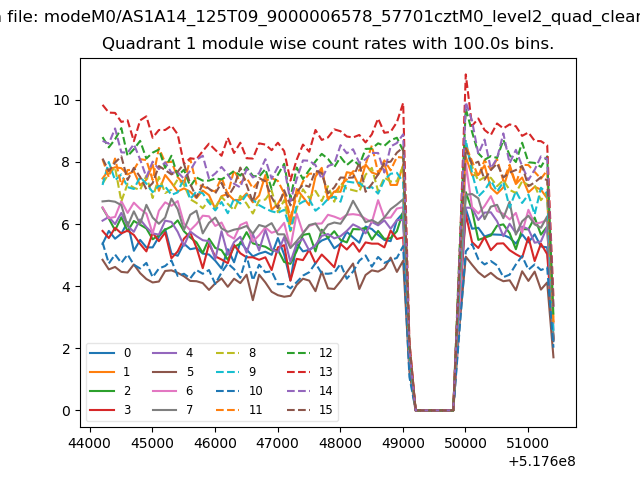
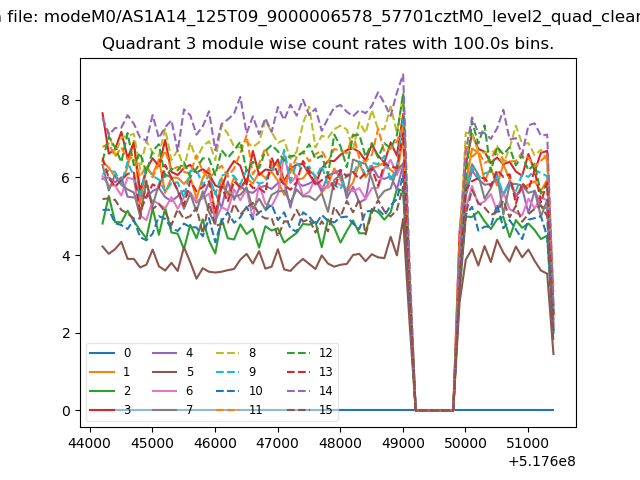
| Module-wise count rates for Quadrant A Data is divided into 100 sec bins |
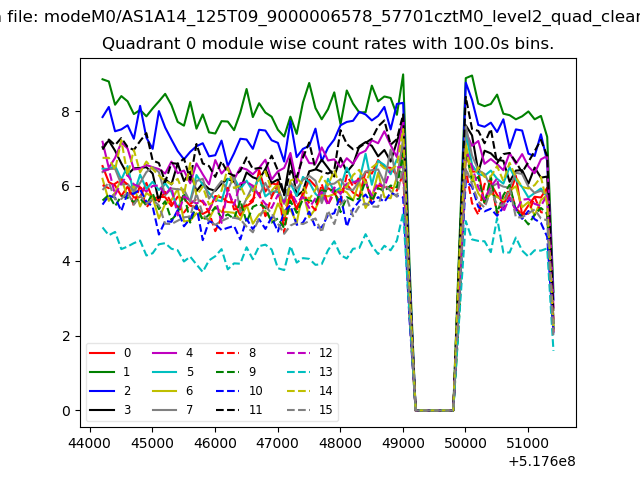 |
 |
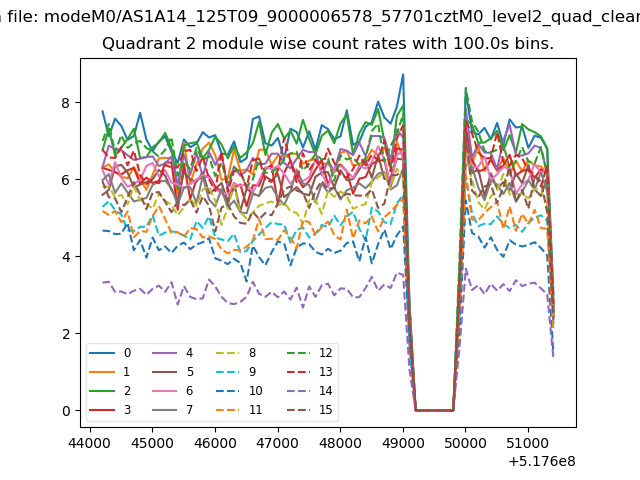
| Module-wise count rates for Quadrant B Data is divided into 100 sec bins |
 |
 |
| Module-wise count rates for Quadrant C Data is divided into 100 sec bins |
 |
 |
| Module-wise count rates for Quadrant D Data is divided into 100 sec bins |
 |
 |
| Parameter | Plot |
|---|---|
| CZT HV Monitor | 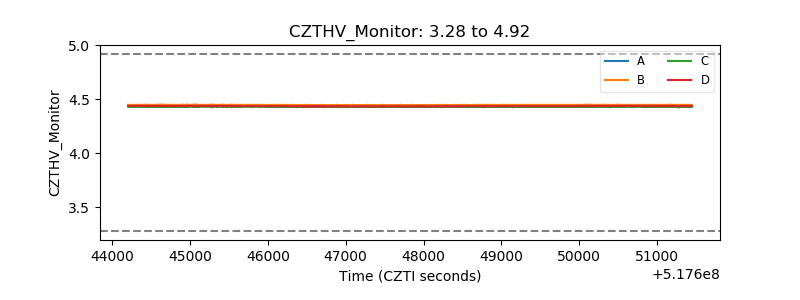 |
| D_VDD | 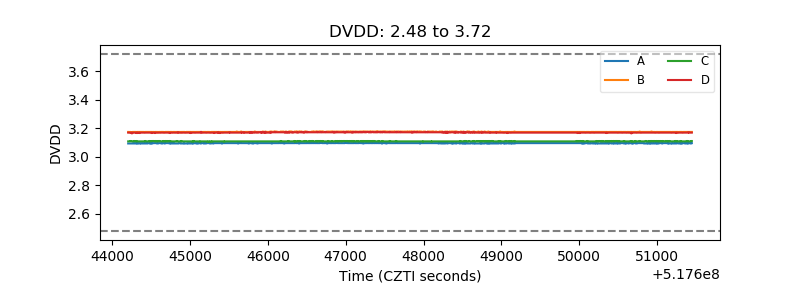 |
| Temperature 1 | 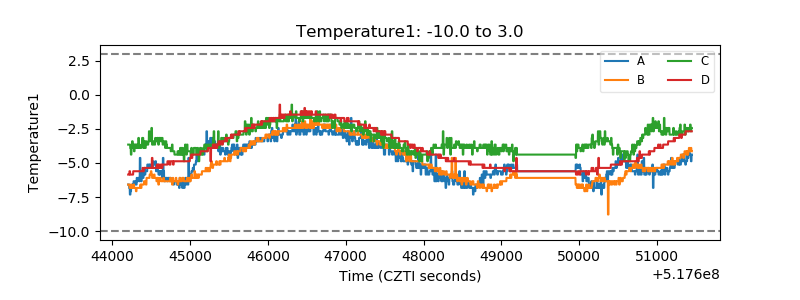 |
| Veto HV Monitor | 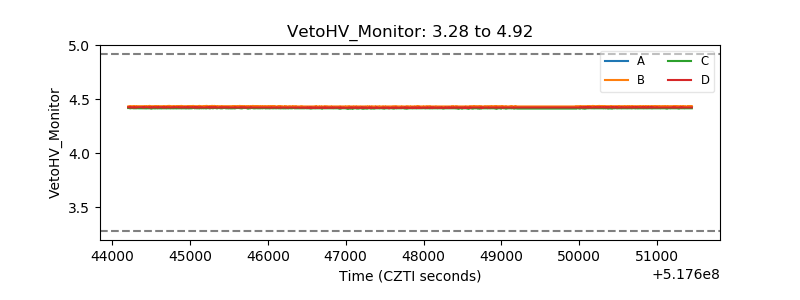 |
| Veto LLD | 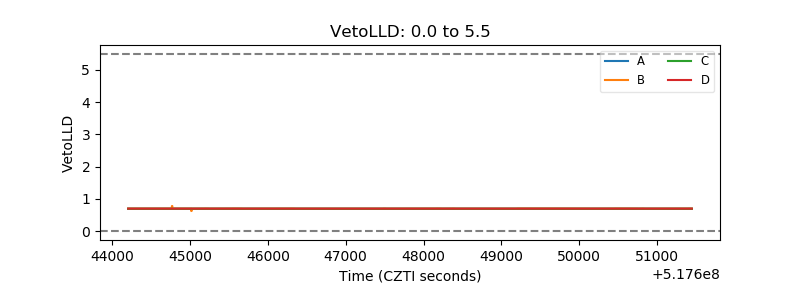 |
| Alpha Counter | 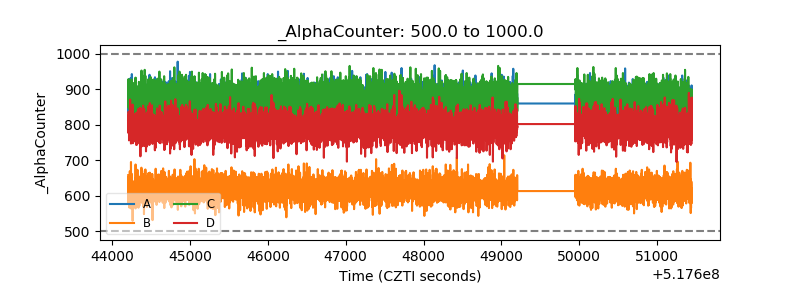 |
| _CPM_Rate | 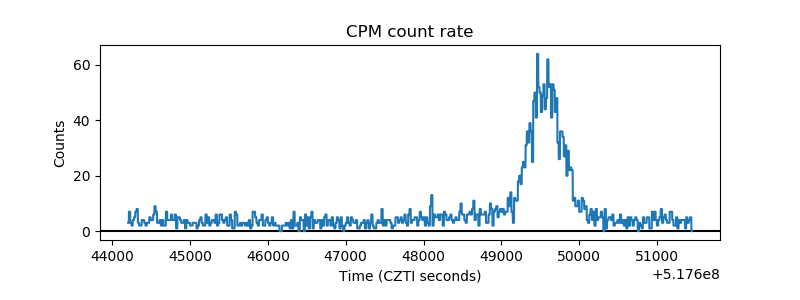 |
| CZT Counter | 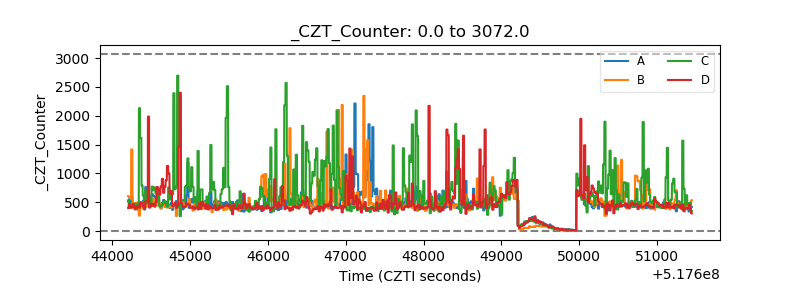 |
| +2.5 Volts monitor | 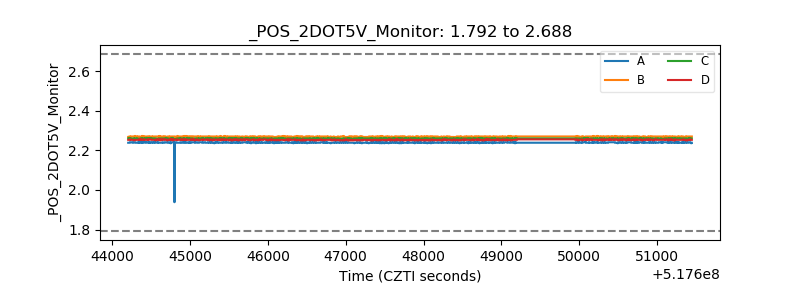 |
| +5 Volts monitor | 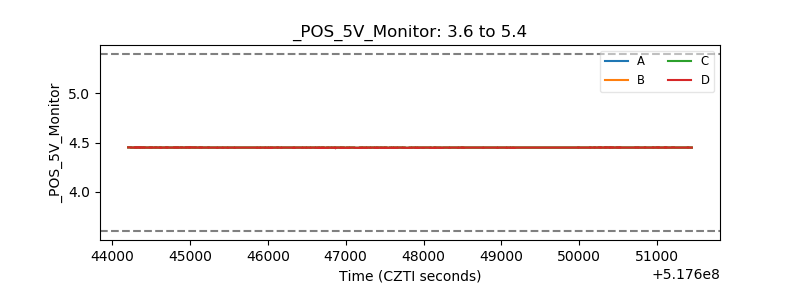 |
| _ROLL_ROT |  |
| _Roll_DEC | 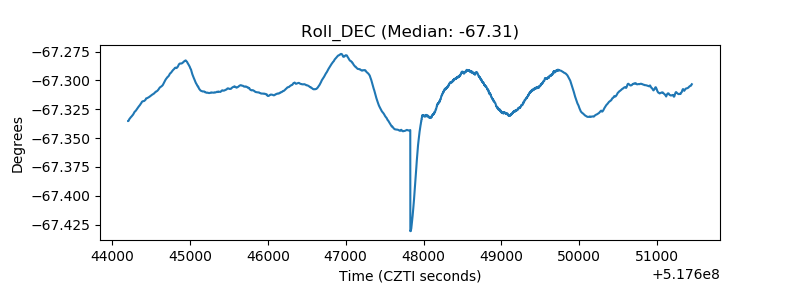 |
| _Roll_RA | 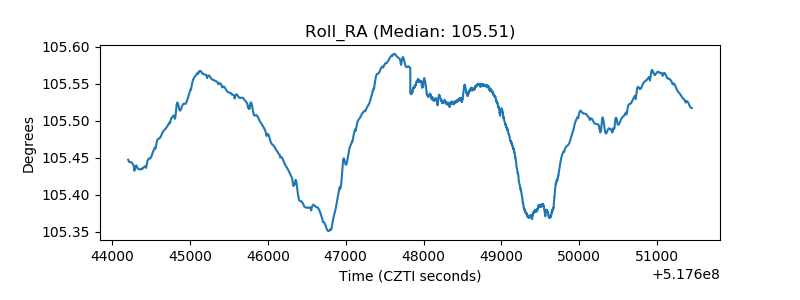 |
| Veto Counter | 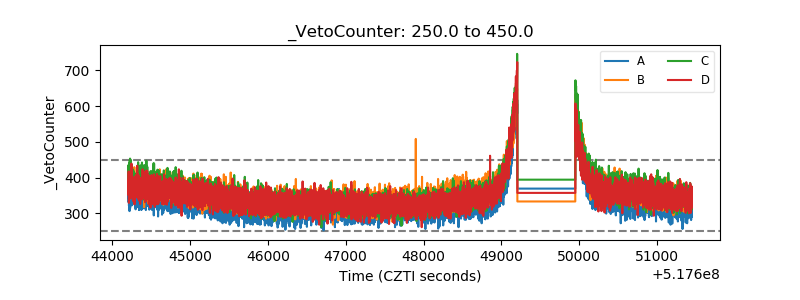 |