| Param | Original file | Final file |
|---|---|---|
| Filename | modeM0/AS1A14_125T09_9000006578_57702cztM0_level2.fits | modeM0/AS1A14_125T09_9000006578_57702cztM0_level2_quad_clean.evt |
| Size (bytes) | 603,624,960 | 97,476,480 |
| Size | 575.7 MB | 93.0 MB |
| Events in quadrant A | 3,346,257 | 687,601 |
| Events in quadrant B | 6,187,064 | 622,142 |
| Events in quadrant C | 7,053,954 | 557,401 |
| Events in quadrant D | 5,186,176 | 573,593 |
| Mode M9 | |||
|---|---|---|---|
| Quadrant | BADHDUFLAG | Total packets | Discarded packets |
| A | 0 | 1 | 0 |
| B | 0 | 1 | 0 |
| C | 0 | 1 | 0 |
| D | 0 | 1 | 0 |
| Mode SS | |||
|---|---|---|---|
| Quadrant | BADHDUFLAG | Total packets | Discarded packets |
| A | 0 | 148 | 0 |
| B | 0 | 148 | 0 |
| C | 0 | 148 | 0 |
| D | 0 | 148 | 0 |
| Mode M0 | |||
|---|---|---|---|
| Quadrant | BADHDUFLAG | Total packets | Discarded packets |
| A | 0 | 15325 | 1 |
| B | 0 | 23455 | 1 |
| C | 0 | 26214 | 1 |
| D | 0 | 20597 | 1 |
| Quadrant | Total seconds | Saturated seconds | Saturation percentage |
|---|---|---|---|
| A | 7337 | 302 | 4.116124% |
| B | 7338 | 1444 | 19.678386% |
| C | 7338 | 1428 | 19.460343% |
| D | 7338 | 849 | 11.569910% |
Noise dominated data is calculated using 1-second bins in cleaned event files. If a bin has >2000 counts, and if more than 50% of those come from <1% of pixels, then it is considered to be noise-dominated and hence unusable.
| Quadrant | # 1 sec bins | Bins with >0 counts | Bins with >2000 counts | High rate bins dominated by noise | Noise dominated (total time) | Noise dominated (detector-on time) | Marked lightcurve |
|---|---|---|---|---|---|---|---|
| A | 7352 | 7338 | 2 | 2 | 0.03% | 0.03% | 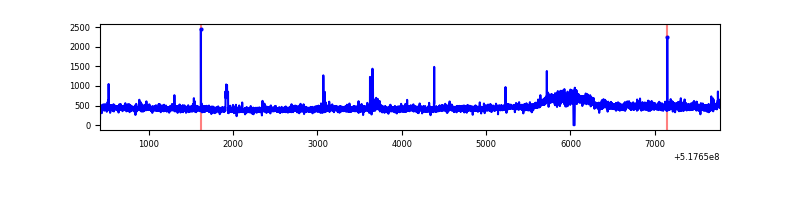 |
| B | 7353 | 7339 | 836 | 836 | 11.37% | 11.39% | 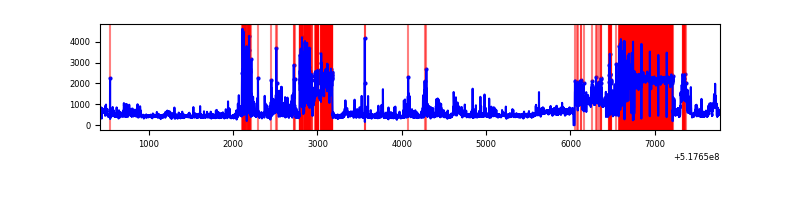 |
| C | 7353 | 7338 | 887 | 887 | 12.06% | 12.09% | 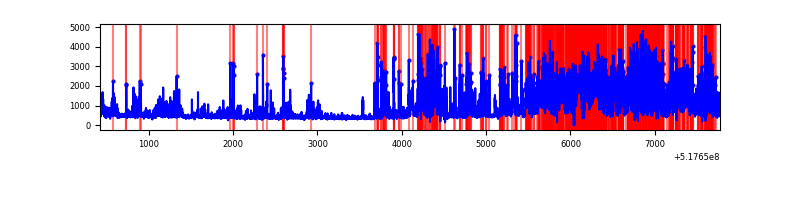 |
| D | 7353 | 7339 | 470 | 470 | 6.39% | 6.40% | 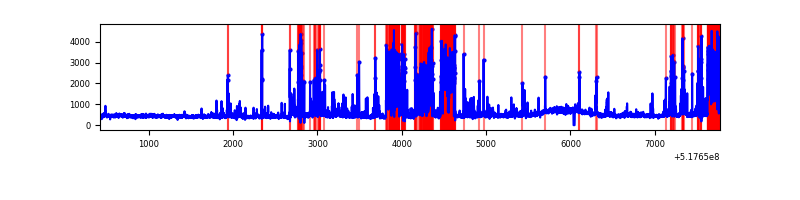 |
Top three noisy pixels from each quadrant. If the there are fewer than three noisy pixels in the level2.evt file, extra rows are filled as -1
| Pixel properties | Quadrant properties | ||||||
|---|---|---|---|---|---|---|---|
| Quadrant | DetID | PixID | Counts | Sigma | Mean | Median | Sigma |
| A | 3 | 128 | 119326 | 590.53 | 819 | 796 | 200.7 |
| A | 7 | 160 | 22156 | 106.42 | 819 | 796 | 200.7 |
| A | 4 | 3 | 15219 | 71.86 | 819 | 796 | 200.7 |
| B | 4 | 80 | 2411725 | 15554.94 | 729 | 702 | 155.0 |
| B | 5 | 185 | 328800 | 2116.75 | 729 | 702 | 155.0 |
| B | 0 | 171 | 150041 | 963.47 | 729 | 702 | 155.0 |
| C | 15 | 224 | 2056970 | 10632.99 | 710 | 702 | 193.4 |
| C | 12 | 254 | 1373396 | 7098.22 | 710 | 702 | 193.4 |
| C | 12 | 2 | 434070 | 2240.95 | 710 | 702 | 193.4 |
| D | 8 | 240 | 1171843 | 5406.14 | 770 | 735 | 216.6 |
| D | 2 | 249 | 335951 | 1547.44 | 770 | 735 | 216.6 |
| D | 3 | 12 | 130311 | 598.16 | 770 | 735 | 216.6 |
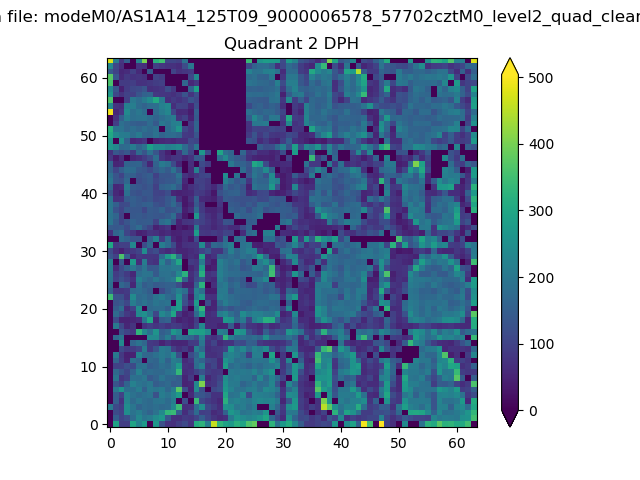
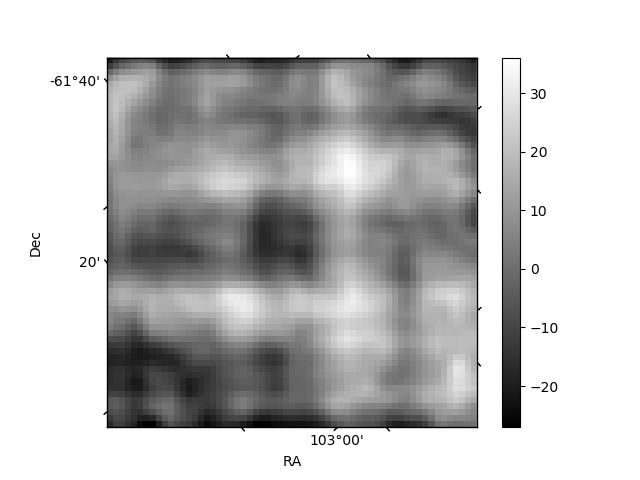
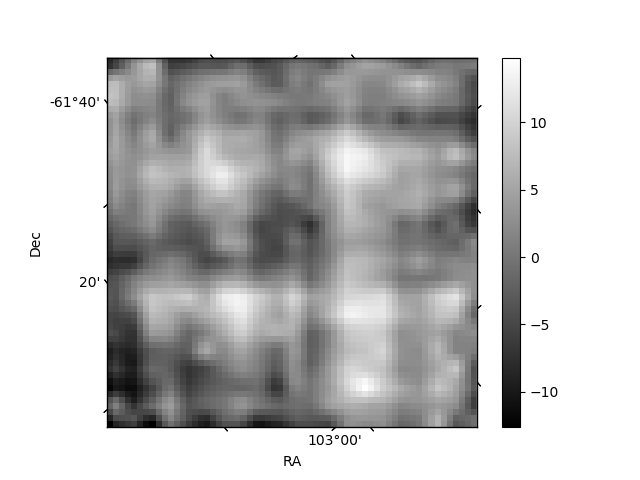
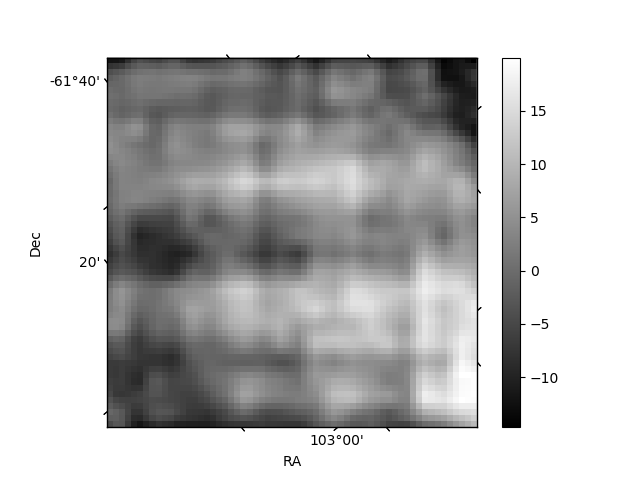
Histogram calculated using DETX and DETY for each event in the final _common_clean file
| Quadrant A | 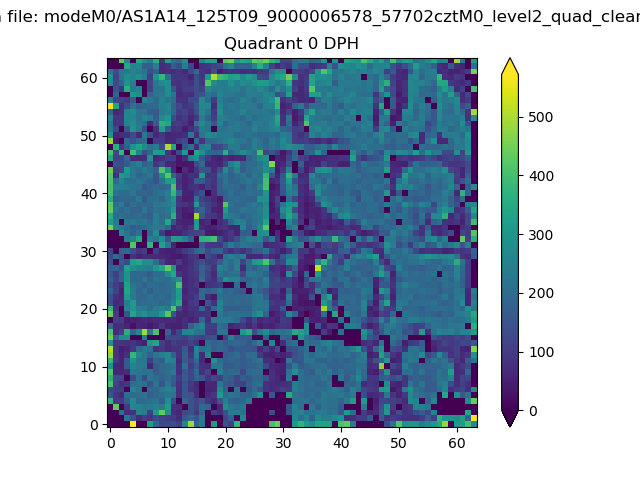 |
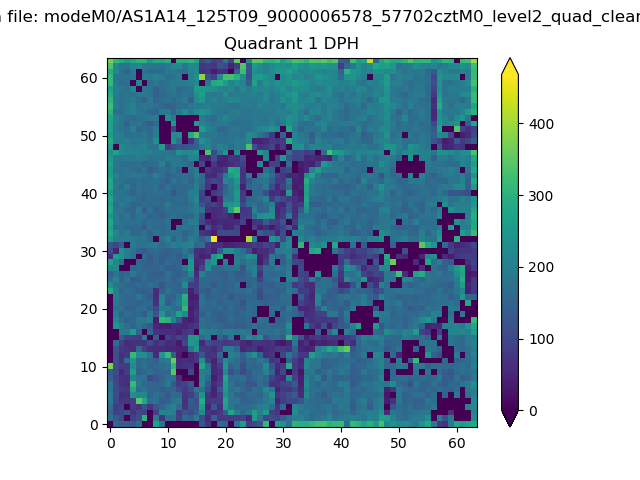 |
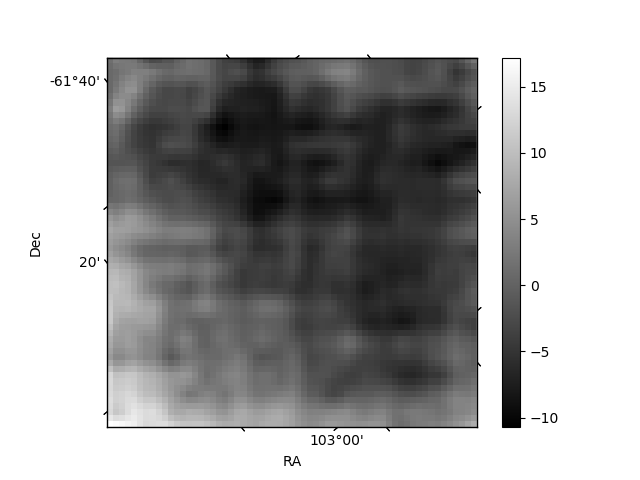
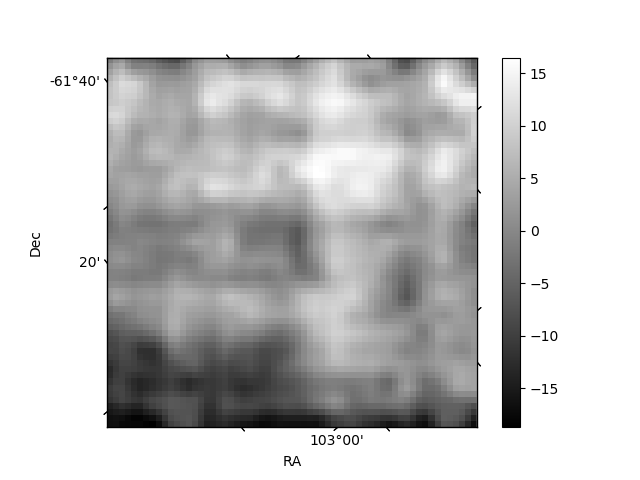
Quadrant B |
|---|---|---|---|
| Quadrant D | 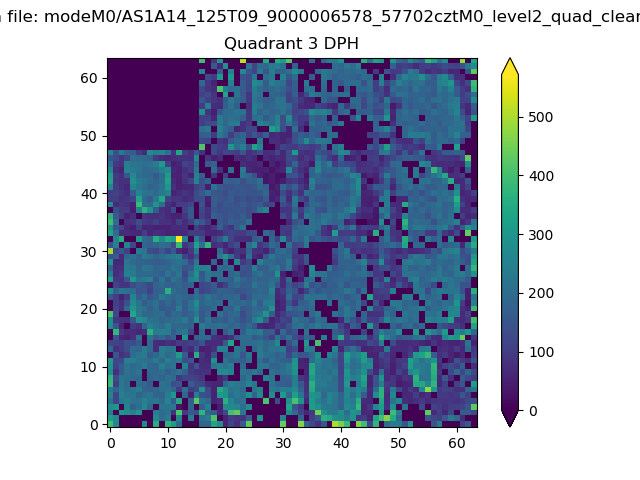 |
 |
Quadrant C |
| Plot type | Count rate plots | Images |
|---|---|---|
| Comparison with Poisson distribution Blue bars denote a histogram of data divided into 1 sec bins. Red curve is a Poisson curve with rate = median count rate of data. |
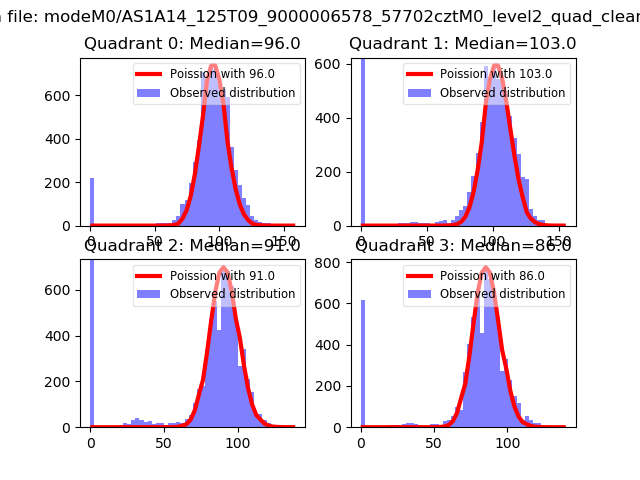 |
 |
| Quadrant-wise count rates Data is divided into 100 sec bins |
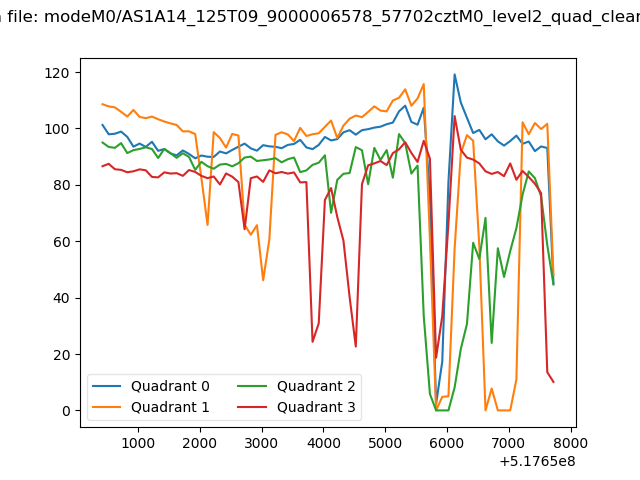 |
|
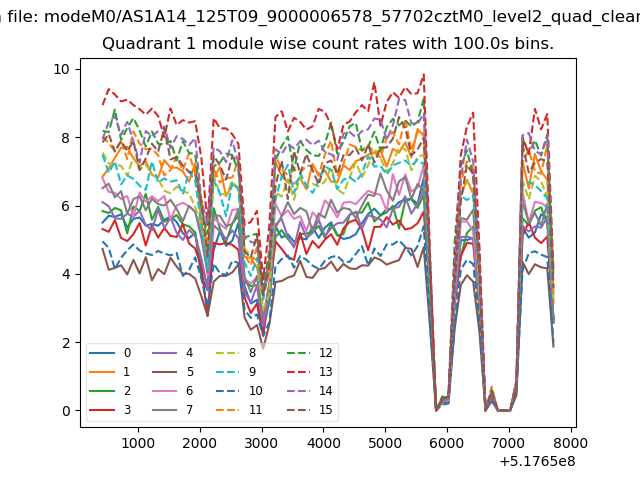
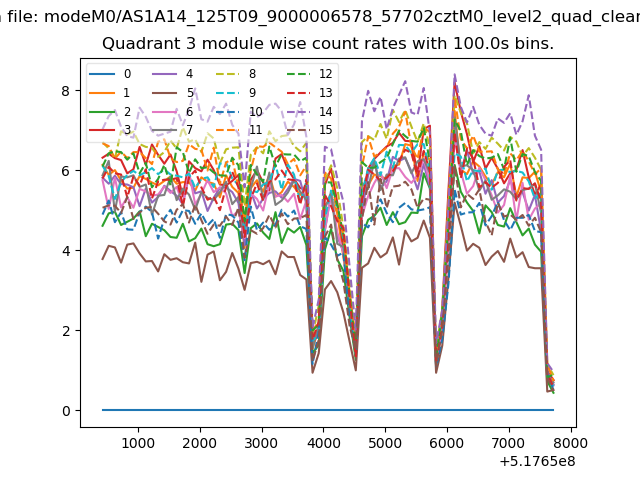
| Module-wise count rates for Quadrant A Data is divided into 100 sec bins |
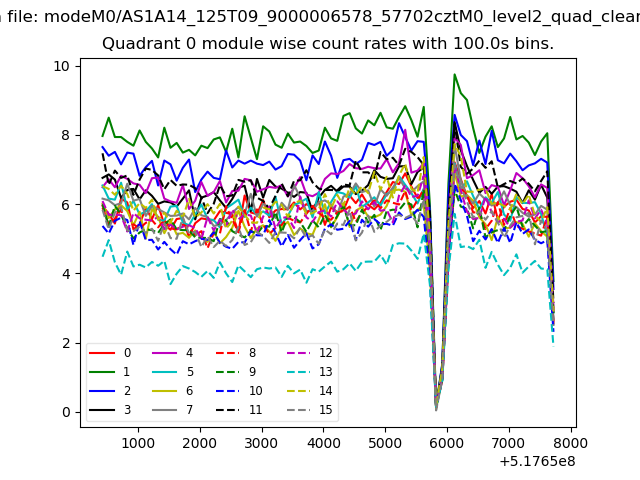 |
 |
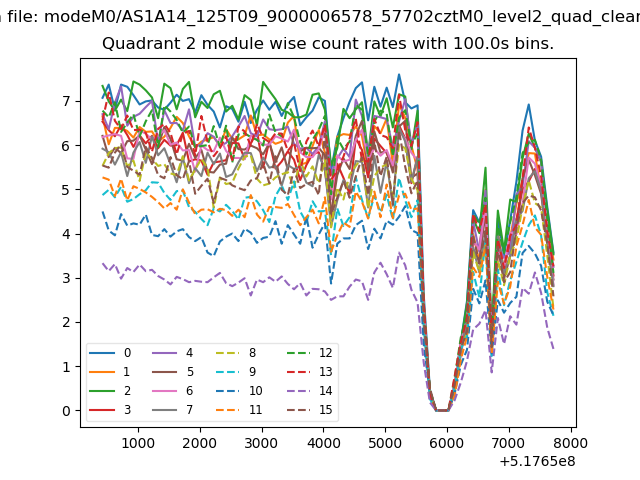
| Module-wise count rates for Quadrant B Data is divided into 100 sec bins |
 |
 |
| Module-wise count rates for Quadrant C Data is divided into 100 sec bins |
 |
 |
| Module-wise count rates for Quadrant D Data is divided into 100 sec bins |
 |
 |
| Parameter | Plot |
|---|---|
| CZT HV Monitor | 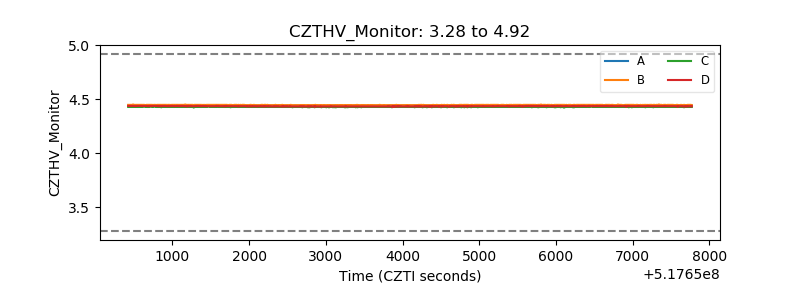 |
| D_VDD | 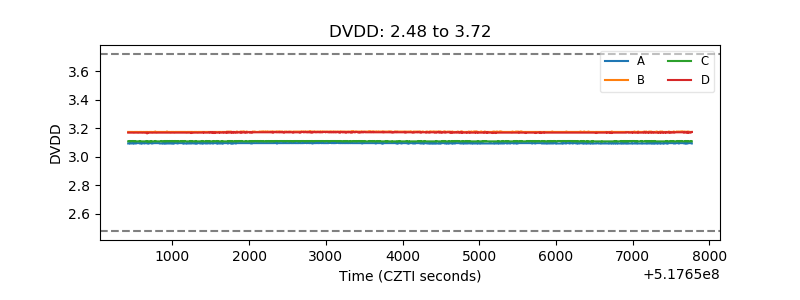 |
| Temperature 1 | 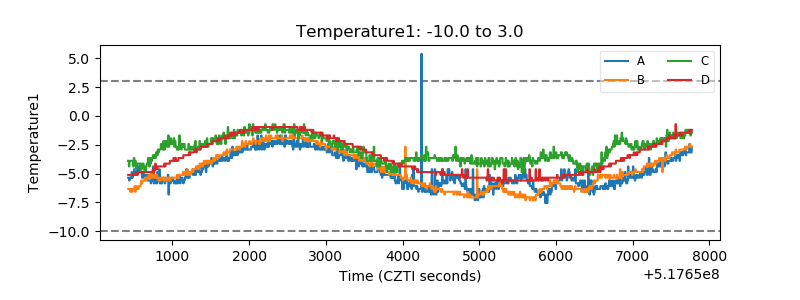 |
| Veto HV Monitor | 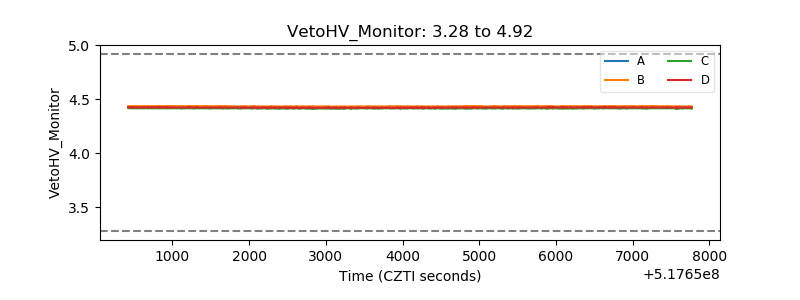 |
| Veto LLD | 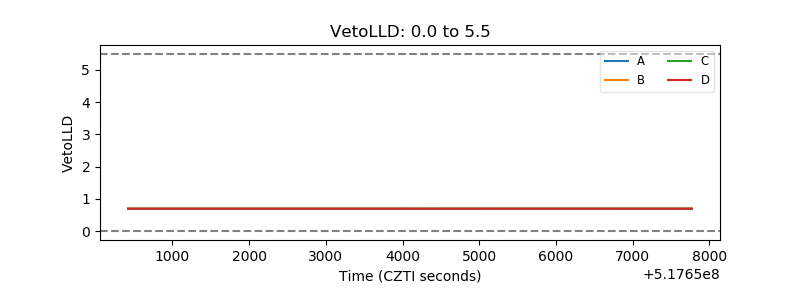 |
| Alpha Counter | 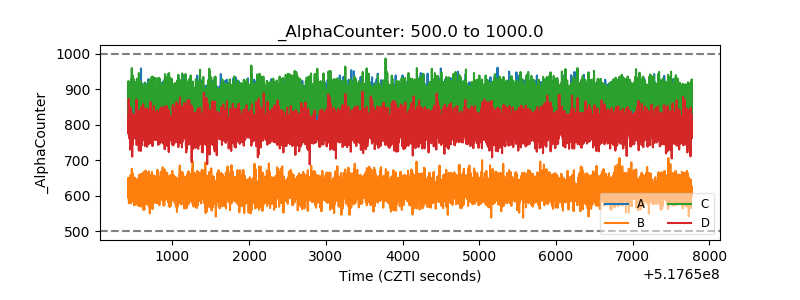 |
| _CPM_Rate | 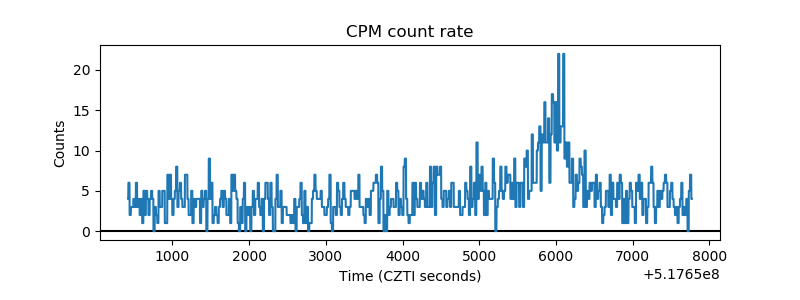 |
| CZT Counter | 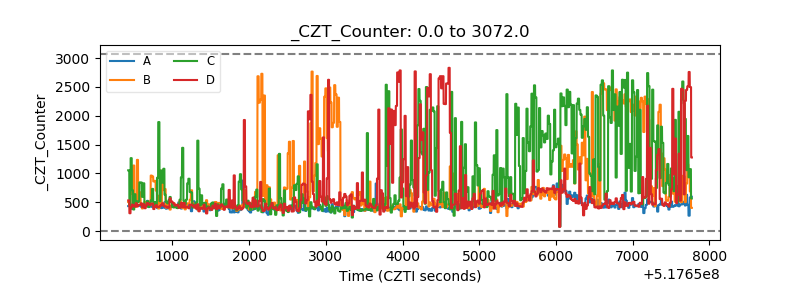 |
| +2.5 Volts monitor |  |
| +5 Volts monitor |  |
| _ROLL_ROT | 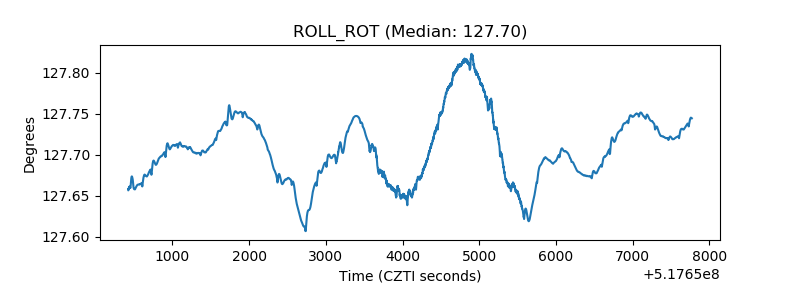 |
| _Roll_DEC | 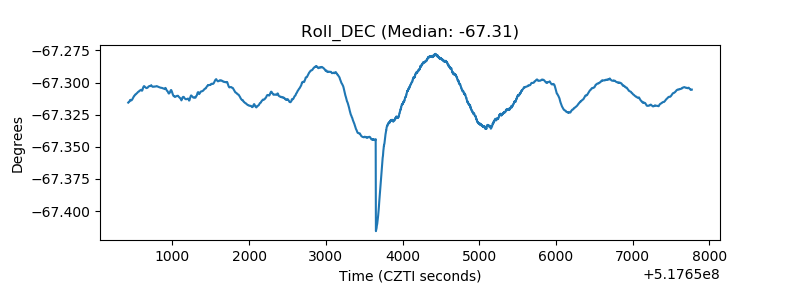 |
| _Roll_RA | 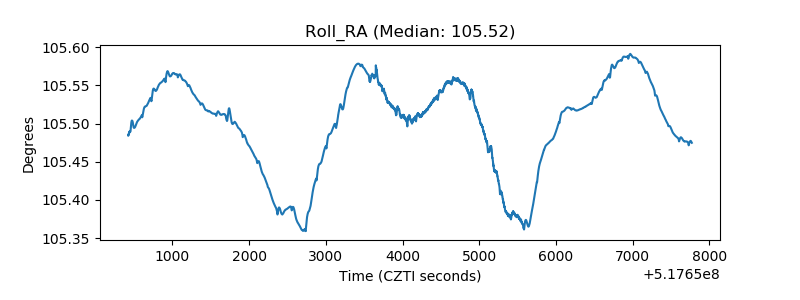 |
| Veto Counter | 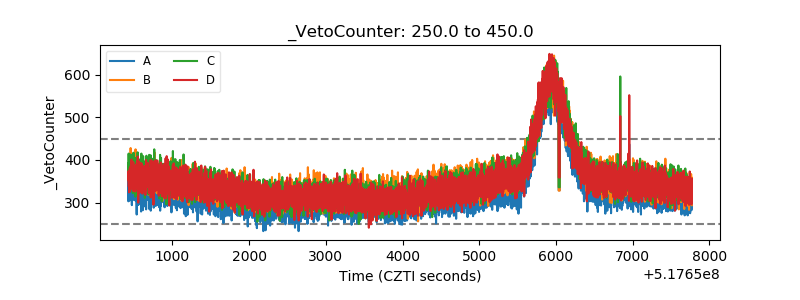 |