| Param | Original file | Final file |
|---|---|---|
| Filename | modeM0/AS1A14_125T09_9000006578_57703cztM0_level2.fits | modeM0/AS1A14_125T09_9000006578_57703cztM0_level2_quad_clean.evt |
| Size (bytes) | 648,460,800 | 99,054,720 |
| Size | 618.4 MB | 94.5 MB |
| Events in quadrant A | 3,270,191 | 692,330 |
| Events in quadrant B | 5,254,780 | 711,417 |
| Events in quadrant C | 8,562,783 | 546,820 |
| Events in quadrant D | 6,357,815 | 547,253 |
| Mode SS | |||
|---|---|---|---|
| Quadrant | BADHDUFLAG | Total packets | Discarded packets |
| A | 0 | 144 | 0 |
| B | 0 | 144 | 0 |
| C | 0 | 144 | 0 |
| D | 0 | 144 | 0 |
| Mode M0 | |||
|---|---|---|---|
| Quadrant | BADHDUFLAG | Total packets | Discarded packets |
| A | 0 | 14651 | 0 |
| B | 0 | 20401 | 1 |
| C | 0 | 30383 | 0 |
| D | 0 | 23798 | 0 |
| Quadrant | Total seconds | Saturated seconds | Saturation percentage |
|---|---|---|---|
| A | 7200 | 6 | 0.083333% |
| B | 7199 | 346 | 4.806223% |
| C | 7199 | 1584 | 22.003056% |
| D | 7200 | 929 | 12.902778% |
Noise dominated data is calculated using 1-second bins in cleaned event files. If a bin has >2000 counts, and if more than 50% of those come from <1% of pixels, then it is considered to be noise-dominated and hence unusable.
| Quadrant | # 1 sec bins | Bins with >0 counts | Bins with >2000 counts | High rate bins dominated by noise | Noise dominated (total time) | Noise dominated (detector-on time) | Marked lightcurve |
|---|---|---|---|---|---|---|---|
| A | 7200 | 7200 | 2 | 2 | 0.03% | 0.03% | 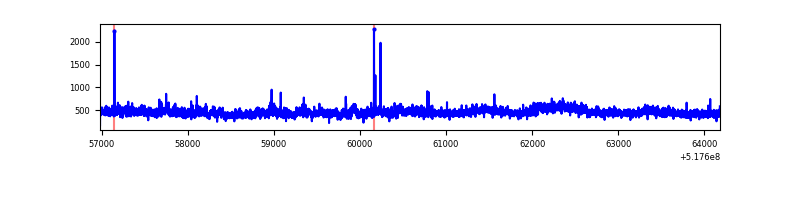 |
| B | 7199 | 7199 | 282 | 282 | 3.92% | 3.92% | 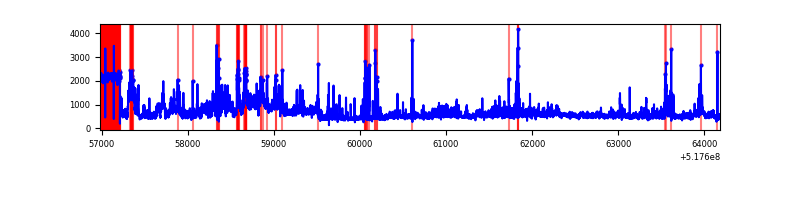 |
| C | 7199 | 7199 | 1213 | 1213 | 16.85% | 16.85% | 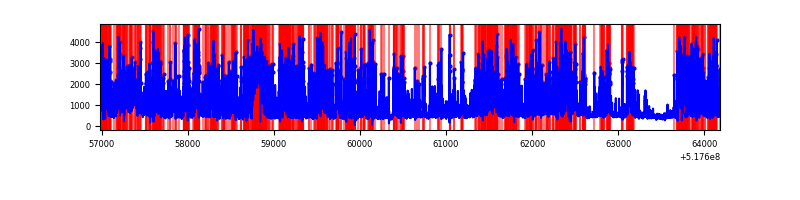 |
| D | 7200 | 7200 | 702 | 702 | 9.75% | 9.75% | 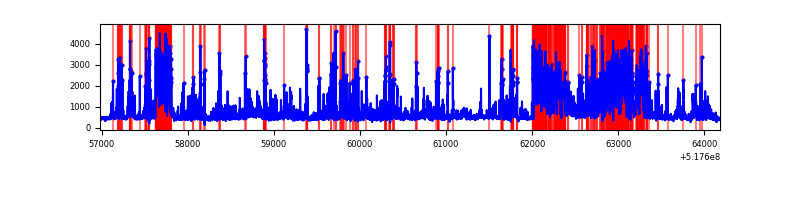 |
Top three noisy pixels from each quadrant. If the there are fewer than three noisy pixels in the level2.evt file, extra rows are filled as -1
| Pixel properties | Quadrant properties | ||||||
|---|---|---|---|---|---|---|---|
| Quadrant | DetID | PixID | Counts | Sigma | Mean | Median | Sigma |
| A | 3 | 128 | 210771 | 1096.79 | 777 | 755 | 191.5 |
| A | 4 | 3 | 18526 | 92.81 | 777 | 755 | 191.5 |
| A | 3 | 245 | 14383 | 71.17 | 777 | 755 | 191.5 |
| B | 4 | 80 | 1562697 | 9805.04 | 742 | 714 | 159.3 |
| B | 0 | 171 | 142430 | 889.59 | 742 | 714 | 159.3 |
| B | 0 | 155 | 137208 | 856.81 | 742 | 714 | 159.3 |
| C | 15 | 224 | 4685527 | 25120.69 | 685 | 680 | 186.5 |
| C | 12 | 254 | 532318 | 2850.7 | 685 | 680 | 186.5 |
| C | 14 | 96 | 237628 | 1270.54 | 685 | 680 | 186.5 |
| D | 2 | 249 | 1994558 | 9950.91 | 706 | 672 | 200.4 |
| D | 8 | 240 | 665811 | 3319.52 | 706 | 672 | 200.4 |
| D | 10 | 181 | 249030 | 1239.48 | 706 | 672 | 200.4 |
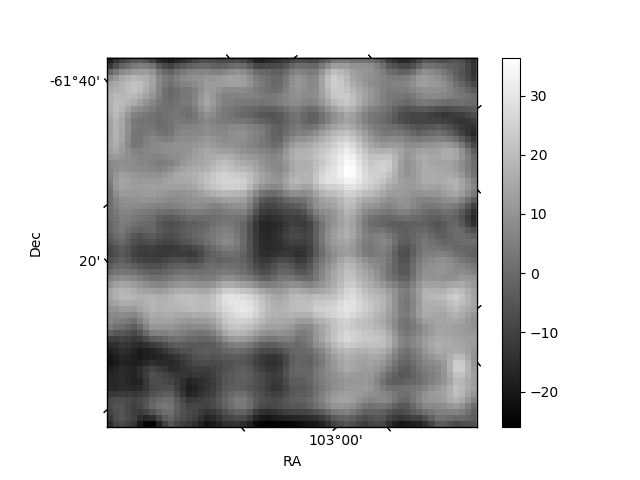
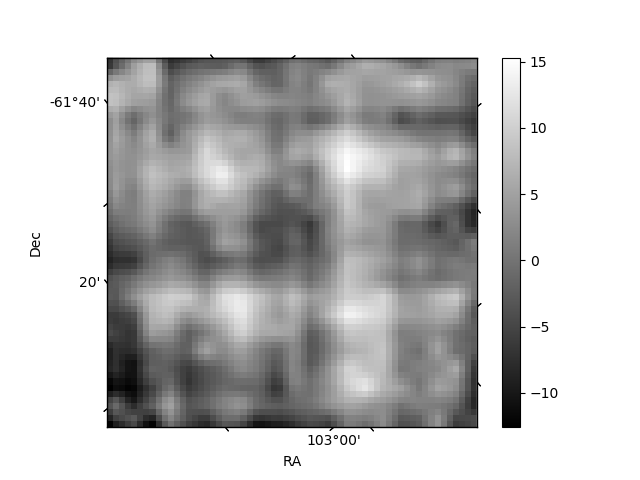
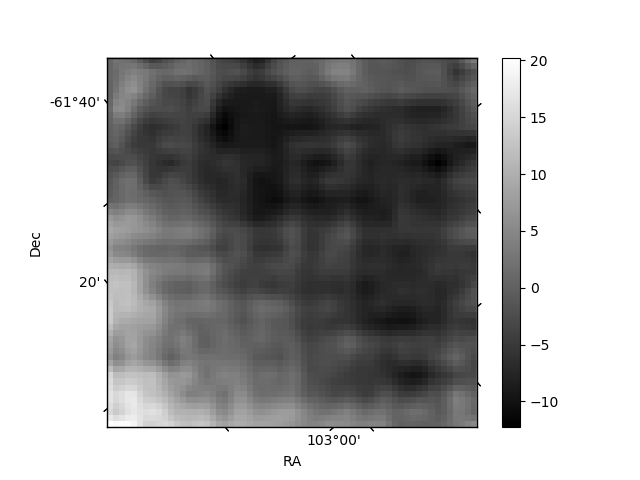
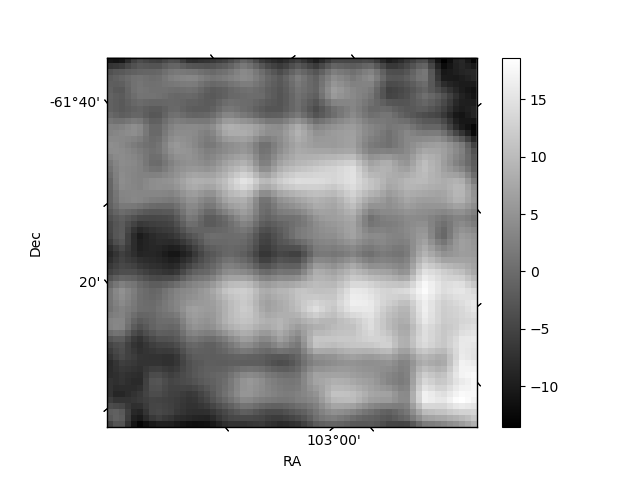
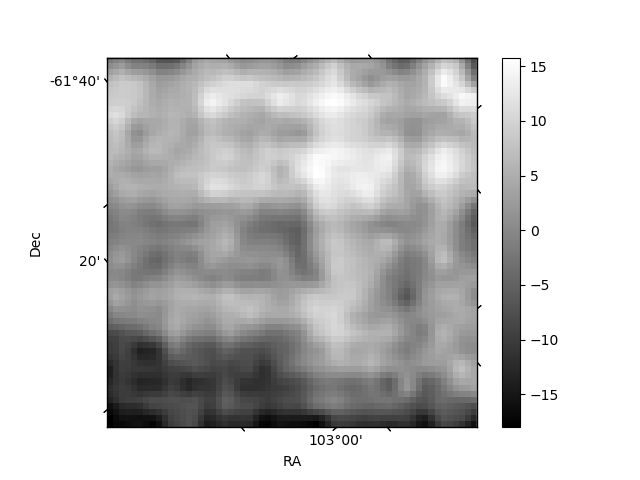
Histogram calculated using DETX and DETY for each event in the final _common_clean file
| Quadrant A | 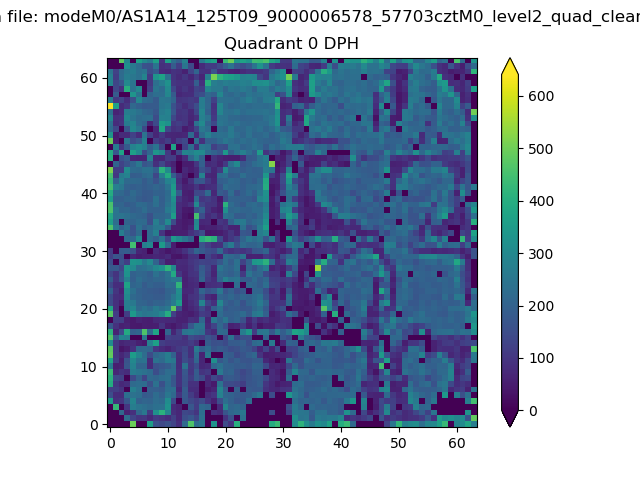 |
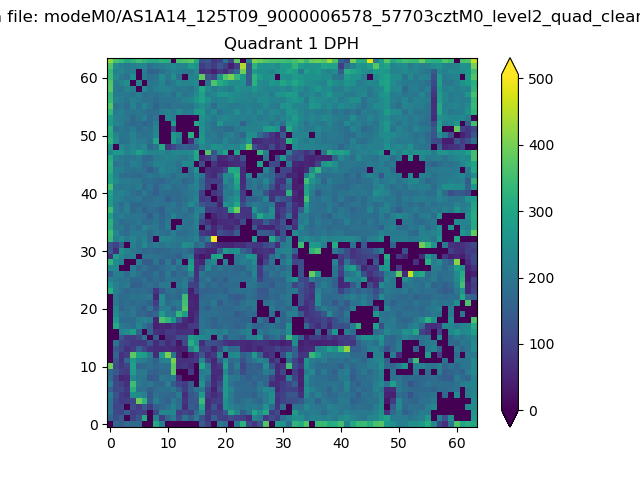 |
Quadrant B |
|---|---|---|---|
| Quadrant D | 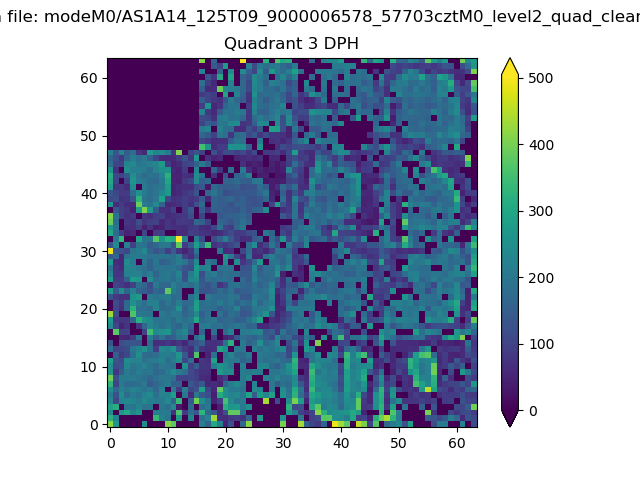 |
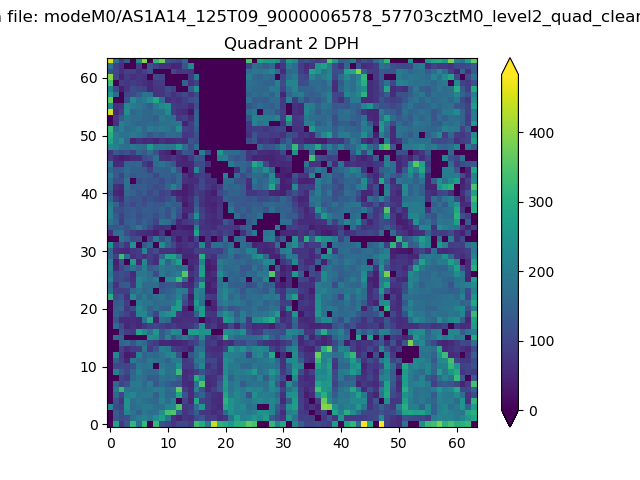 |
Quadrant C |
| Plot type | Count rate plots | Images |
|---|---|---|
| Comparison with Poisson distribution Blue bars denote a histogram of data divided into 1 sec bins. Red curve is a Poisson curve with rate = median count rate of data. |
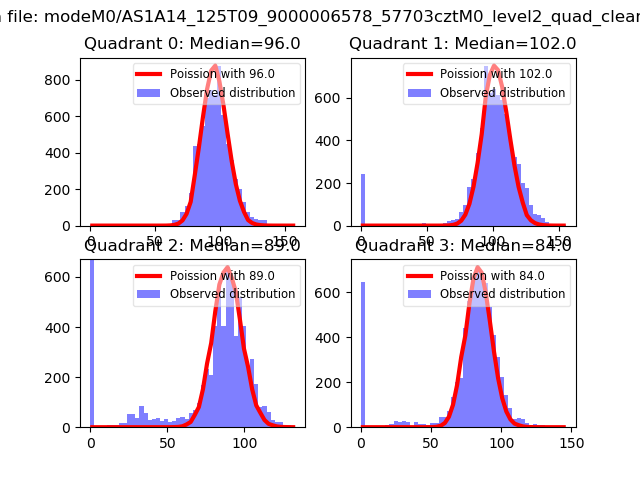 |
 |
| Quadrant-wise count rates Data is divided into 100 sec bins |
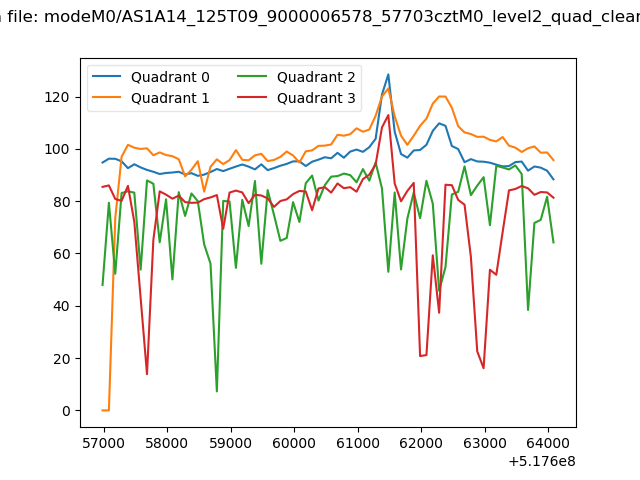 |
|
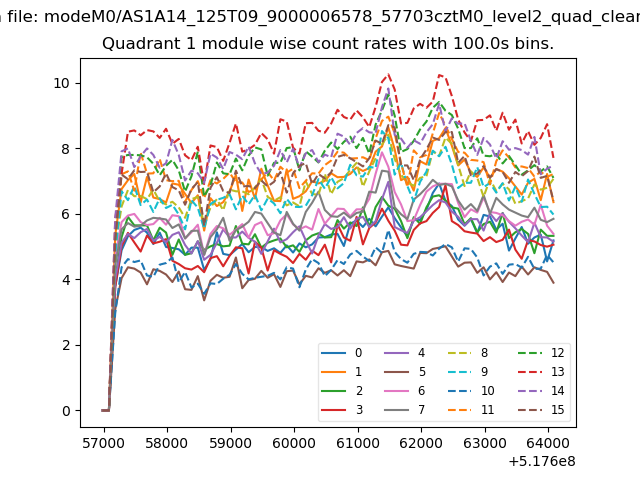
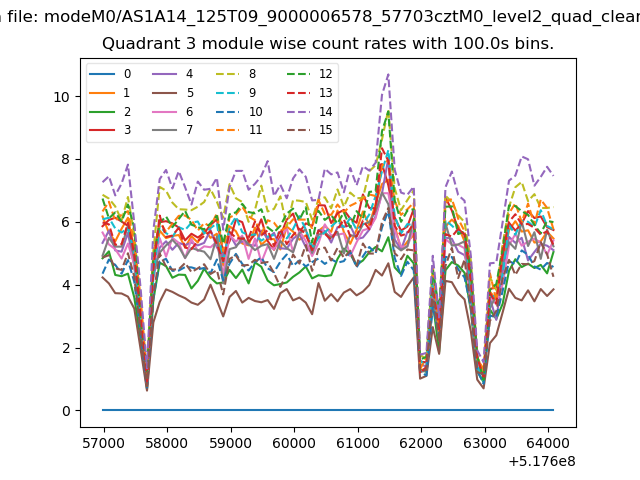
| Module-wise count rates for Quadrant A Data is divided into 100 sec bins |
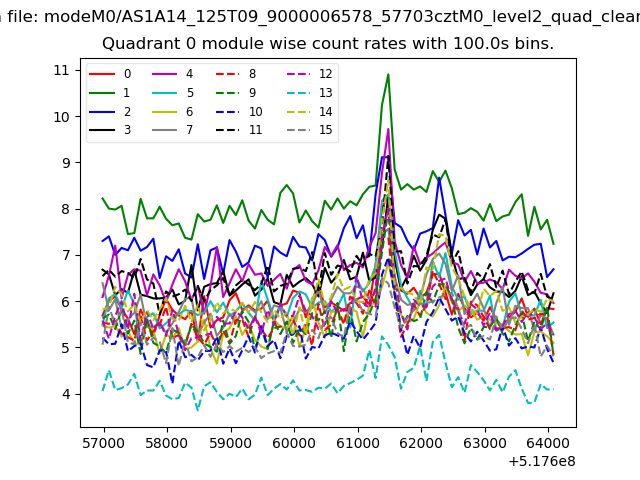 |
 |
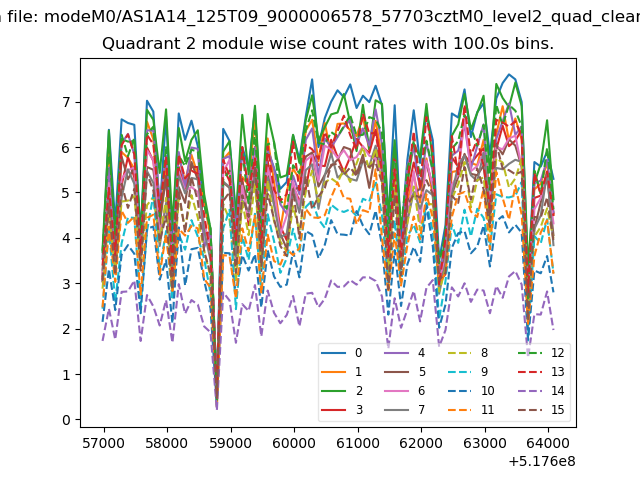
| Module-wise count rates for Quadrant B Data is divided into 100 sec bins |
 |
 |
| Module-wise count rates for Quadrant C Data is divided into 100 sec bins |
 |
 |
| Module-wise count rates for Quadrant D Data is divided into 100 sec bins |
 |
 |
| Parameter | Plot |
|---|---|
| CZT HV Monitor | 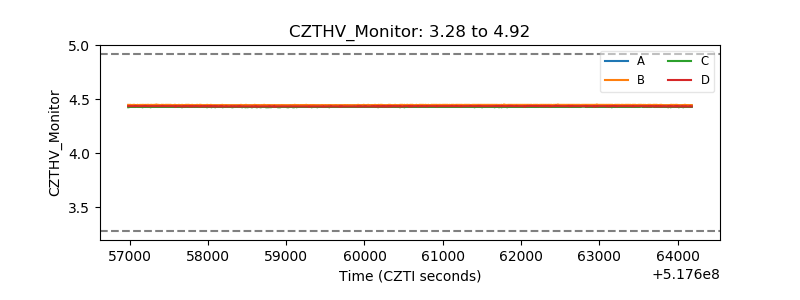 |
| D_VDD | 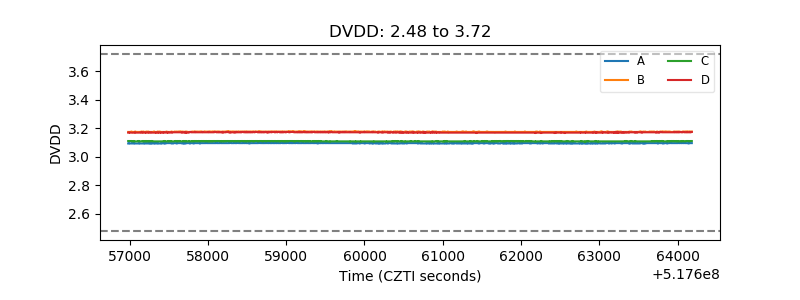 |
| Temperature 1 | 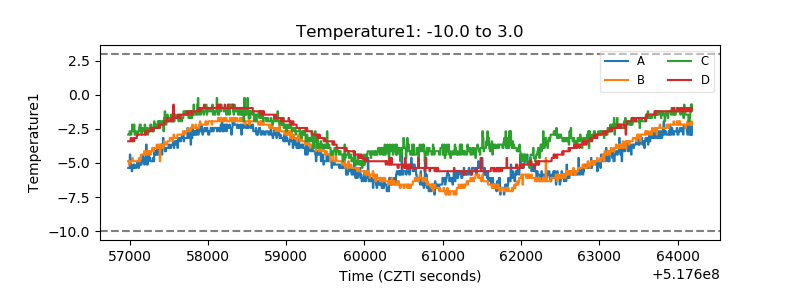 |
| Veto HV Monitor | 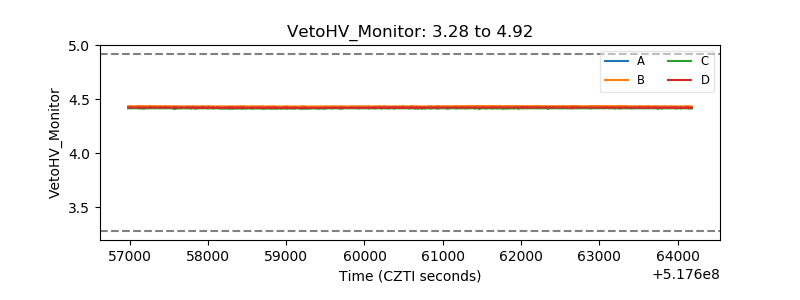 |
| Veto LLD | 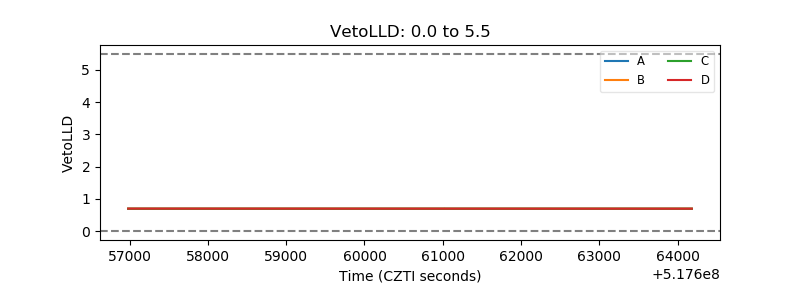 |
| Alpha Counter | 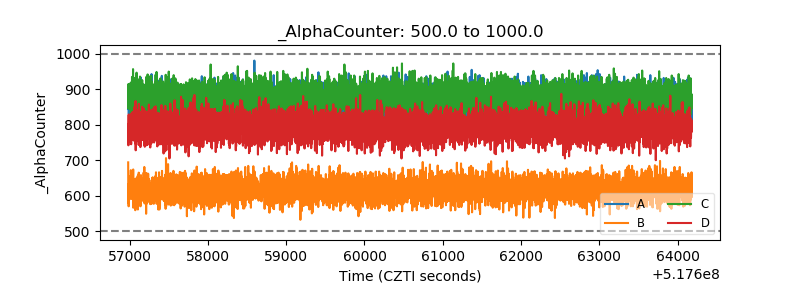 |
| _CPM_Rate | 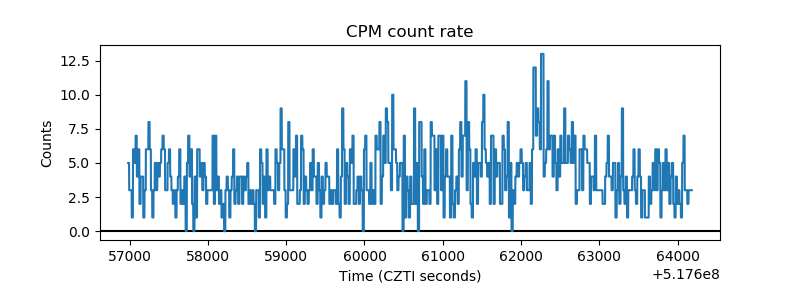 |
| CZT Counter | 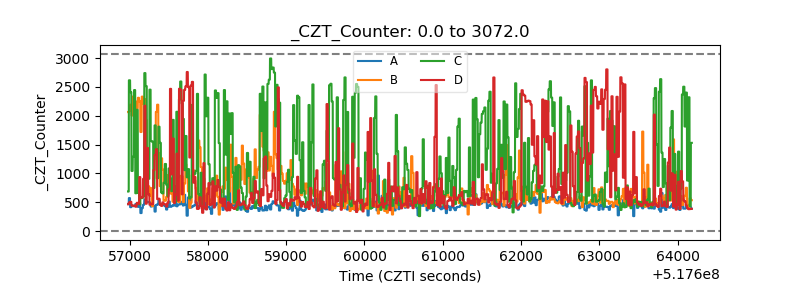 |
| +2.5 Volts monitor | 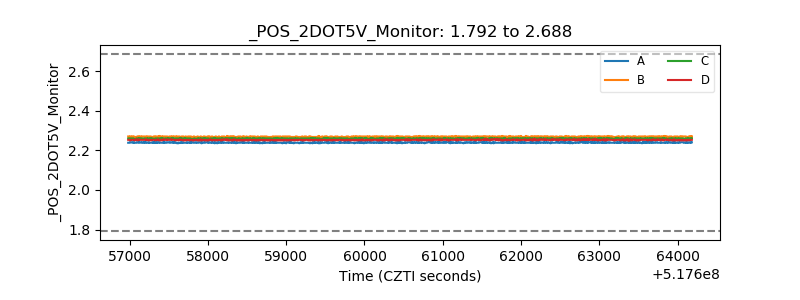 |
| +5 Volts monitor |  |
| _ROLL_ROT | 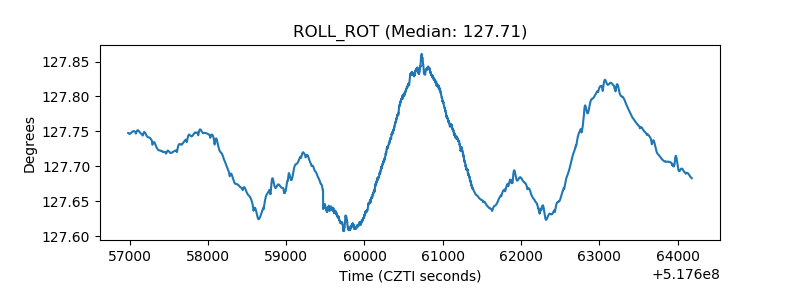 |
| _Roll_DEC | 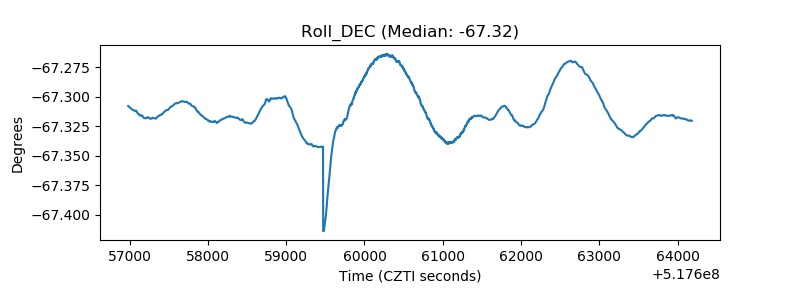 |
| _Roll_RA | 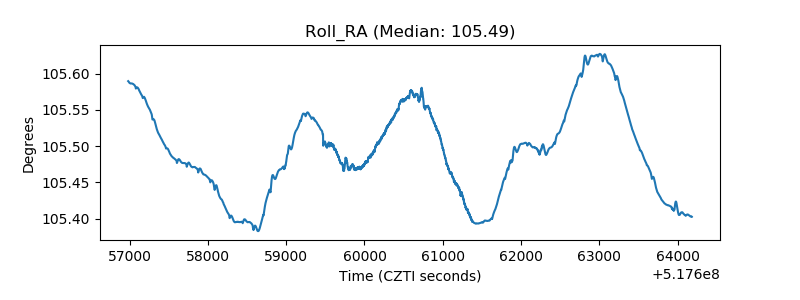 |
| Veto Counter | 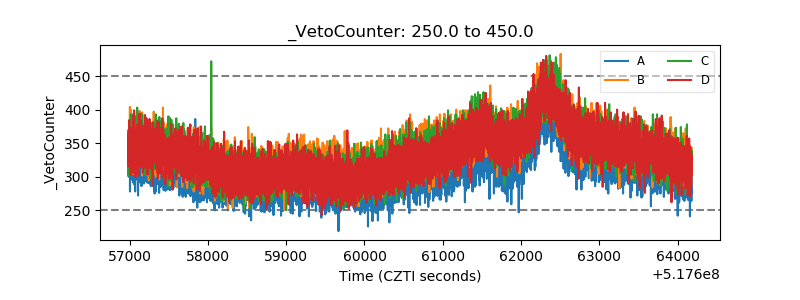 |