| Param | Original file | Final file |
|---|---|---|
| Filename | modeM0/AS1A14_125T09_9000006578_57704cztM0_level2.fits | modeM0/AS1A14_125T09_9000006578_57704cztM0_level2_quad_clean.evt |
| Size (bytes) | 537,145,920 | 97,850,880 |
| Size | 512.3 MB | 93.3 MB |
| Events in quadrant A | 3,134,477 | 677,324 |
| Events in quadrant B | 3,945,985 | 721,341 |
| Events in quadrant C | 6,741,735 | 592,229 |
| Events in quadrant D | 5,509,986 | 478,251 |
| Mode SS | |||
|---|---|---|---|
| Quadrant | BADHDUFLAG | Total packets | Discarded packets |
| A | 0 | 142 | 0 |
| B | 0 | 142 | 0 |
| C | 0 | 142 | 0 |
| D | 0 | 142 | 0 |
| Mode M0 | |||
|---|---|---|---|
| Quadrant | BADHDUFLAG | Total packets | Discarded packets |
| A | 0 | 14364 | 0 |
| B | 0 | 16273 | 0 |
| C | 0 | 24940 | 0 |
| D | 0 | 21296 | 0 |
| Quadrant | Total seconds | Saturated seconds | Saturation percentage |
|---|---|---|---|
| A | 7088 | 6 | 0.084650% |
| B | 7088 | 80 | 1.128668% |
| C | 7088 | 834 | 11.766366% |
| D | 7088 | 1564 | 22.065463% |
Noise dominated data is calculated using 1-second bins in cleaned event files. If a bin has >2000 counts, and if more than 50% of those come from <1% of pixels, then it is considered to be noise-dominated and hence unusable.
| Quadrant | # 1 sec bins | Bins with >0 counts | Bins with >2000 counts | High rate bins dominated by noise | Noise dominated (total time) | Noise dominated (detector-on time) | Marked lightcurve |
|---|---|---|---|---|---|---|---|
| A | 7088 | 7088 | 2 | 2 | 0.03% | 0.03% | 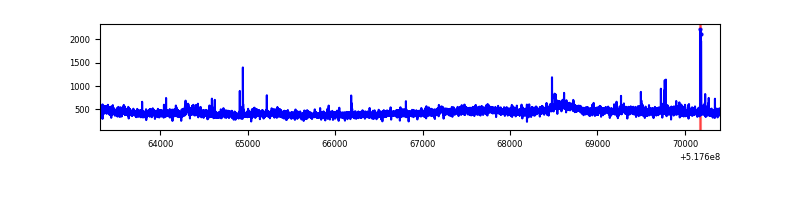 |
| B | 7088 | 7088 | 33 | 33 | 0.47% | 0.47% | 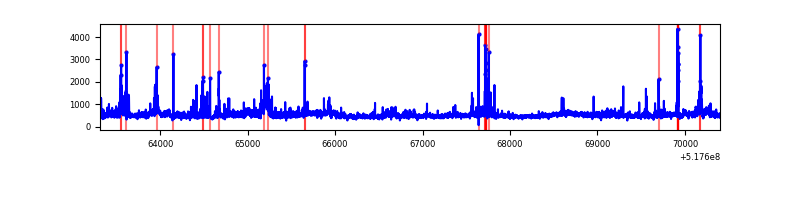 |
| C | 7088 | 7088 | 645 | 645 | 9.10% | 9.10% | 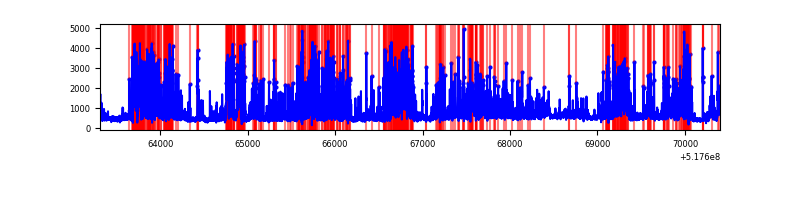 |
| D | 7088 | 7088 | 476 | 476 | 6.72% | 6.72% | 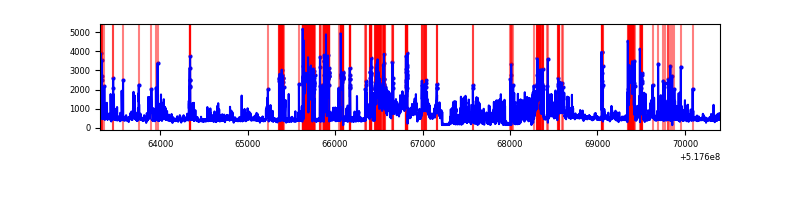 |
Top three noisy pixels from each quadrant. If the there are fewer than three noisy pixels in the level2.evt file, extra rows are filled as -1
| Pixel properties | Quadrant properties | ||||||
|---|---|---|---|---|---|---|---|
| Quadrant | DetID | PixID | Counts | Sigma | Mean | Median | Sigma |
| A | 3 | 128 | 95483 | 499.48 | 767 | 747 | 189.7 |
| A | 4 | 78 | 22353 | 113.91 | 767 | 747 | 189.7 |
| A | 7 | 223 | 14347 | 71.7 | 767 | 747 | 189.7 |
| B | 7 | 0 | 282859 | 1749.39 | 753 | 723 | 161.3 |
| B | 4 | 80 | 189546 | 1170.8 | 753 | 723 | 161.3 |
| B | 0 | 155 | 186223 | 1150.2 | 753 | 723 | 161.3 |
| C | 15 | 224 | 3422679 | 17792.85 | 709 | 704 | 192.3 |
| C | 12 | 254 | 137614 | 711.88 | 709 | 704 | 192.3 |
| C | 14 | 67 | 118474 | 612.36 | 709 | 704 | 192.3 |
| D | 8 | 240 | 2529338 | 14733.46 | 603 | 576 | 171.6 |
| D | 7 | 253 | 162487 | 943.35 | 603 | 576 | 171.6 |
| D | 2 | 31 | 114067 | 661.24 | 603 | 576 | 171.6 |
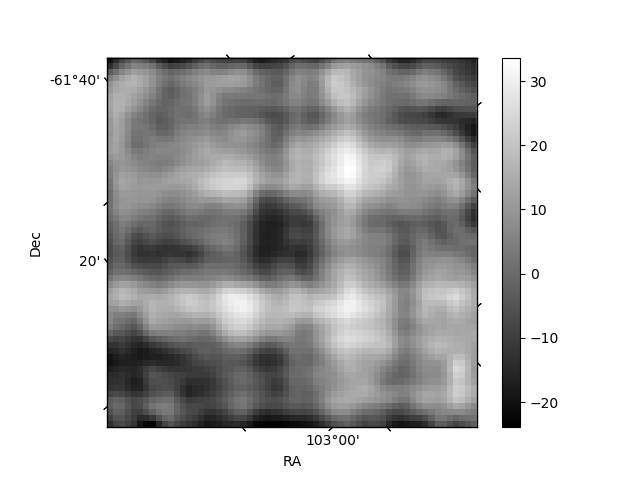
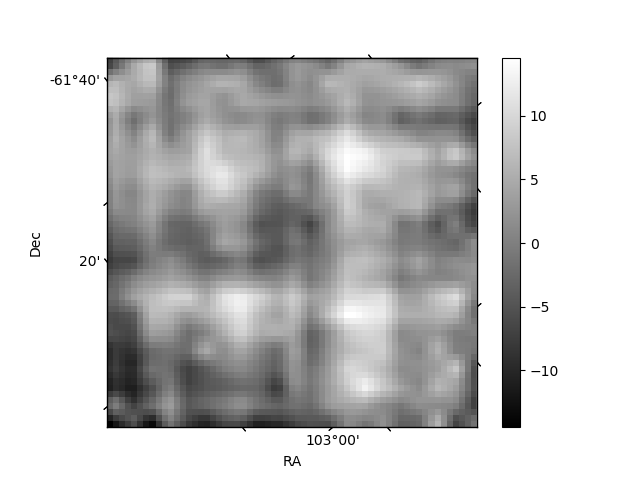
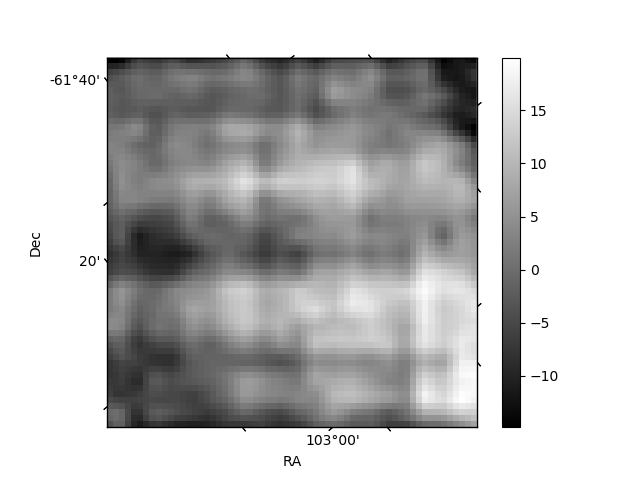
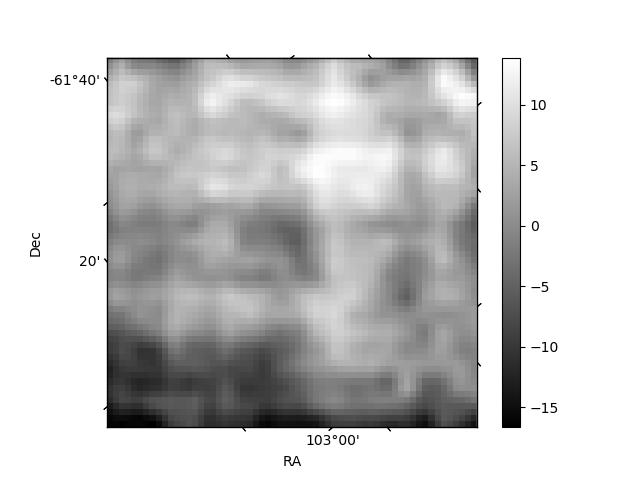
Histogram calculated using DETX and DETY for each event in the final _common_clean file
| Quadrant A | 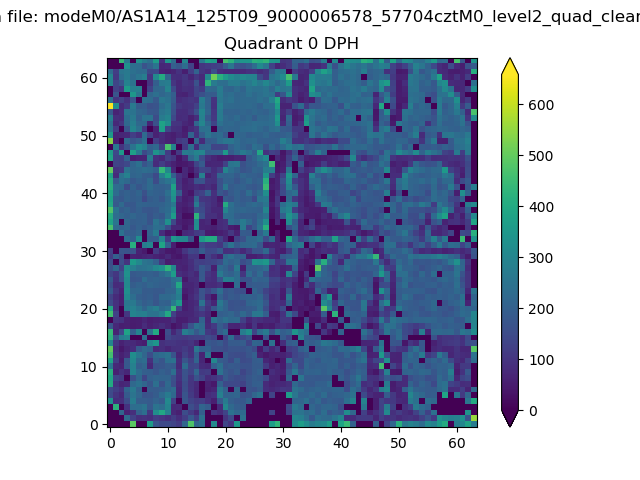 |
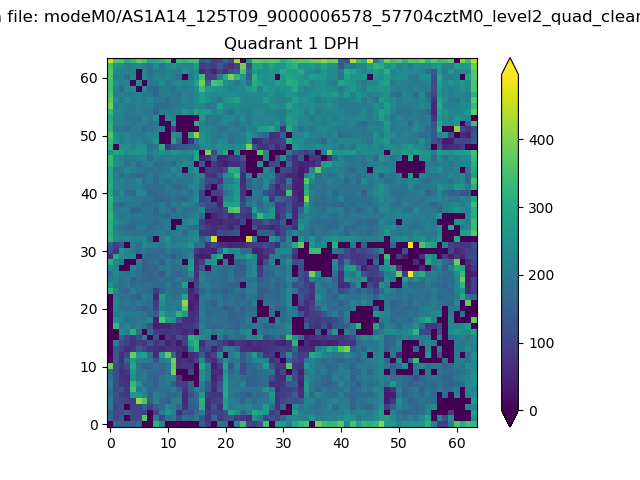 |
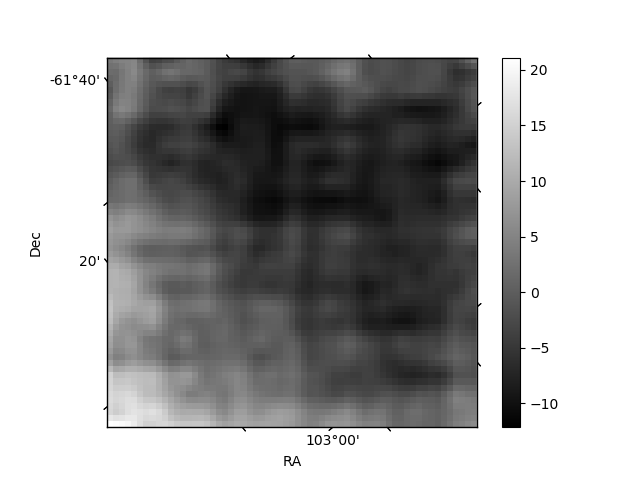
Quadrant B |
|---|---|---|---|
| Quadrant D | 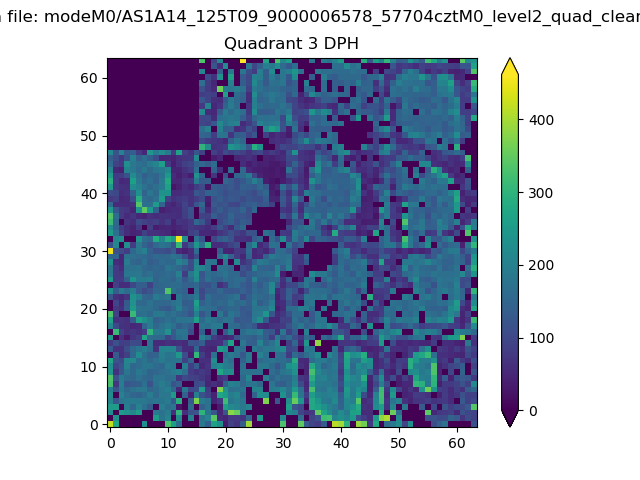 |
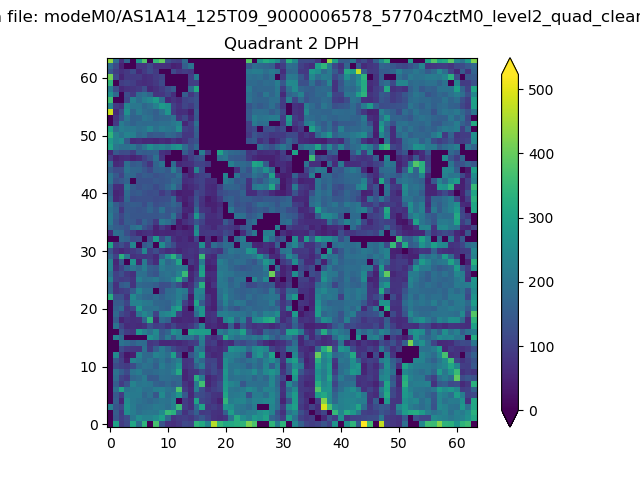 |
Quadrant C |
| Plot type | Count rate plots | Images |
|---|---|---|
| Comparison with Poisson distribution Blue bars denote a histogram of data divided into 1 sec bins. Red curve is a Poisson curve with rate = median count rate of data. |
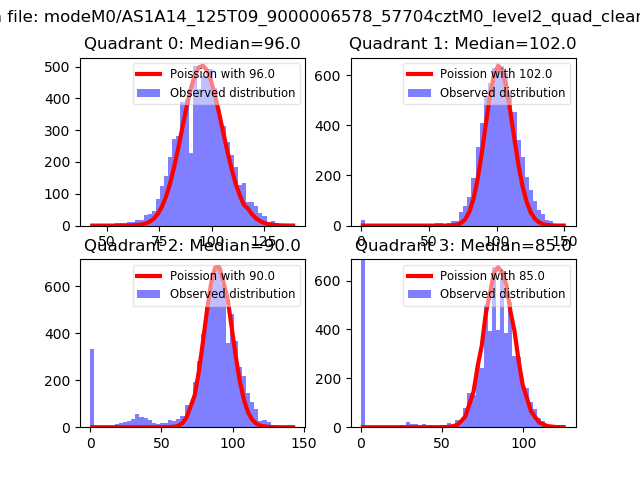 |
 |
| Quadrant-wise count rates Data is divided into 100 sec bins |
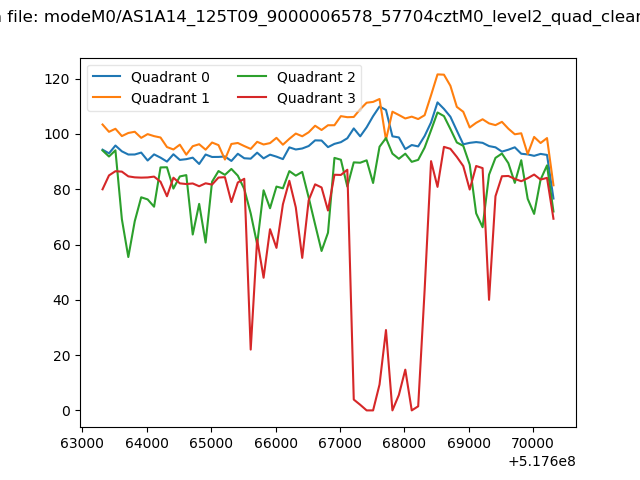 |
|
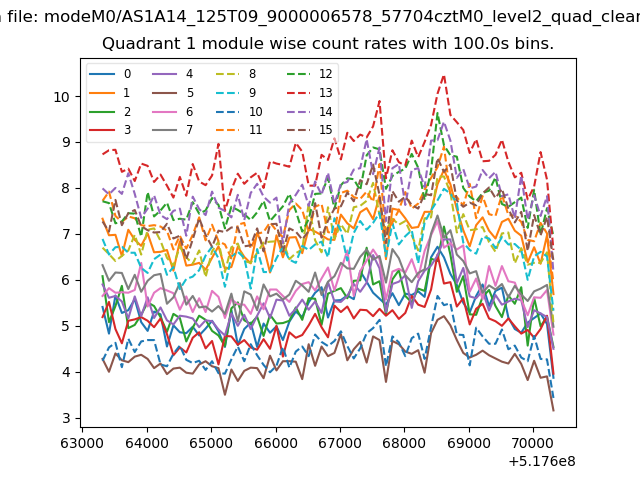
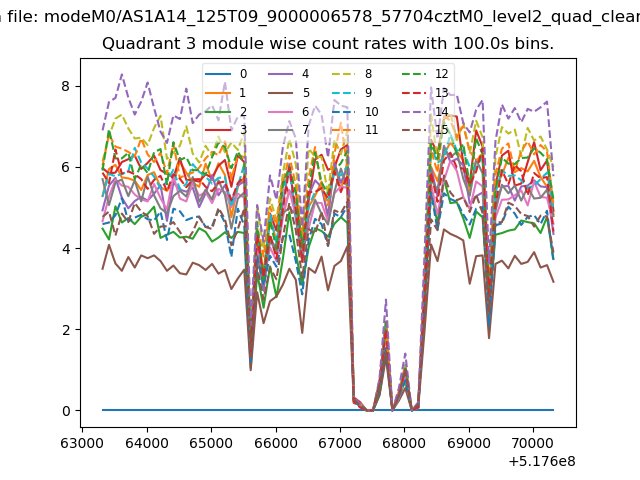
| Module-wise count rates for Quadrant A Data is divided into 100 sec bins |
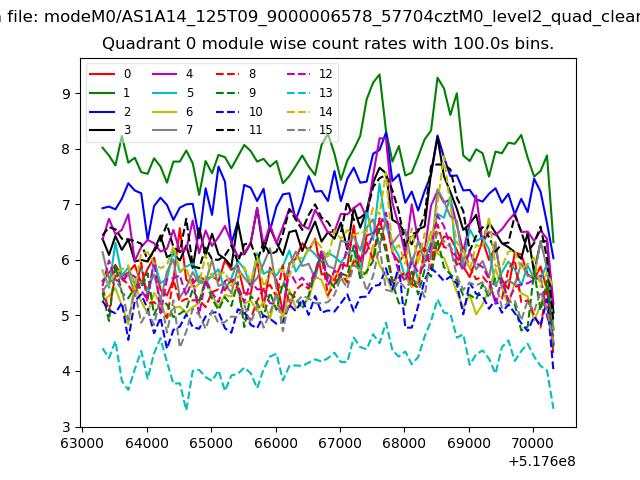 |
 |
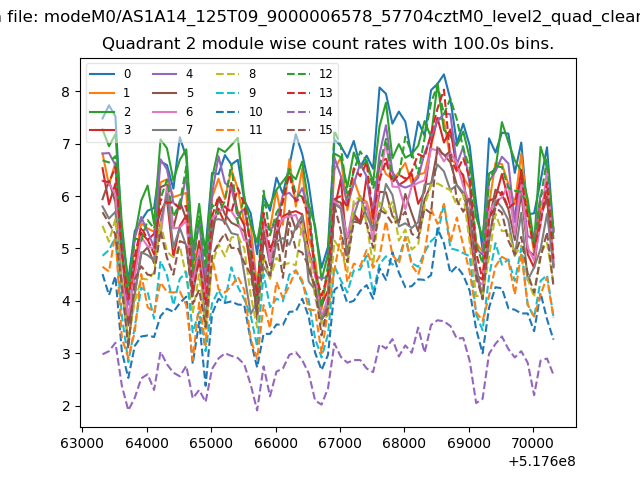
| Module-wise count rates for Quadrant B Data is divided into 100 sec bins |
 |
 |
| Module-wise count rates for Quadrant C Data is divided into 100 sec bins |
 |
 |
| Module-wise count rates for Quadrant D Data is divided into 100 sec bins |
 |
 |
| Parameter | Plot |
|---|---|
| CZT HV Monitor | 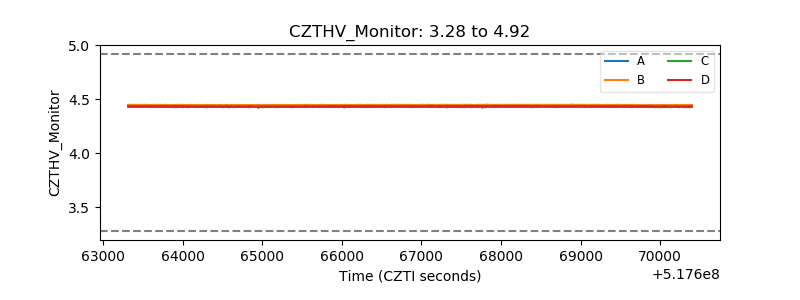 |
| D_VDD | 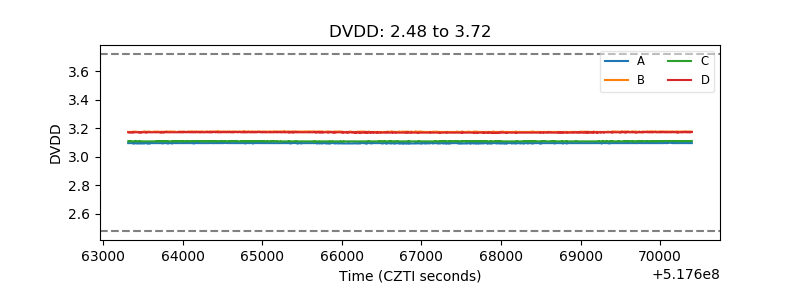 |
| Temperature 1 | 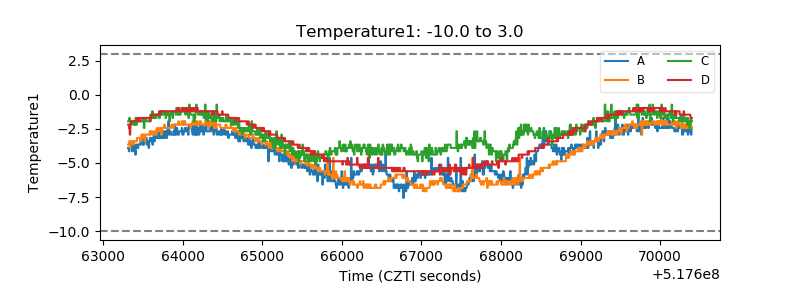 |
| Veto HV Monitor | 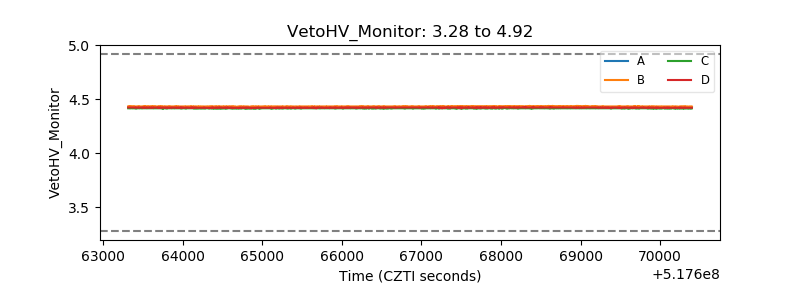 |
| Veto LLD | 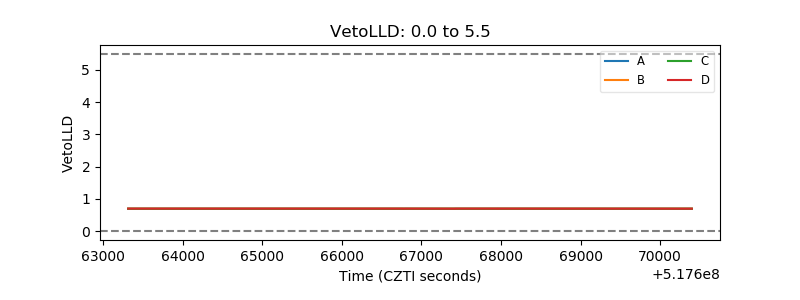 |
| Alpha Counter | 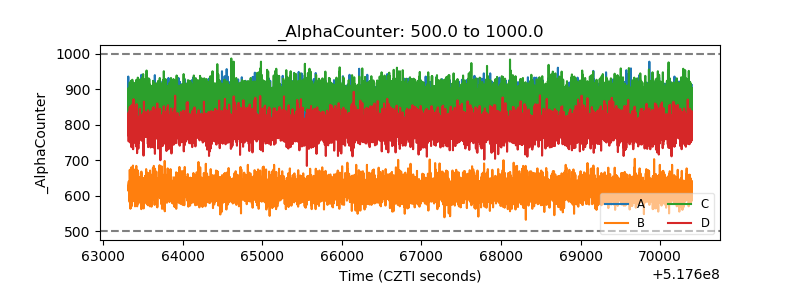 |
| _CPM_Rate | 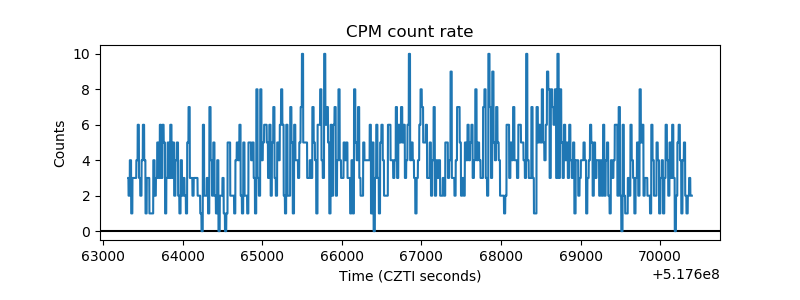 |
| CZT Counter | 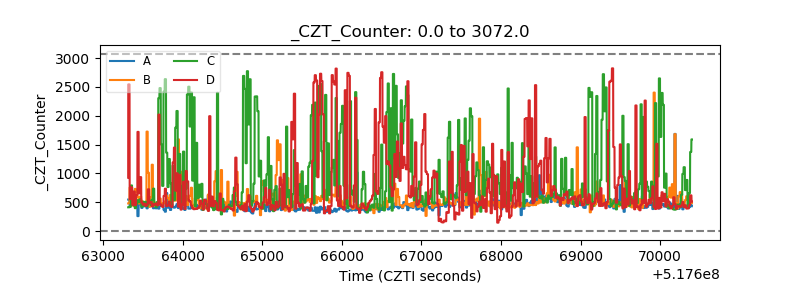 |
| +2.5 Volts monitor |  |
| +5 Volts monitor |  |
| _ROLL_ROT | 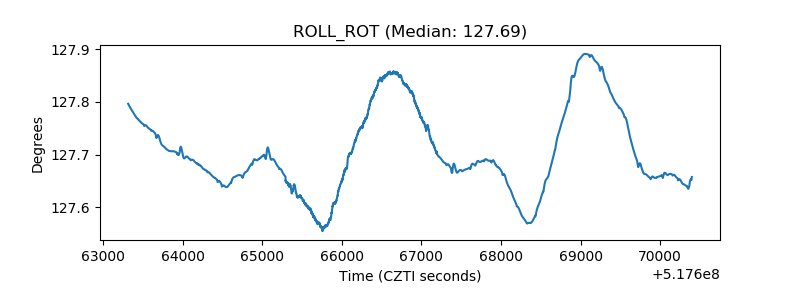 |
| _Roll_DEC | 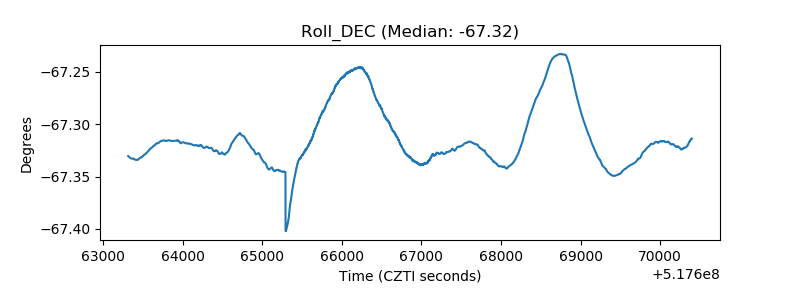 |
| _Roll_RA | 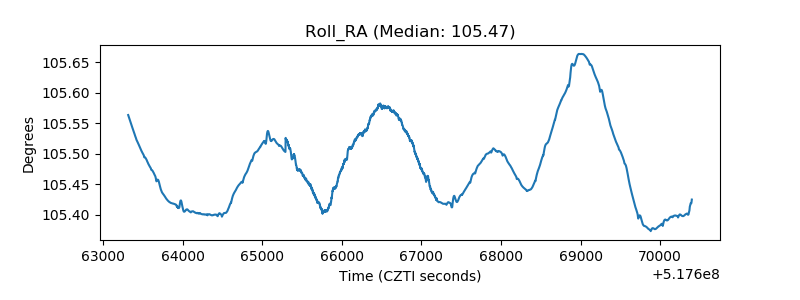 |
| Veto Counter | 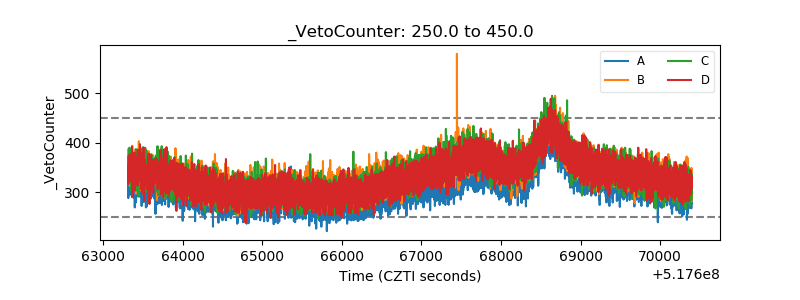 |