| Param | Original file | Final file |
|---|---|---|
| Filename | modeM0/AS1A14_125T09_9000006578_57707cztM0_level2.fits | modeM0/AS1A14_125T09_9000006578_57707cztM0_level2_quad_clean.evt |
| Size (bytes) | 1,194,246,720 | 267,324,480 |
| Size | 1.1 GB | 254.9 MB |
| Events in quadrant A | 8,305,788 | 1,787,640 |
| Events in quadrant B | 10,366,598 | 1,799,696 |
| Events in quadrant C | 13,267,063 | 1,628,632 |
| Events in quadrant D | 10,811,808 | 1,582,820 |
| Mode M9 | |||
|---|---|---|---|
| Quadrant | BADHDUFLAG | Total packets | Discarded packets |
| A | 0 | 12 | 0 |
| B | 0 | 12 | 0 |
| C | 0 | 12 | 0 |
| D | 0 | 12 | 0 |
| Mode SS | |||
|---|---|---|---|
| Quadrant | BADHDUFLAG | Total packets | Discarded packets |
| A | 0 | 380 | 0 |
| B | 0 | 380 | 0 |
| C | 0 | 380 | 0 |
| D | 0 | 380 | 0 |
| Mode M0 | |||
|---|---|---|---|
| Quadrant | BADHDUFLAG | Total packets | Discarded packets |
| A | 0 | 38788 | 3 |
| B | 0 | 43859 | 3 |
| C | 0 | 52579 | 5 |
| D | 0 | 45221 | 3 |
| Quadrant | Total seconds | Saturated seconds | Saturation percentage |
|---|---|---|---|
| A | 18797 | 174 | 0.925680% |
| B | 18798 | 756 | 4.021704% |
| C | 18797 | 1049 | 5.580678% |
| D | 18797 | 479 | 2.548279% |
Noise dominated data is calculated using 1-second bins in cleaned event files. If a bin has >2000 counts, and if more than 50% of those come from <1% of pixels, then it is considered to be noise-dominated and hence unusable.
| Quadrant | # 1 sec bins | Bins with >0 counts | Bins with >2000 counts | High rate bins dominated by noise | Noise dominated (total time) | Noise dominated (detector-on time) | Marked lightcurve |
|---|---|---|---|---|---|---|---|
| A | 19872 | 18801 | 28 | 28 | 0.14% | 0.15% | 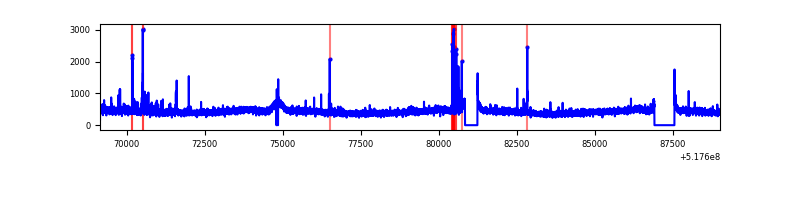 |
| B | 19873 | 18802 | 289 | 289 | 1.45% | 1.54% | 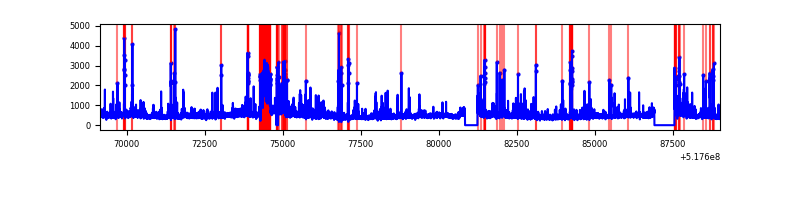 |
| C | 19872 | 18801 | 816 | 816 | 4.11% | 4.34% | 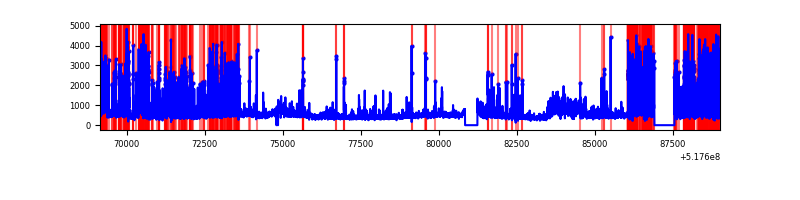 |
| D | 19872 | 18801 | 358 | 358 | 1.80% | 1.90% | 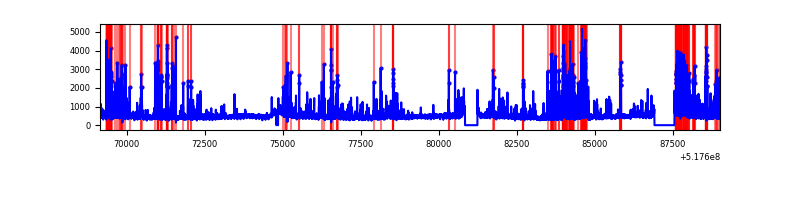 |
Top three noisy pixels from each quadrant. If the there are fewer than three noisy pixels in the level2.evt file, extra rows are filled as -1
| Pixel properties | Quadrant properties | ||||||
|---|---|---|---|---|---|---|---|
| Quadrant | DetID | PixID | Counts | Sigma | Mean | Median | Sigma |
| A | 3 | 79 | 150223 | 294.41 | 2052 | 1996 | 503.5 |
| A | 3 | 128 | 73330 | 141.69 | 2052 | 1996 | 503.5 |
| A | 13 | 248 | 70911 | 136.88 | 2052 | 1996 | 503.5 |
| B | 4 | 80 | 744375 | 1731.35 | 2001 | 1922 | 428.8 |
| B | 10 | 16 | 363636 | 843.49 | 2001 | 1922 | 428.8 |
| B | 10 | 247 | 208104 | 480.8 | 2001 | 1922 | 428.8 |
| C | 15 | 224 | 3821206 | 7277.96 | 1937 | 1918 | 524.8 |
| C | 12 | 249 | 482514 | 915.81 | 1937 | 1918 | 524.8 |
| C | 12 | 254 | 291281 | 551.4 | 1937 | 1918 | 524.8 |
| D | 2 | 249 | 1046358 | 1892.95 | 1964 | 1877 | 551.8 |
| D | 8 | 240 | 447965 | 808.46 | 1964 | 1877 | 551.8 |
| D | 3 | 224 | 347883 | 627.08 | 1964 | 1877 | 551.8 |
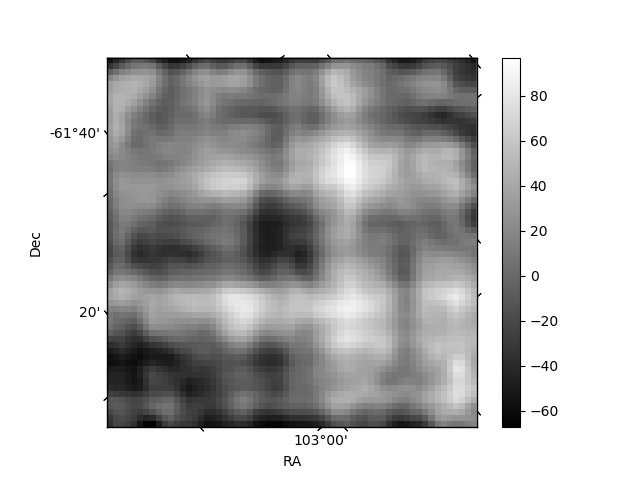
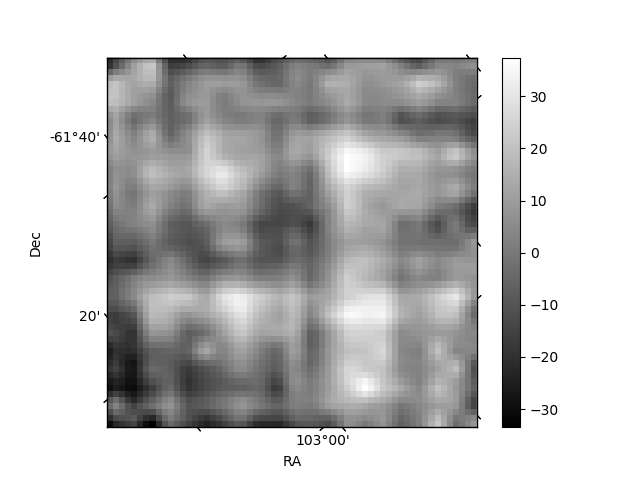
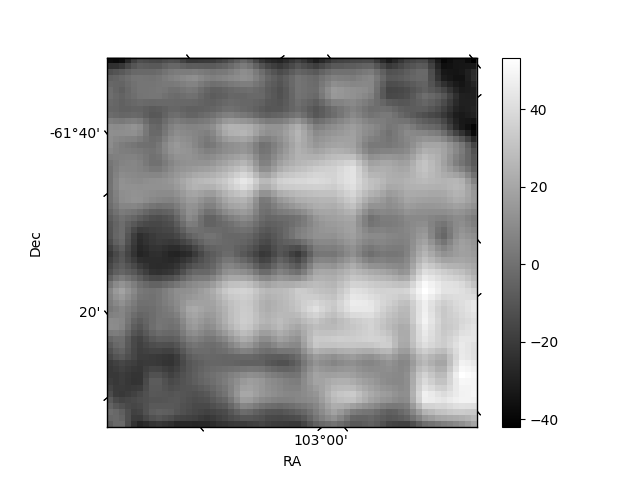
Histogram calculated using DETX and DETY for each event in the final _common_clean file
| Quadrant A | 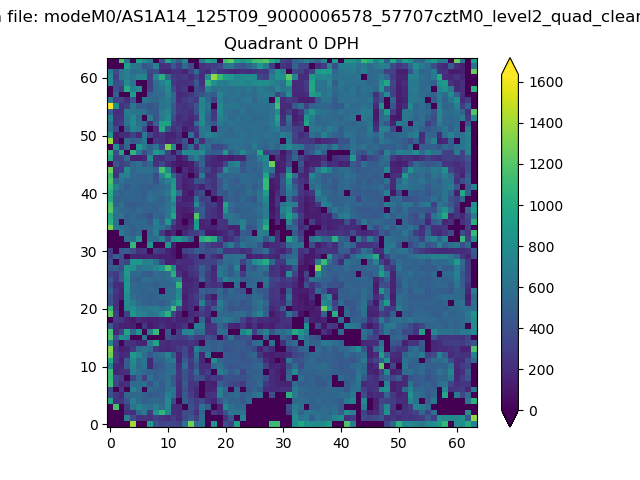 |
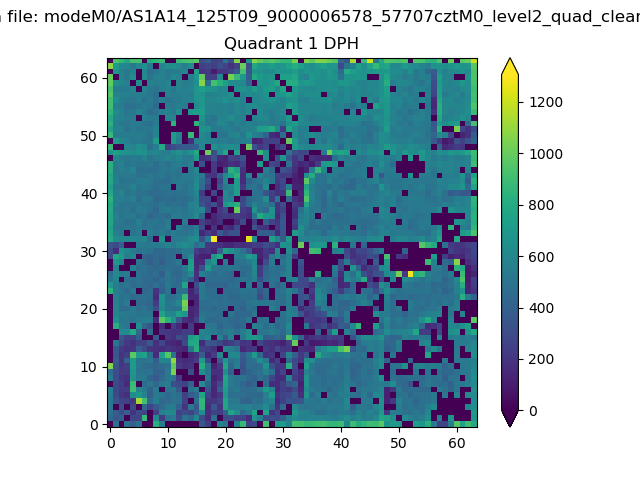 |
Quadrant B |
|---|---|---|---|
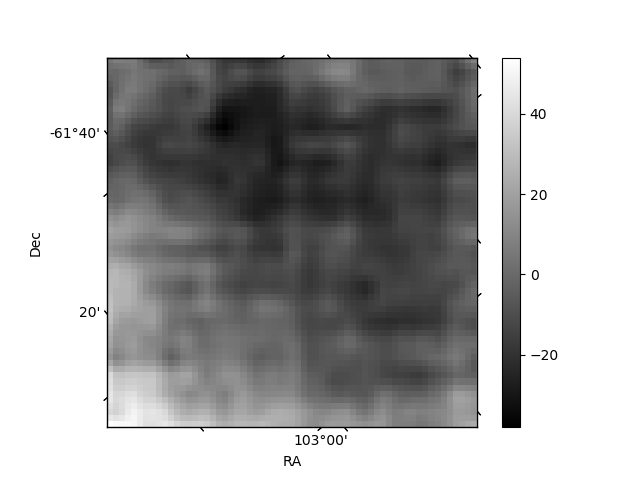
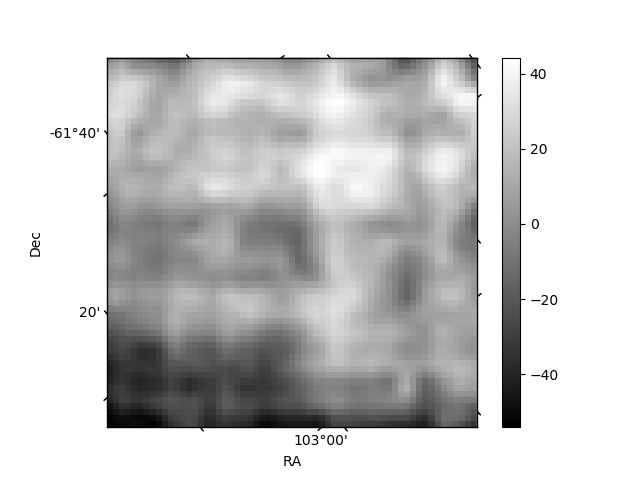
| Quadrant D | 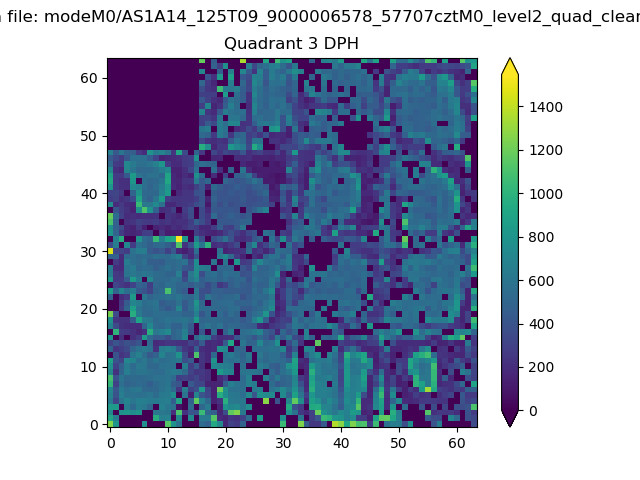 |
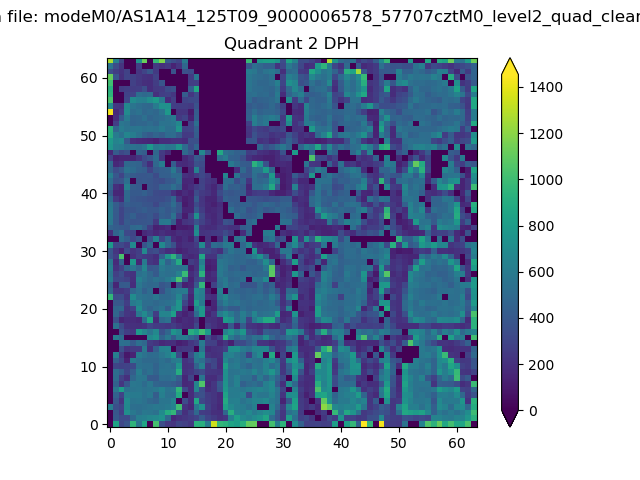 |
Quadrant C |
| Plot type | Count rate plots | Images |
|---|---|---|
| Comparison with Poisson distribution Blue bars denote a histogram of data divided into 1 sec bins. Red curve is a Poisson curve with rate = median count rate of data. |
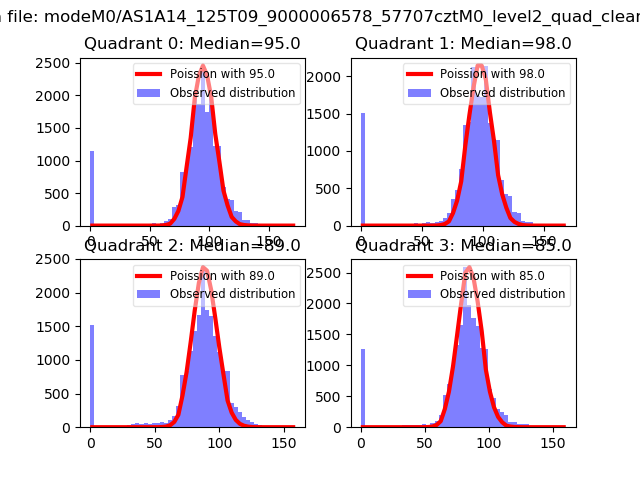 |
 |
| Quadrant-wise count rates Data is divided into 100 sec bins |
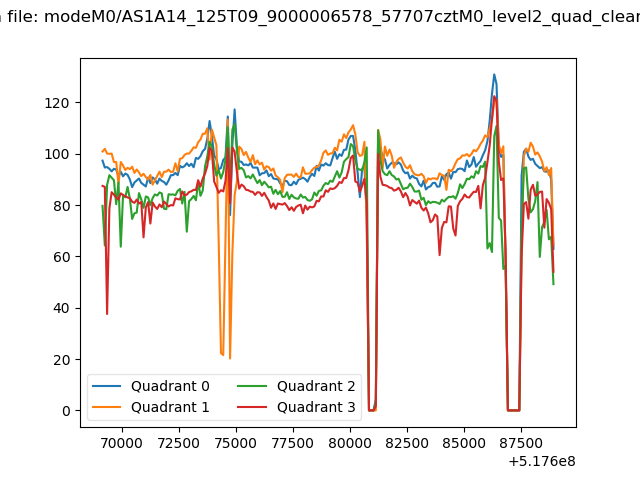 |
|
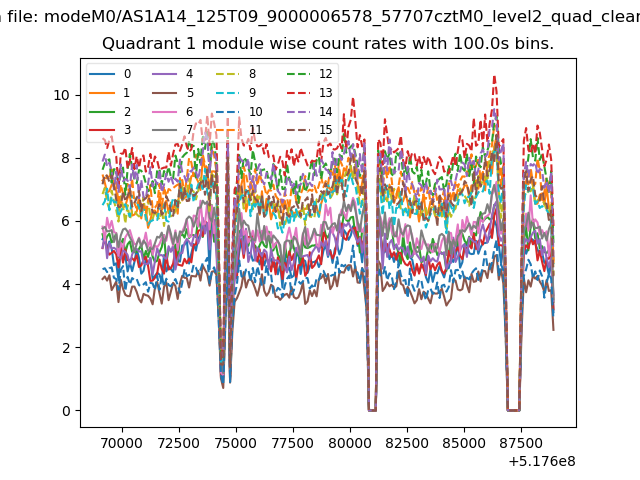
| Module-wise count rates for Quadrant A Data is divided into 100 sec bins |
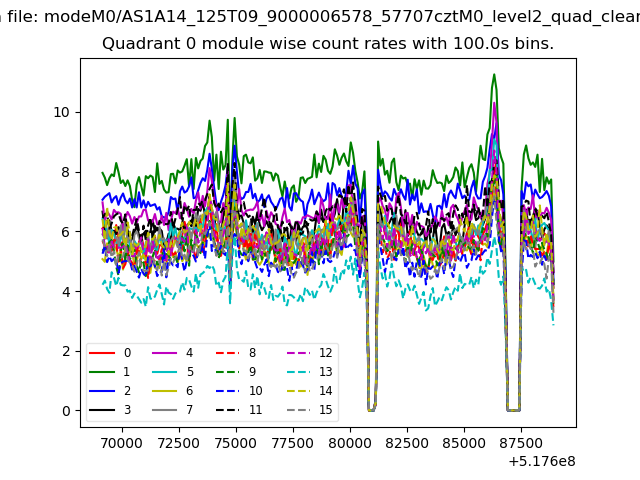 |
 |
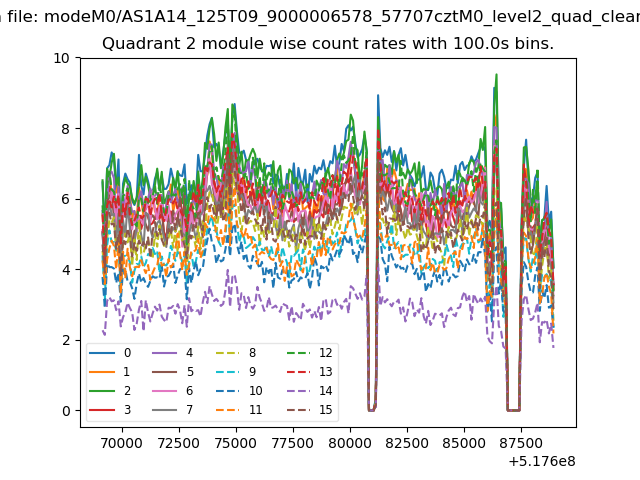
| Module-wise count rates for Quadrant B Data is divided into 100 sec bins |
 |
 |
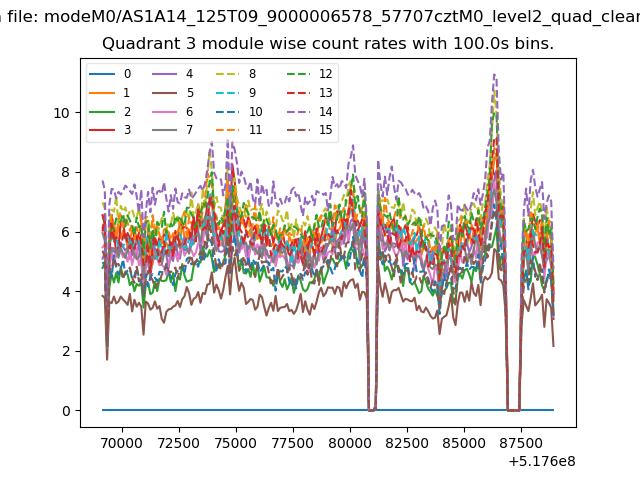
| Module-wise count rates for Quadrant C Data is divided into 100 sec bins |
 |
 |
| Module-wise count rates for Quadrant D Data is divided into 100 sec bins |
 |
 |
| Parameter | Plot |
|---|---|
| CZT HV Monitor | 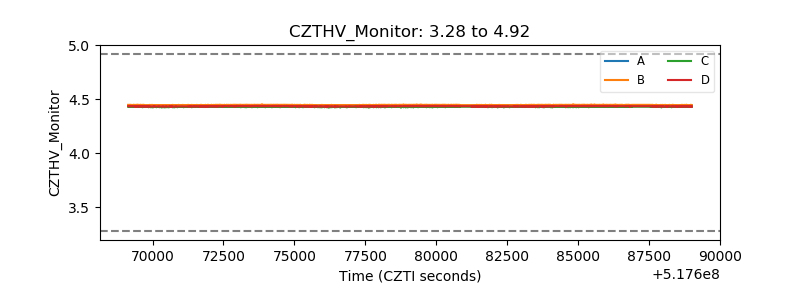 |
| D_VDD | 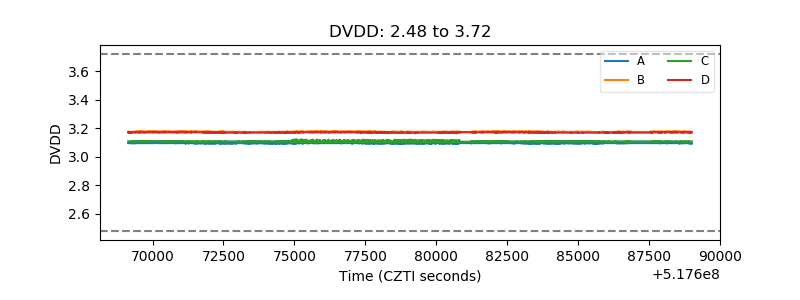 |
| Temperature 1 | 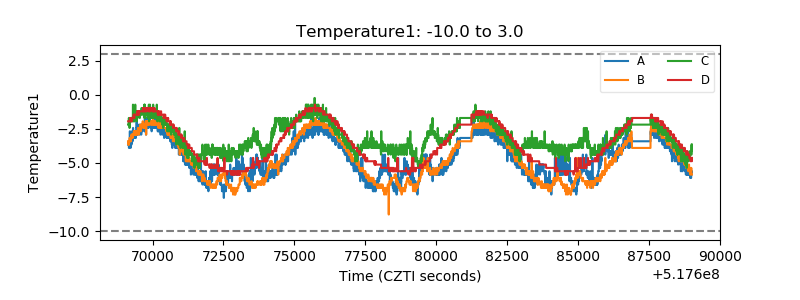 |
| Veto HV Monitor | 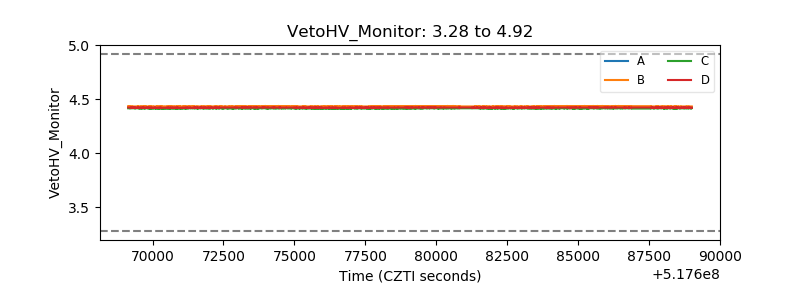 |
| Veto LLD | 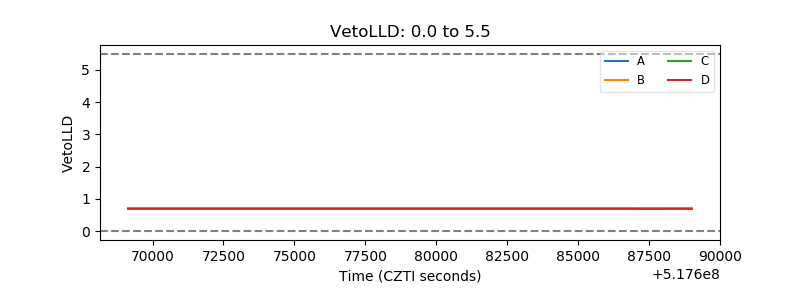 |
| Alpha Counter | 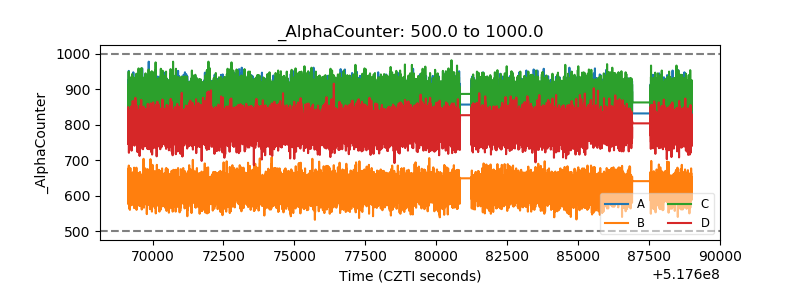 |
| _CPM_Rate | 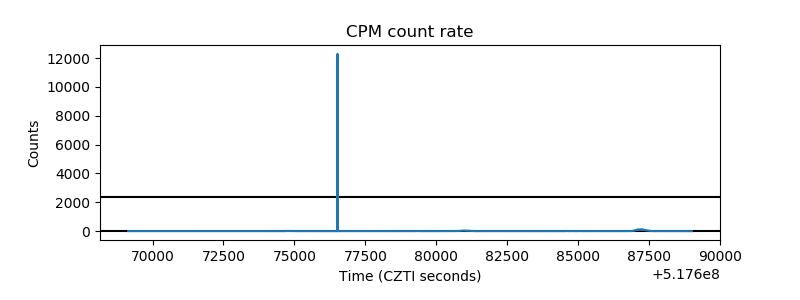 |
| CZT Counter | 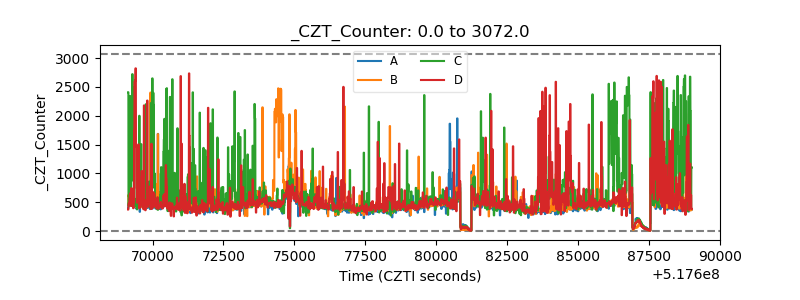 |
| +2.5 Volts monitor | 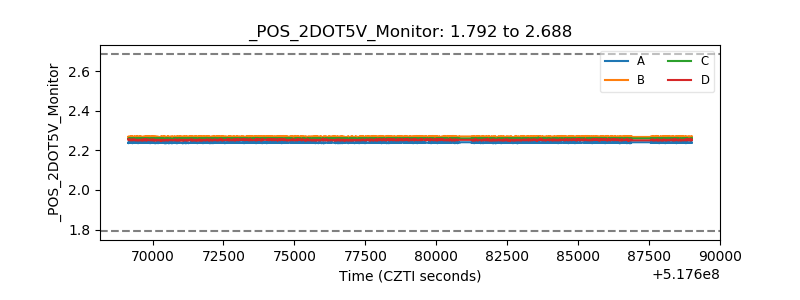 |
| +5 Volts monitor |  |
| _ROLL_ROT | 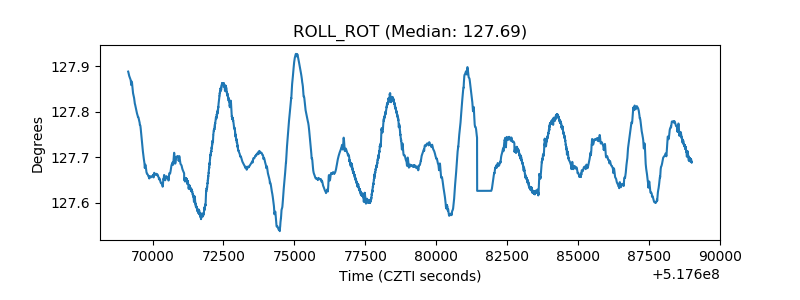 |
| _Roll_DEC | 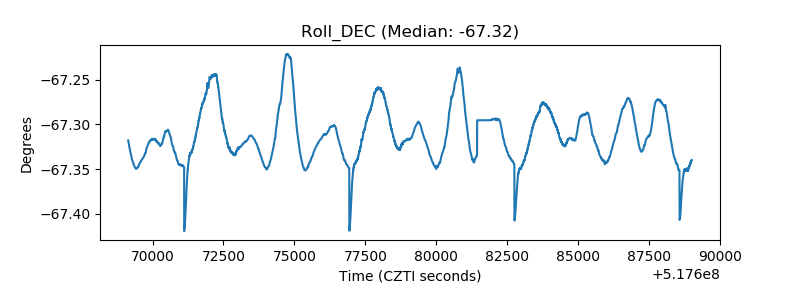 |
| _Roll_RA | 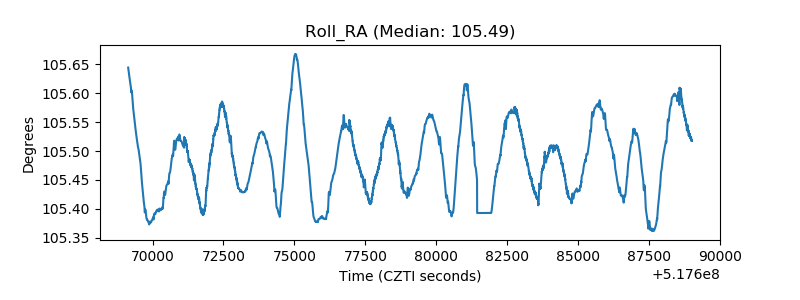 |
| Veto Counter | 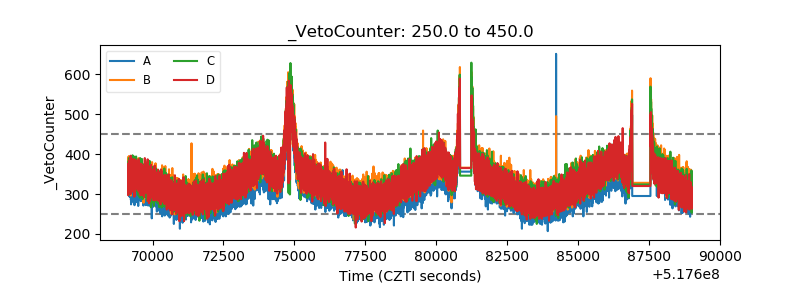 |