| Param | Original file | Final file |
|---|---|---|
| Filename | modeM0/AS1A14_125T09_9000006578_57712cztM0_level2.fits | modeM0/AS1A14_125T09_9000006578_57712cztM0_level2_quad_clean.evt |
| Size (bytes) | 485,199,360 | 95,319,360 |
| Size | 462.7 MB | 90.9 MB |
| Events in quadrant A | 2,762,472 | 653,894 |
| Events in quadrant B | 3,261,897 | 694,468 |
| Events in quadrant C | 5,648,622 | 576,280 |
| Events in quadrant D | 5,795,221 | 519,740 |
| Mode M9 | |||
|---|---|---|---|
| Quadrant | BADHDUFLAG | Total packets | Discarded packets |
| A | 0 | 21 | 0 |
| B | 0 | 22 | 0 |
| C | 0 | 22 | 0 |
| D | 0 | 22 | 0 |
| Mode SS | |||
|---|---|---|---|
| Quadrant | BADHDUFLAG | Total packets | Discarded packets |
| A | 0 | 128 | 0 |
| B | 0 | 128 | 0 |
| C | 0 | 128 | 0 |
| D | 0 | 128 | 0 |
| Mode M0 | |||
|---|---|---|---|
| Quadrant | BADHDUFLAG | Total packets | Discarded packets |
| A | 0 | 12829 | 2 |
| B | 0 | 14103 | 2 |
| C | 0 | 21131 | 2 |
| D | 0 | 21510 | 2 |
| Quadrant | Total seconds | Saturated seconds | Saturation percentage |
|---|---|---|---|
| A | 6334 | 11 | 0.173666% |
| B | 6334 | 127 | 2.005052% |
| C | 6334 | 642 | 10.135775% |
| D | 6334 | 799 | 12.614462% |
Noise dominated data is calculated using 1-second bins in cleaned event files. If a bin has >2000 counts, and if more than 50% of those come from <1% of pixels, then it is considered to be noise-dominated and hence unusable.
| Quadrant | # 1 sec bins | Bins with >0 counts | Bins with >2000 counts | High rate bins dominated by noise | Noise dominated (total time) | Noise dominated (detector-on time) | Marked lightcurve |
|---|---|---|---|---|---|---|---|
| A | 7544 | 6335 | 0 | 0 | 0.00% | 0.00% | 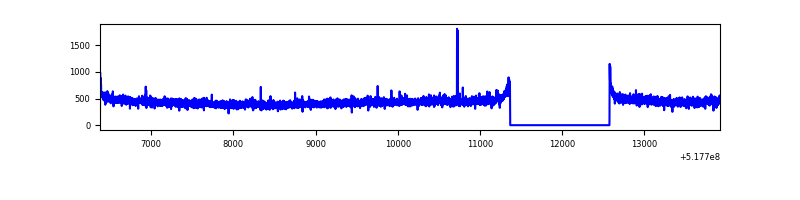 |
| B | 7544 | 6335 | 47 | 47 | 0.62% | 0.74% | 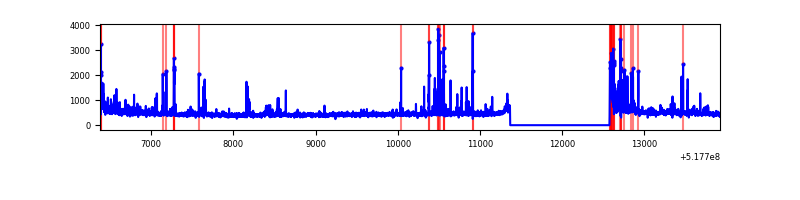 |
| C | 7544 | 6335 | 498 | 498 | 6.60% | 7.86% | 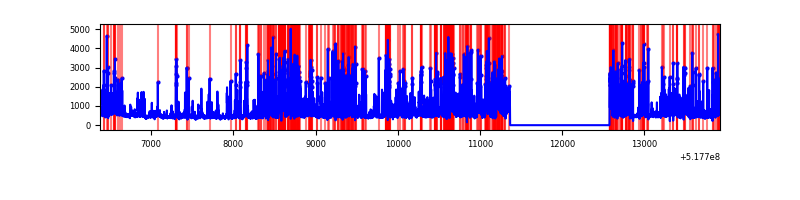 |
| D | 7544 | 6335 | 774 | 774 | 10.26% | 12.22% | 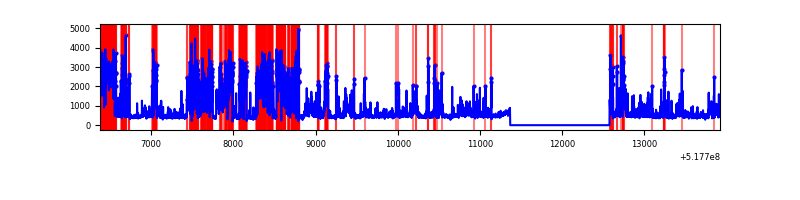 |
Top three noisy pixels from each quadrant. If the there are fewer than three noisy pixels in the level2.evt file, extra rows are filled as -1
| Pixel properties | Quadrant properties | ||||||
|---|---|---|---|---|---|---|---|
| Quadrant | DetID | PixID | Counts | Sigma | Mean | Median | Sigma |
| A | 3 | 128 | 21041 | 117.75 | 702 | 684 | 172.9 |
| A | 8 | 6 | 8835 | 47.15 | 702 | 684 | 172.9 |
| A | 11 | 31 | 8708 | 46.41 | 702 | 684 | 172.9 |
| B | 10 | 16 | 163474 | 1111.05 | 692 | 665 | 146.5 |
| B | 4 | 201 | 74330 | 502.71 | 692 | 665 | 146.5 |
| B | 5 | 185 | 68871 | 465.45 | 692 | 665 | 146.5 |
| C | 15 | 224 | 2620166 | 14623.15 | 659 | 654 | 179.1 |
| C | 12 | 254 | 240776 | 1340.46 | 659 | 654 | 179.1 |
| C | 14 | 254 | 71536 | 395.69 | 659 | 654 | 179.1 |
| D | 8 | 160 | 2784466 | 15105.26 | 647 | 616 | 184.3 |
| D | 2 | 153 | 190635 | 1031.05 | 647 | 616 | 184.3 |
| D | 3 | 12 | 151919 | 820.98 | 647 | 616 | 184.3 |
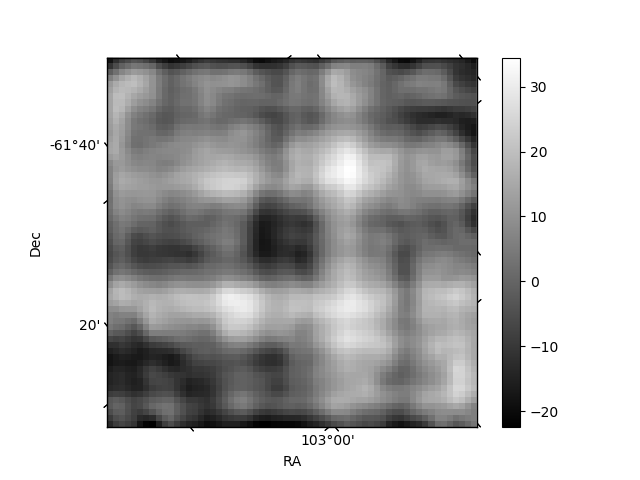
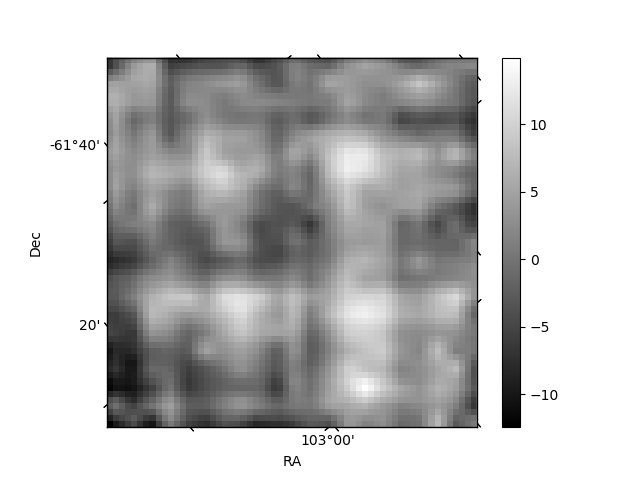
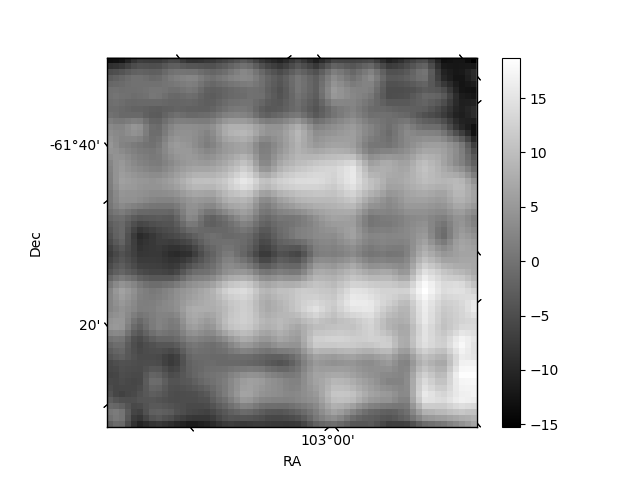
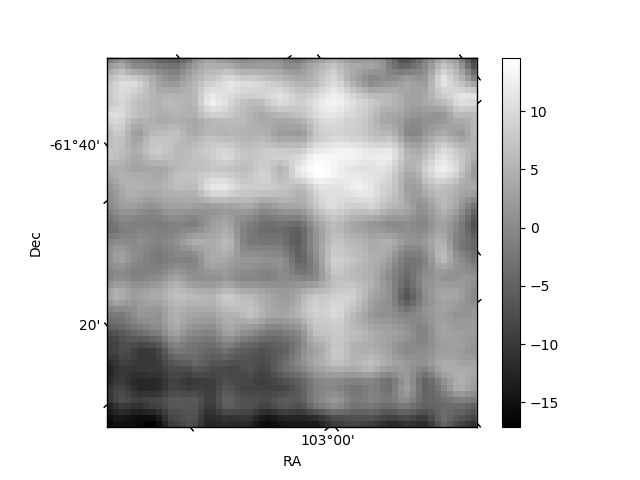
Histogram calculated using DETX and DETY for each event in the final _common_clean file
| Quadrant A | 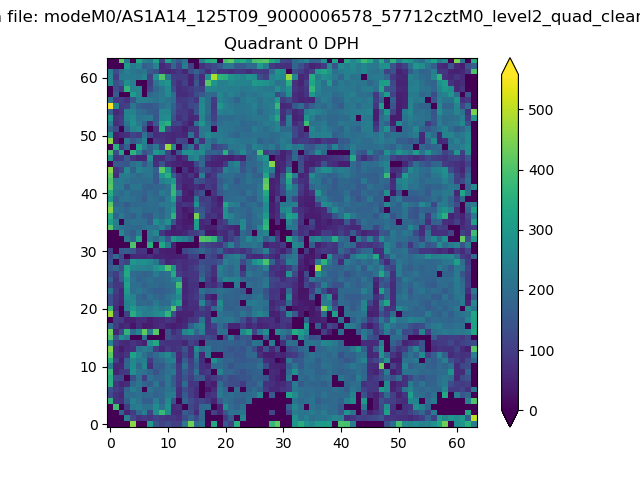 |
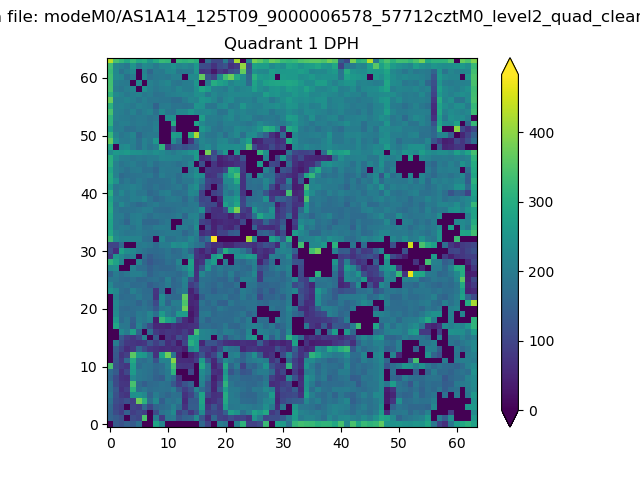 |
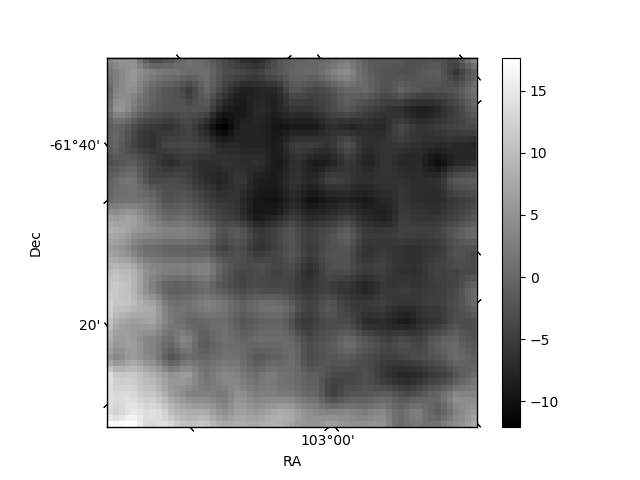
Quadrant B |
|---|---|---|---|
| Quadrant D | 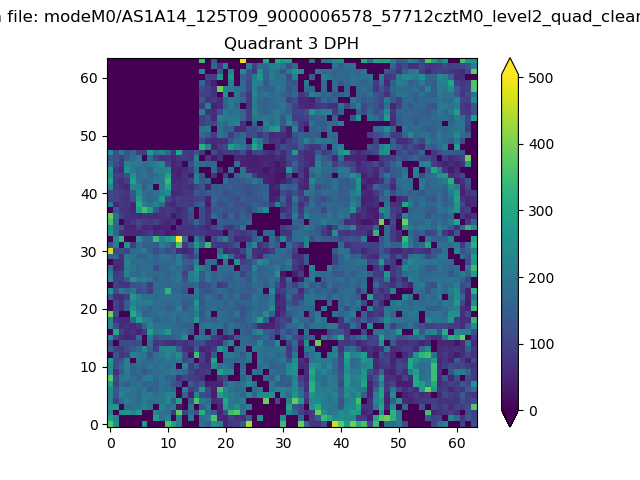 |
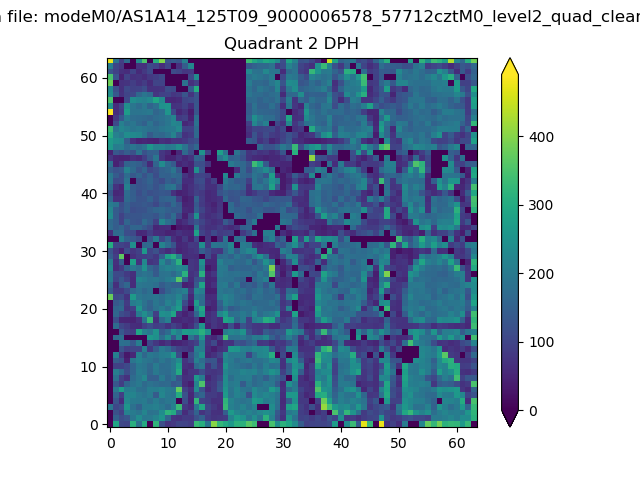 |
Quadrant C |
| Plot type | Count rate plots | Images |
|---|---|---|
| Comparison with Poisson distribution Blue bars denote a histogram of data divided into 1 sec bins. Red curve is a Poisson curve with rate = median count rate of data. |
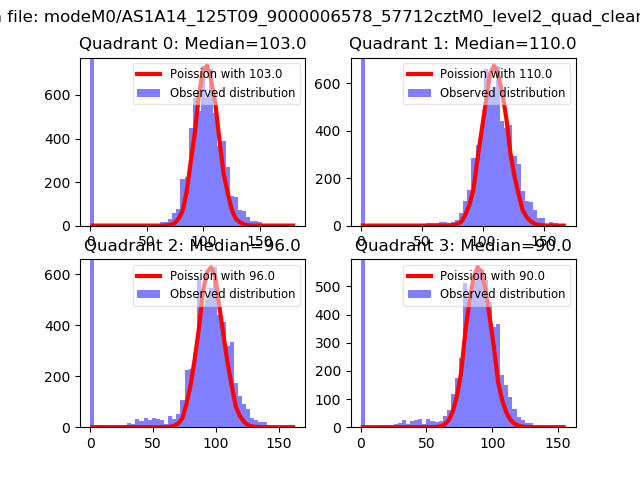 |
 |
| Quadrant-wise count rates Data is divided into 100 sec bins |
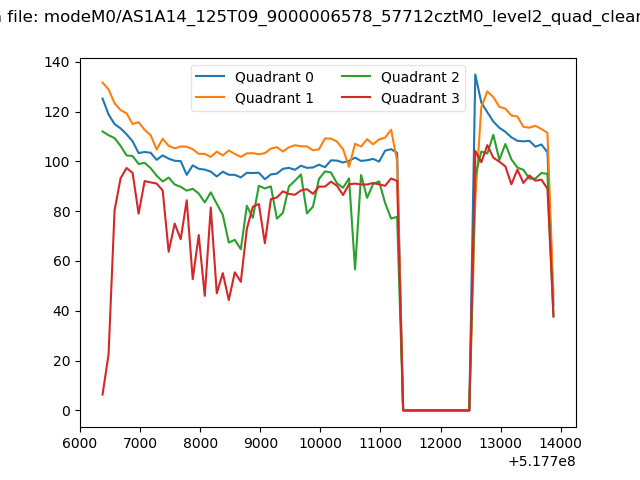 |
|
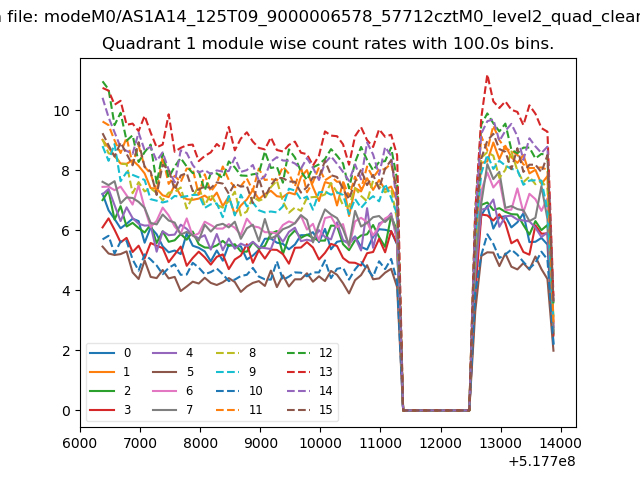
| Module-wise count rates for Quadrant A Data is divided into 100 sec bins |
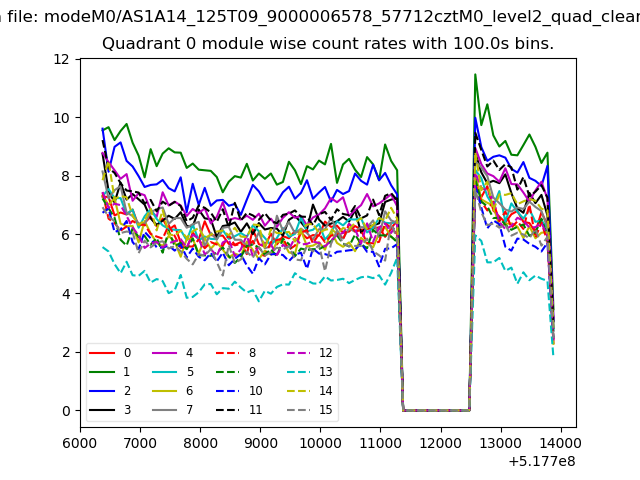 |
 |
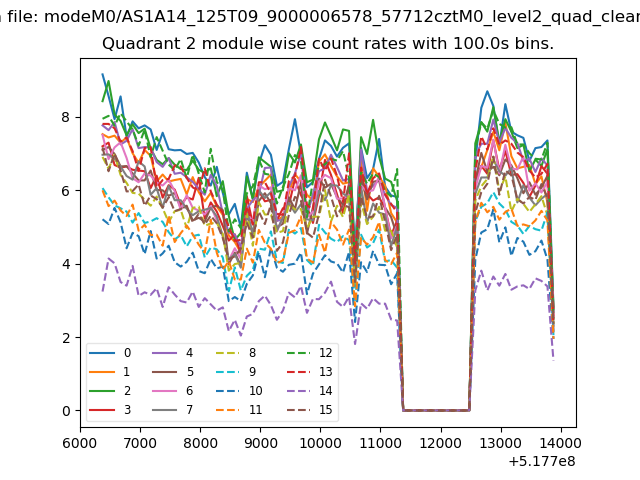
| Module-wise count rates for Quadrant B Data is divided into 100 sec bins |
 |
 |
| Module-wise count rates for Quadrant C Data is divided into 100 sec bins |
 |
 |
| Module-wise count rates for Quadrant D Data is divided into 100 sec bins |
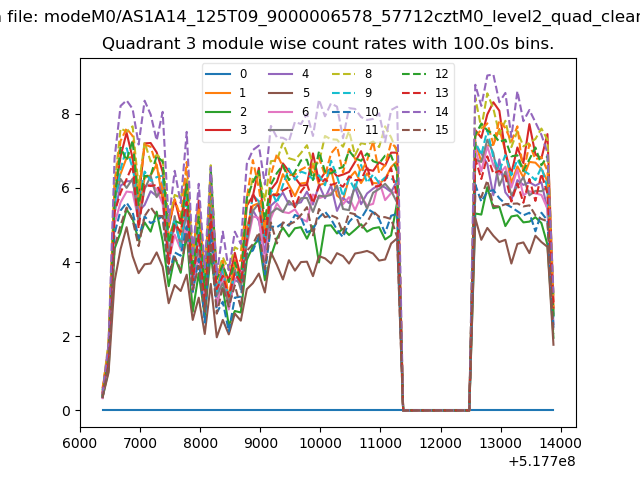 |
 |
| Parameter | Plot |
|---|---|
| CZT HV Monitor | 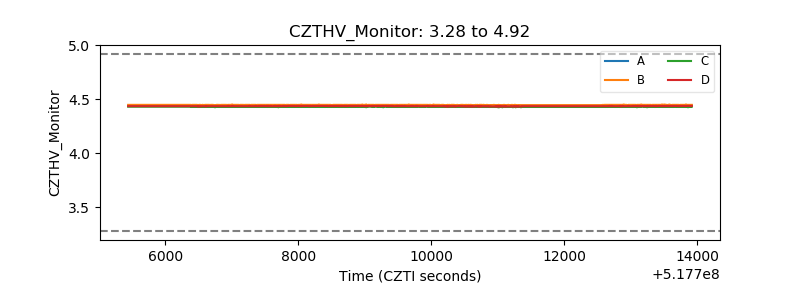 |
| D_VDD | 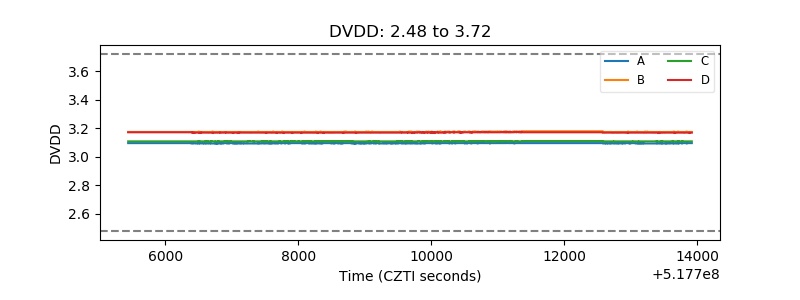 |
| Temperature 1 | 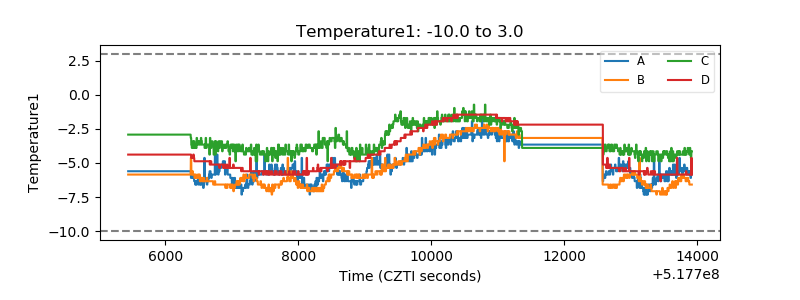 |
| Veto HV Monitor | 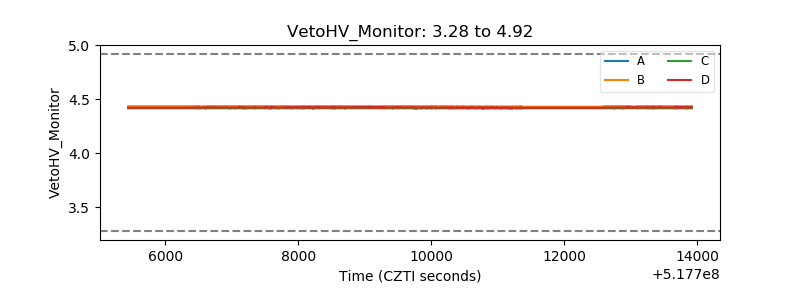 |
| Veto LLD | 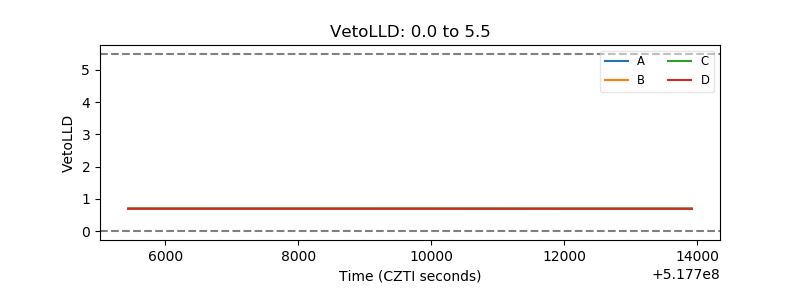 |
| Alpha Counter | 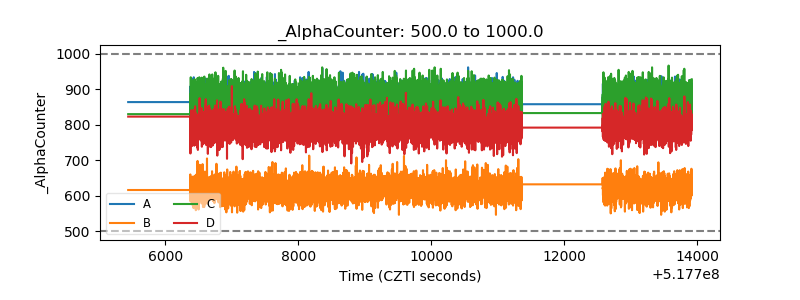 |
| _CPM_Rate | 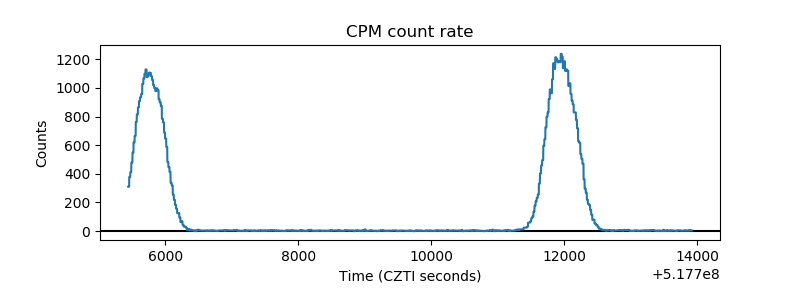 |
| CZT Counter | 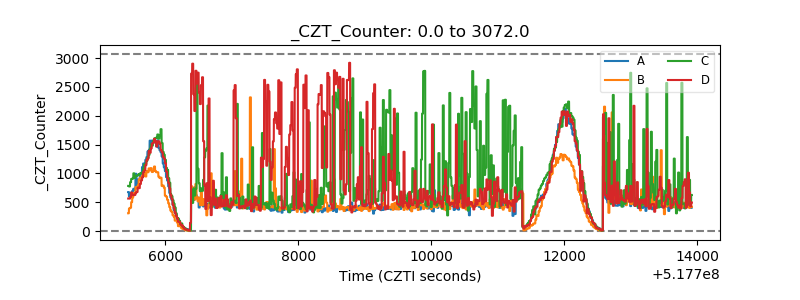 |
| +2.5 Volts monitor | 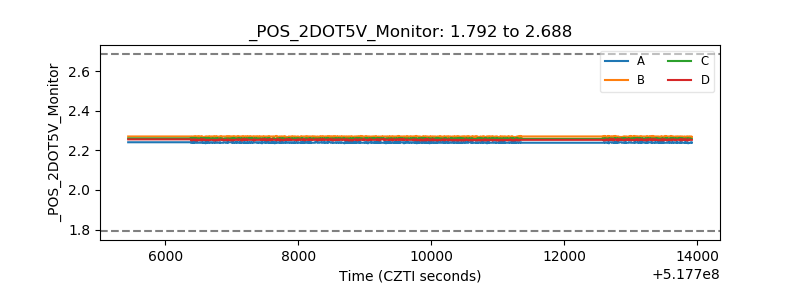 |
| +5 Volts monitor |  |
| _ROLL_ROT | 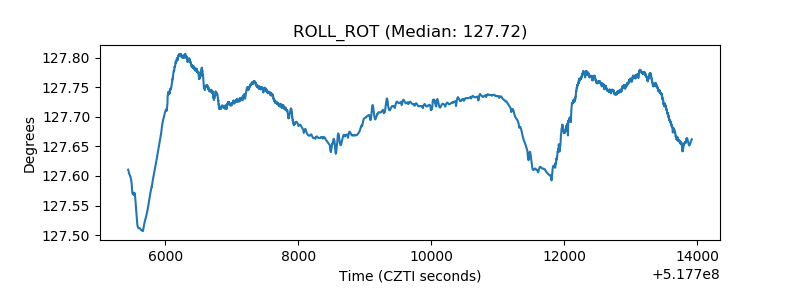 |
| _Roll_DEC | 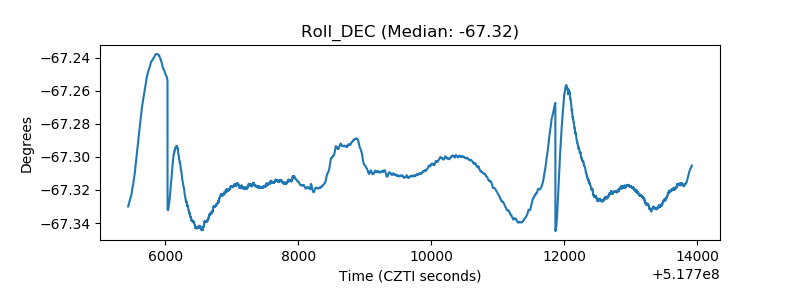 |
| _Roll_RA | 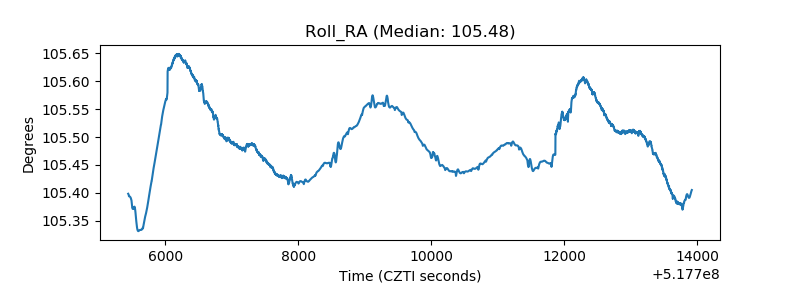 |
| Veto Counter | 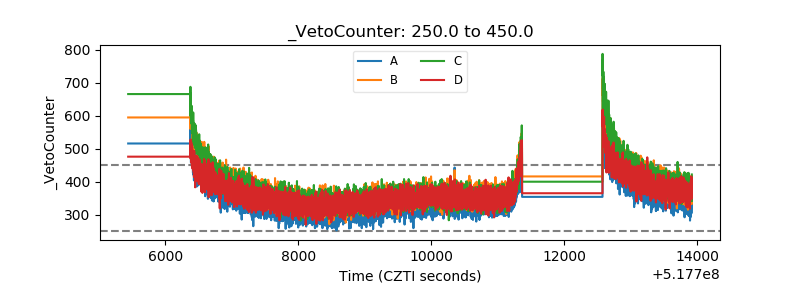 |