| Param | Original file | Final file |
|---|---|---|
| Filename | modeM0/AS1A14_125T09_9000006578_57714cztM0_level2.fits | modeM0/AS1A14_125T09_9000006578_57714cztM0_level2_quad_clean.evt |
| Size (bytes) | 465,888,960 | 87,408,000 |
| Size | 444.3 MB | 83.4 MB |
| Events in quadrant A | 2,595,146 | 603,310 |
| Events in quadrant B | 3,019,515 | 644,298 |
| Events in quadrant C | 7,174,334 | 463,545 |
| Events in quadrant D | 3,993,711 | 519,918 |
| Mode M9 | |||
|---|---|---|---|
| Quadrant | BADHDUFLAG | Total packets | Discarded packets |
| A | 0 | 12 | 0 |
| B | 0 | 12 | 0 |
| C | 0 | 12 | 0 |
| D | 0 | 12 | 0 |
| Mode SS | |||
|---|---|---|---|
| Quadrant | BADHDUFLAG | Total packets | Discarded packets |
| A | 0 | 120 | 0 |
| B | 0 | 120 | 0 |
| C | 0 | 120 | 0 |
| D | 0 | 120 | 0 |
| Mode M0 | |||
|---|---|---|---|
| Quadrant | BADHDUFLAG | Total packets | Discarded packets |
| A | 0 | 12088 | 1 |
| B | 0 | 13141 | 1 |
| C | 0 | 25442 | 1 |
| D | 0 | 15949 | 1 |
| Quadrant | Total seconds | Saturated seconds | Saturation percentage |
|---|---|---|---|
| A | 5952 | 41 | 0.688844% |
| B | 5953 | 114 | 1.915001% |
| C | 5953 | 1408 | 23.651940% |
| D | 5953 | 301 | 5.056274% |
Noise dominated data is calculated using 1-second bins in cleaned event files. If a bin has >2000 counts, and if more than 50% of those come from <1% of pixels, then it is considered to be noise-dominated and hence unusable.
| Quadrant | # 1 sec bins | Bins with >0 counts | Bins with >2000 counts | High rate bins dominated by noise | Noise dominated (total time) | Noise dominated (detector-on time) | Marked lightcurve |
|---|---|---|---|---|---|---|---|
| A | 7142 | 5953 | 2 | 2 | 0.03% | 0.03% | 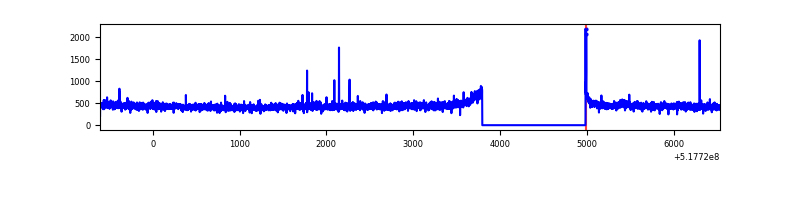 |
| B | 7143 | 5954 | 31 | 31 | 0.43% | 0.52% | 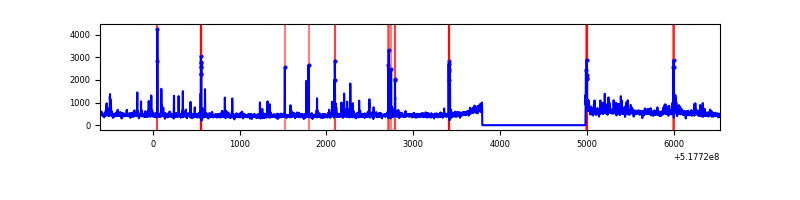 |
| C | 7143 | 5954 | 1112 | 1112 | 15.57% | 18.68% | 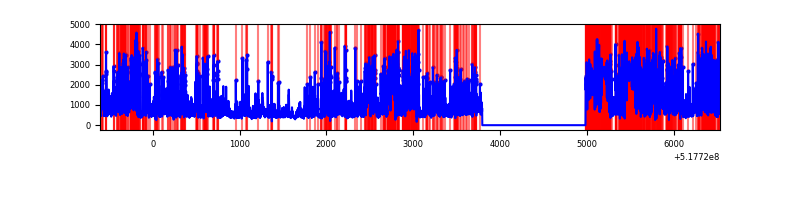 |
| D | 7143 | 5954 | 254 | 254 | 3.56% | 4.27% | 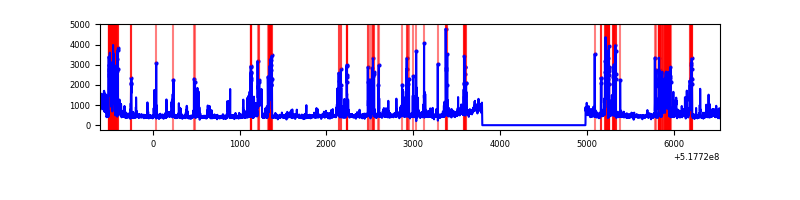 |
Top three noisy pixels from each quadrant. If the there are fewer than three noisy pixels in the level2.evt file, extra rows are filled as -1
| Pixel properties | Quadrant properties | ||||||
|---|---|---|---|---|---|---|---|
| Quadrant | DetID | PixID | Counts | Sigma | Mean | Median | Sigma |
| A | 3 | 128 | 31508 | 188.56 | 659 | 642 | 163.7 |
| A | 3 | 137 | 7886 | 44.25 | 659 | 642 | 163.7 |
| A | 13 | 254 | 6614 | 36.48 | 659 | 642 | 163.7 |
| B | 4 | 80 | 165936 | 1201.54 | 651 | 629 | 137.6 |
| B | 5 | 185 | 63608 | 457.76 | 651 | 629 | 137.6 |
| B | 0 | 213 | 56048 | 402.81 | 651 | 629 | 137.6 |
| C | 15 | 224 | 3977366 | 25619.3 | 574 | 569 | 155.2 |
| C | 12 | 254 | 582058 | 3746.06 | 574 | 569 | 155.2 |
| C | 14 | 254 | 189819 | 1219.18 | 574 | 569 | 155.2 |
| D | 8 | 160 | 872616 | 4980.75 | 630 | 601 | 175.1 |
| D | 3 | 12 | 215859 | 1229.5 | 630 | 601 | 175.1 |
| D | 2 | 31 | 108429 | 615.89 | 630 | 601 | 175.1 |
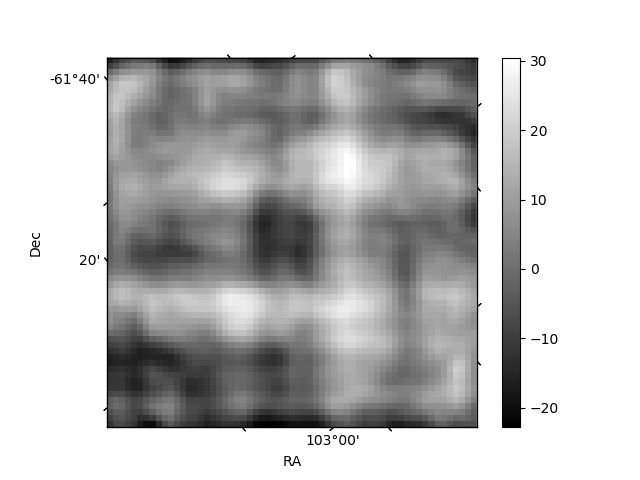
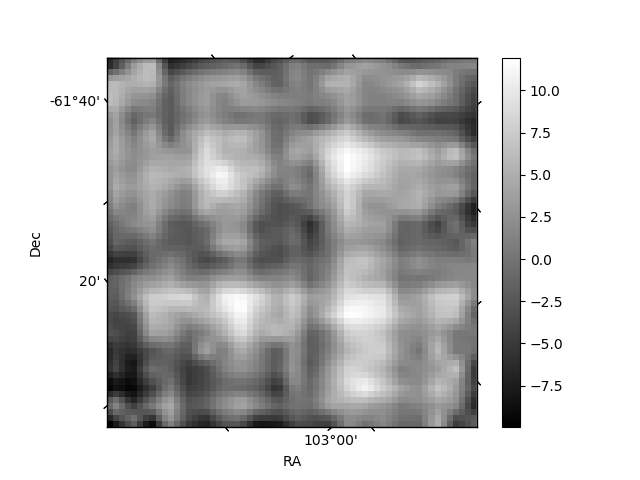
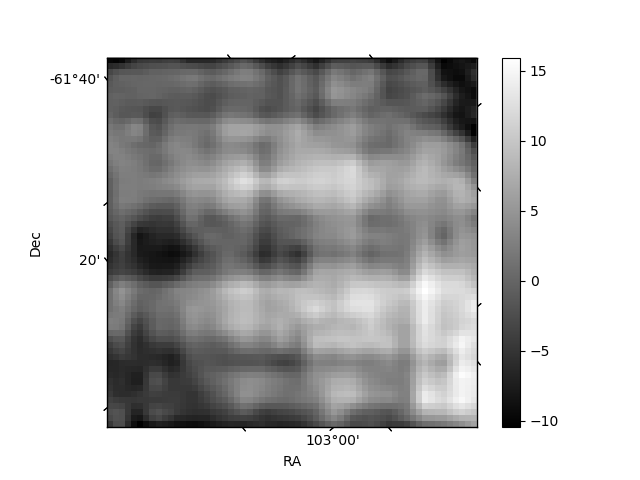
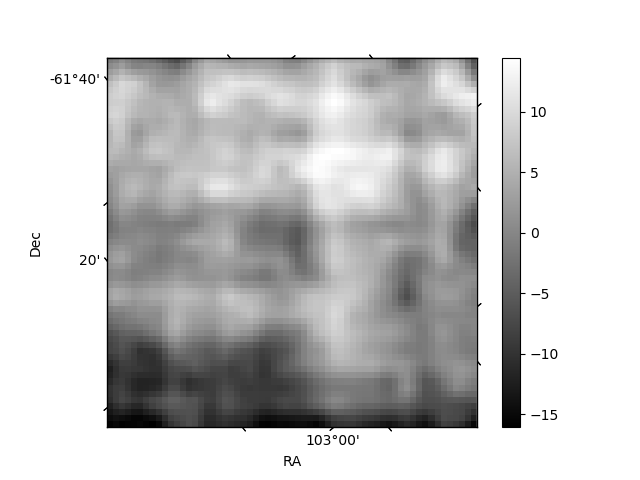
Histogram calculated using DETX and DETY for each event in the final _common_clean file
| Quadrant A | 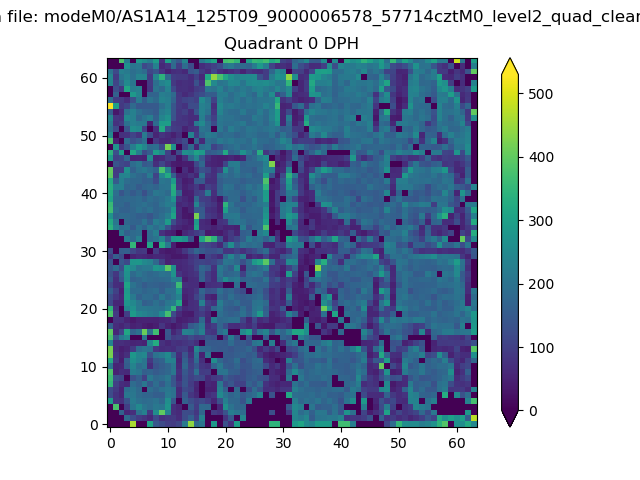 |
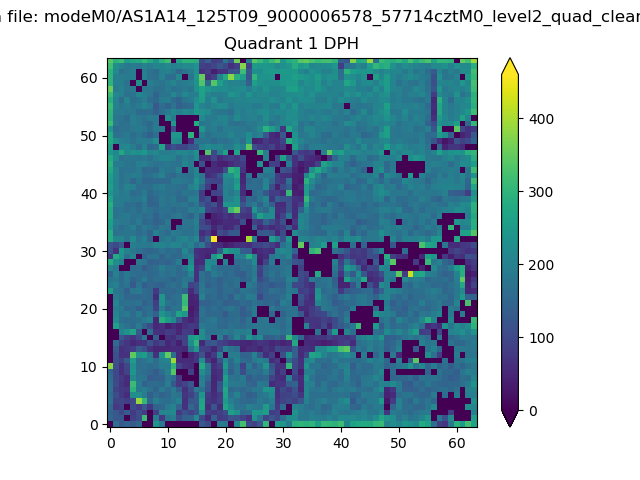 |
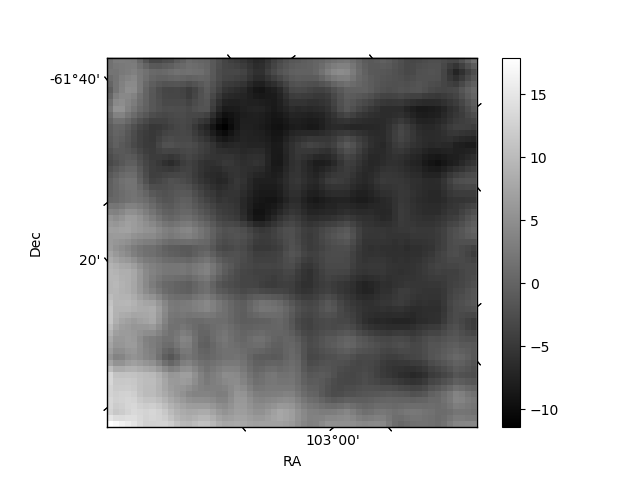
Quadrant B |
|---|---|---|---|
| Quadrant D | 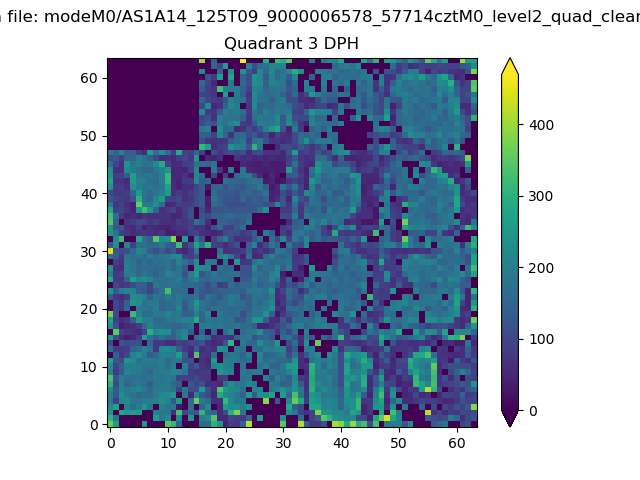 |
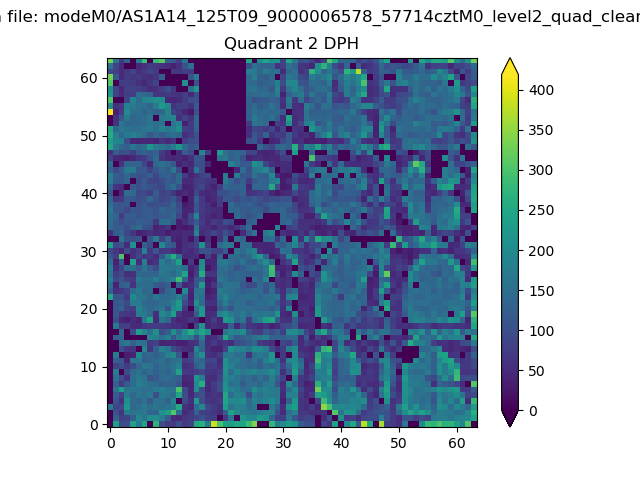 |
Quadrant C |
| Plot type | Count rate plots | Images |
|---|---|---|
| Comparison with Poisson distribution Blue bars denote a histogram of data divided into 1 sec bins. Red curve is a Poisson curve with rate = median count rate of data. |
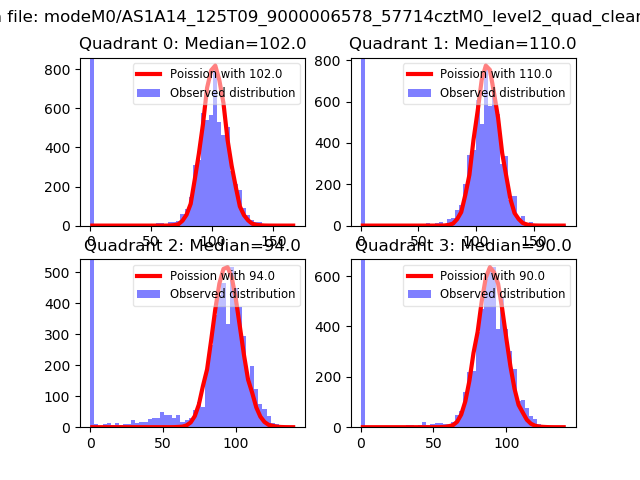 |
 |
| Quadrant-wise count rates Data is divided into 100 sec bins |
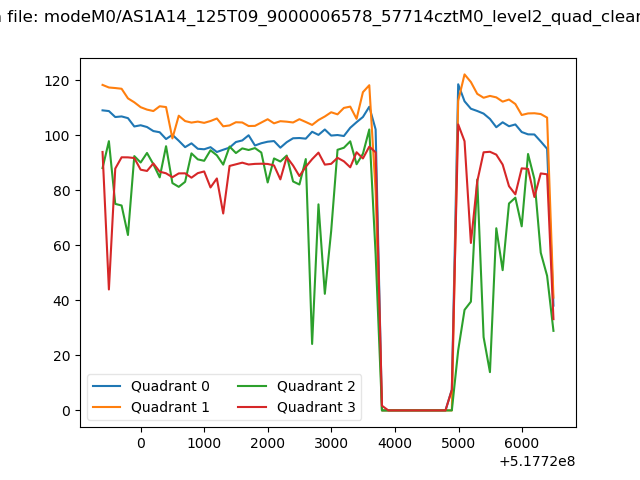 |
|
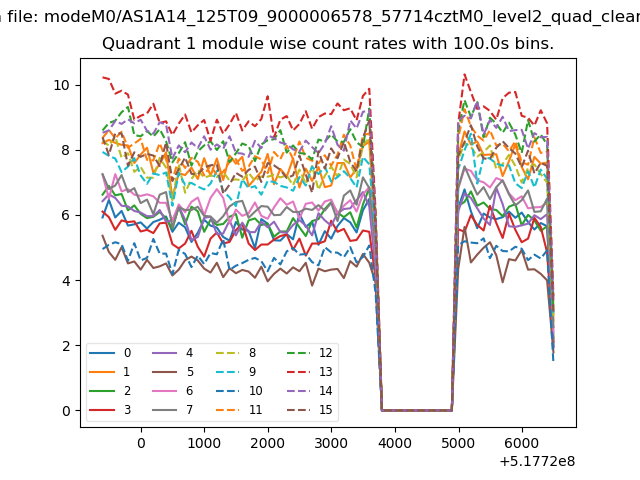
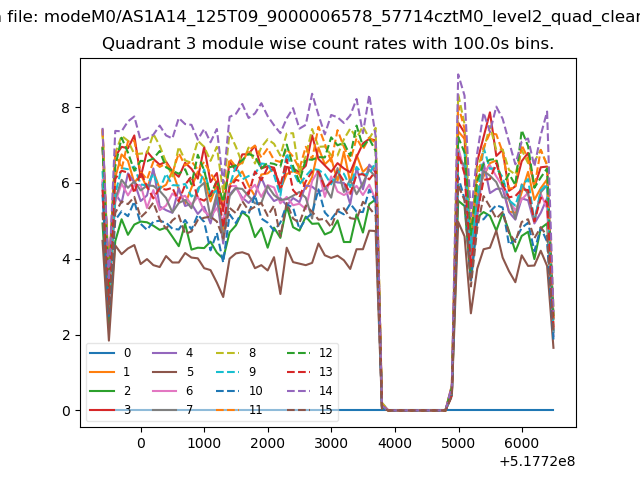
| Module-wise count rates for Quadrant A Data is divided into 100 sec bins |
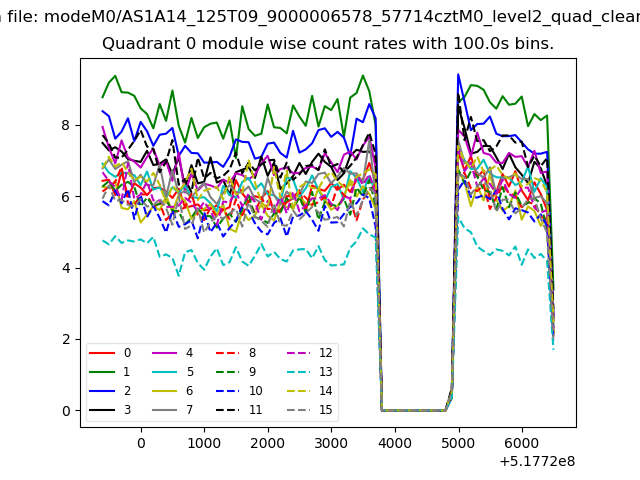 |
 |
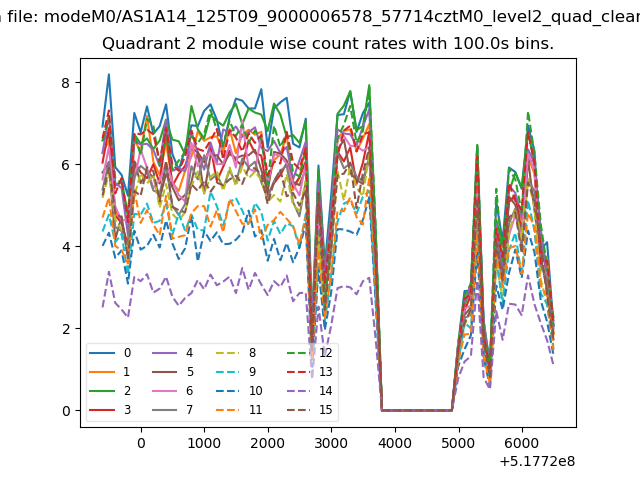
| Module-wise count rates for Quadrant B Data is divided into 100 sec bins |
 |
 |
| Module-wise count rates for Quadrant C Data is divided into 100 sec bins |
 |
 |
| Module-wise count rates for Quadrant D Data is divided into 100 sec bins |
 |
 |
| Parameter | Plot |
|---|---|
| CZT HV Monitor | 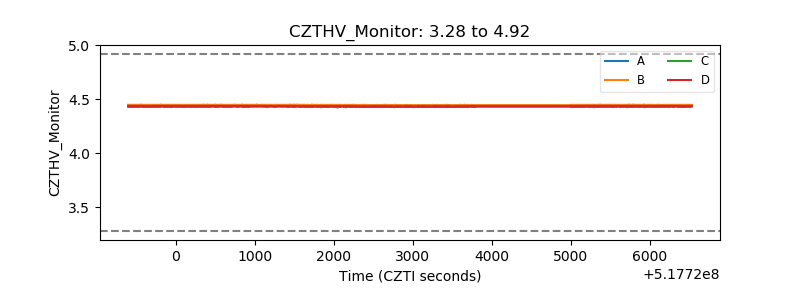 |
| D_VDD | 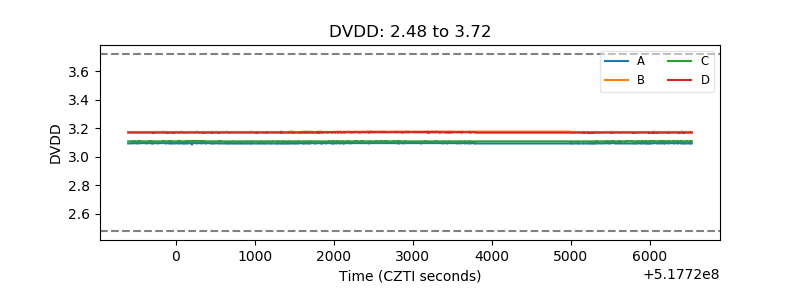 |
| Temperature 1 | 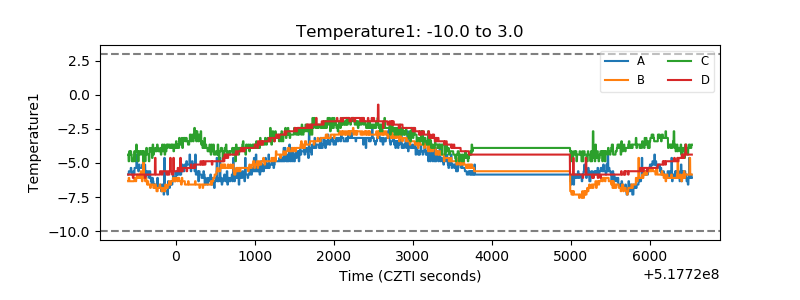 |
| Veto HV Monitor | 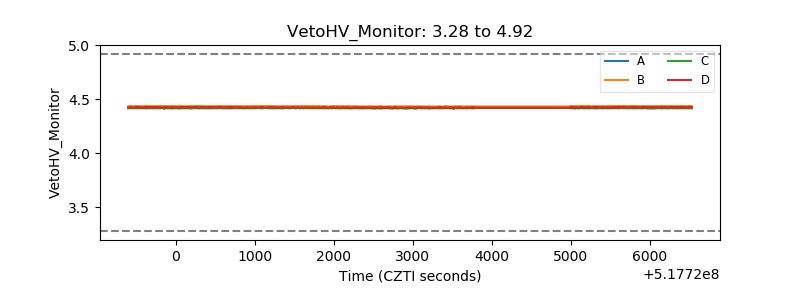 |
| Veto LLD | 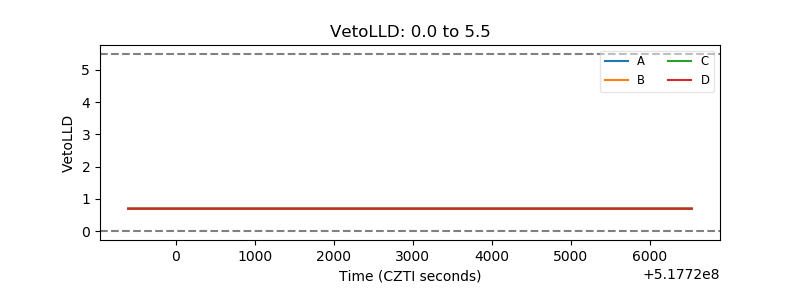 |
| Alpha Counter | 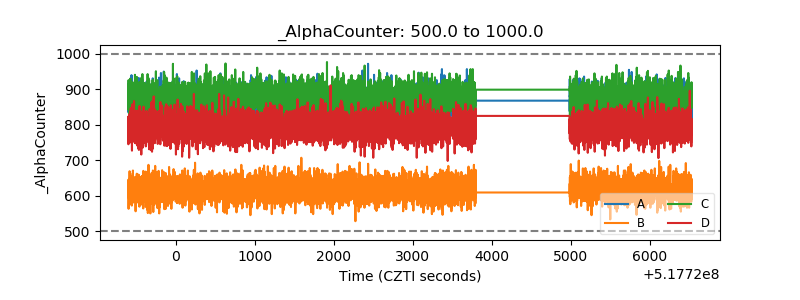 |
| _CPM_Rate | 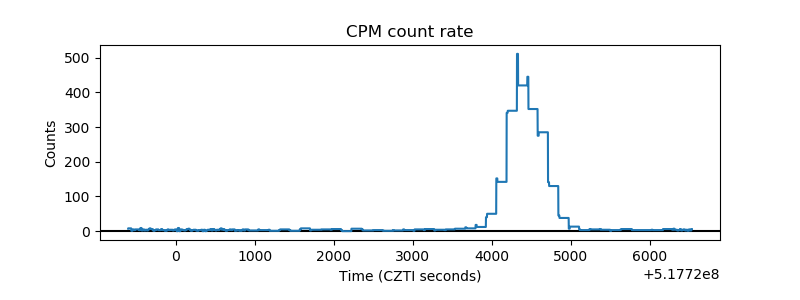 |
| CZT Counter | 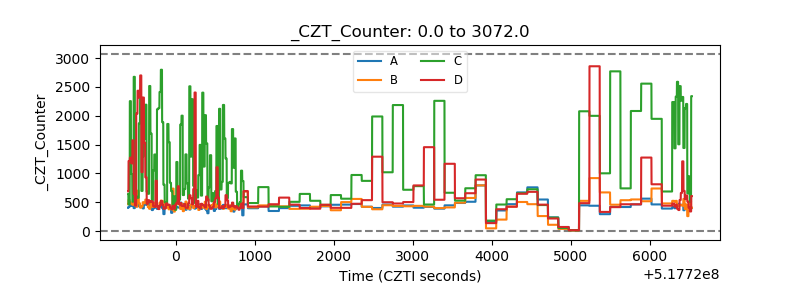 |
| +2.5 Volts monitor |  |
| +5 Volts monitor | 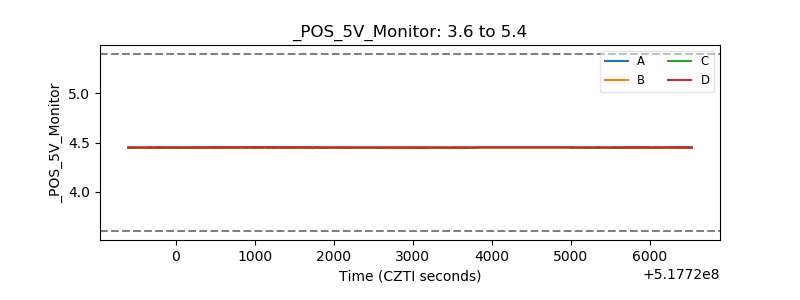 |
| _ROLL_ROT | 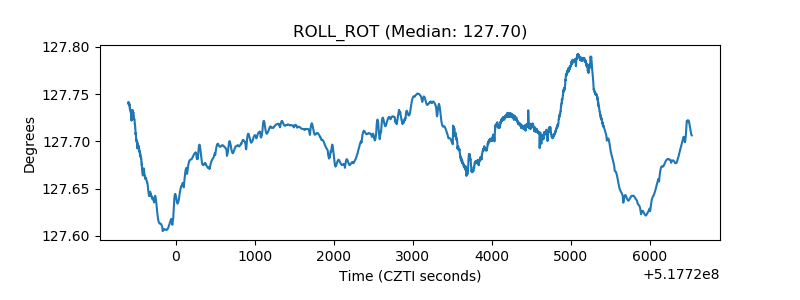 |
| _Roll_DEC | 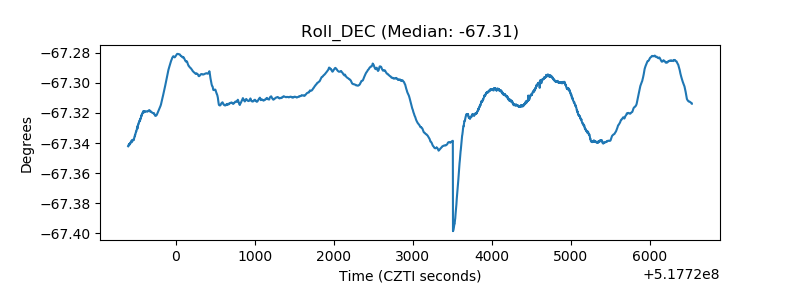 |
| _Roll_RA | 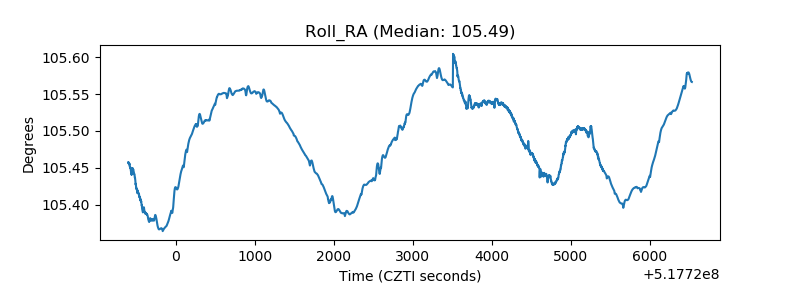 |
| Veto Counter | 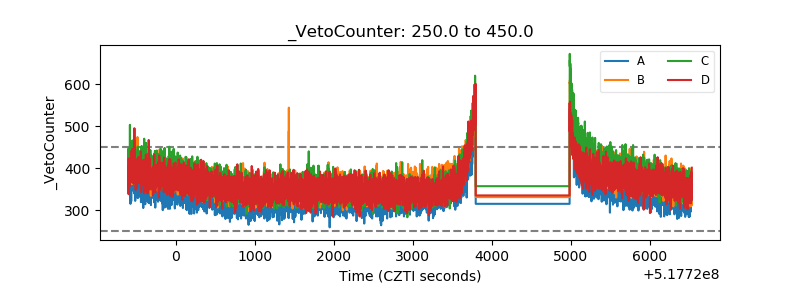 |