| Param | Original file | Final file |
|---|---|---|
| Filename | modeM0/AS1A14_125T09_9000006578_57715cztM0_level2.fits | modeM0/AS1A14_125T09_9000006578_57715cztM0_level2_quad_clean.evt |
| Size (bytes) | 534,654,720 | 84,026,880 |
| Size | 509.9 MB | 80.1 MB |
| Events in quadrant A | 2,623,821 | 595,145 |
| Events in quadrant B | 5,001,983 | 533,274 |
| Events in quadrant C | 6,365,851 | 500,194 |
| Events in quadrant D | 5,328,580 | 492,435 |
| Mode M9 | |||
|---|---|---|---|
| Quadrant | BADHDUFLAG | Total packets | Discarded packets |
| A | 0 | 10 | 0 |
| B | 0 | 10 | 0 |
| C | 0 | 10 | 0 |
| D | 0 | 10 | 0 |
| Mode SS | |||
|---|---|---|---|
| Quadrant | BADHDUFLAG | Total packets | Discarded packets |
| A | 0 | 124 | 0 |
| B | 0 | 124 | 0 |
| C | 0 | 124 | 0 |
| D | 0 | 124 | 0 |
| Mode M0 | |||
|---|---|---|---|
| Quadrant | BADHDUFLAG | Total packets | Discarded packets |
| A | 0 | 12298 | 1 |
| B | 0 | 18885 | 1 |
| C | 0 | 23157 | 1 |
| D | 0 | 19957 | 3 |
| Quadrant | Total seconds | Saturated seconds | Saturation percentage |
|---|---|---|---|
| A | 6057 | 25 | 0.412746% |
| B | 6057 | 1139 | 18.804689% |
| C | 6057 | 1049 | 17.318805% |
| D | 6056 | 632 | 10.435931% |
Noise dominated data is calculated using 1-second bins in cleaned event files. If a bin has >2000 counts, and if more than 50% of those come from <1% of pixels, then it is considered to be noise-dominated and hence unusable.
| Quadrant | # 1 sec bins | Bins with >0 counts | Bins with >2000 counts | High rate bins dominated by noise | Noise dominated (total time) | Noise dominated (detector-on time) | Marked lightcurve |
|---|---|---|---|---|---|---|---|
| A | 7087 | 6058 | 0 | 0 | 0.00% | 0.00% | 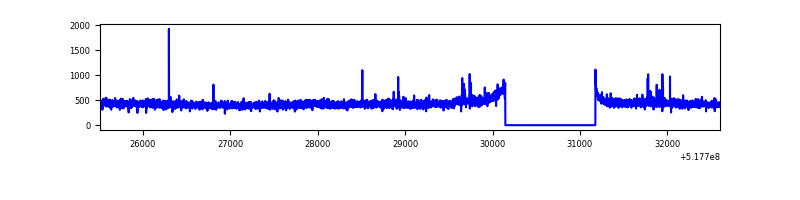 |
| B | 7087 | 6058 | 997 | 997 | 14.07% | 16.46% | 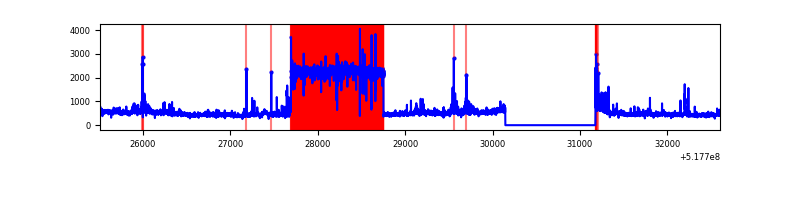 |
| C | 7087 | 6057 | 785 | 785 | 11.08% | 12.96% | 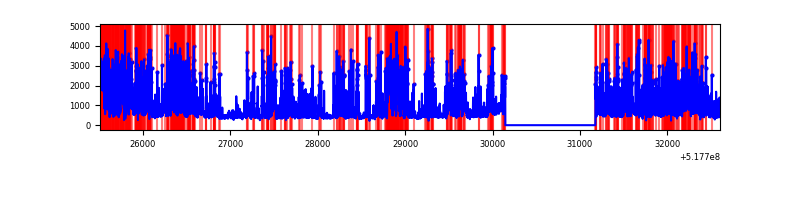 |
| D | 7086 | 6057 | 570 | 570 | 8.04% | 9.41% | 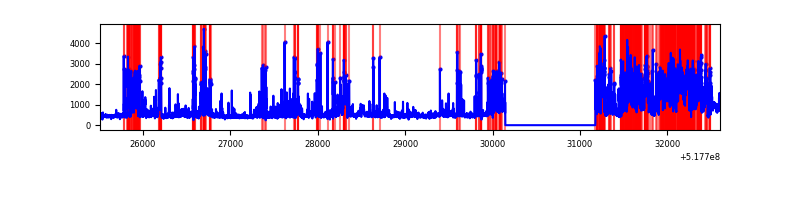 |
Top three noisy pixels from each quadrant. If the there are fewer than three noisy pixels in the level2.evt file, extra rows are filled as -1
| Pixel properties | Quadrant properties | ||||||
|---|---|---|---|---|---|---|---|
| Quadrant | DetID | PixID | Counts | Sigma | Mean | Median | Sigma |
| A | 3 | 128 | 43573 | 262.57 | 661 | 644 | 163.5 |
| A | 3 | 245 | 10843 | 62.38 | 661 | 644 | 163.5 |
| A | 3 | 62 | 8118 | 45.71 | 661 | 644 | 163.5 |
| B | 4 | 80 | 2441259 | 19651.59 | 582 | 560 | 124.2 |
| B | 0 | 155 | 103731 | 830.69 | 582 | 560 | 124.2 |
| B | 5 | 185 | 43177 | 343.14 | 582 | 560 | 124.2 |
| C | 15 | 224 | 3430840 | 20901.3 | 603 | 596 | 164.1 |
| C | 12 | 254 | 288540 | 1754.51 | 603 | 596 | 164.1 |
| C | 6 | 223 | 150998 | 916.44 | 603 | 596 | 164.1 |
| D | 8 | 160 | 1949526 | 11079.35 | 622 | 593 | 175.9 |
| D | 3 | 12 | 464890 | 2639.45 | 622 | 593 | 175.9 |
| D | 8 | 240 | 144163 | 816.17 | 622 | 593 | 175.9 |
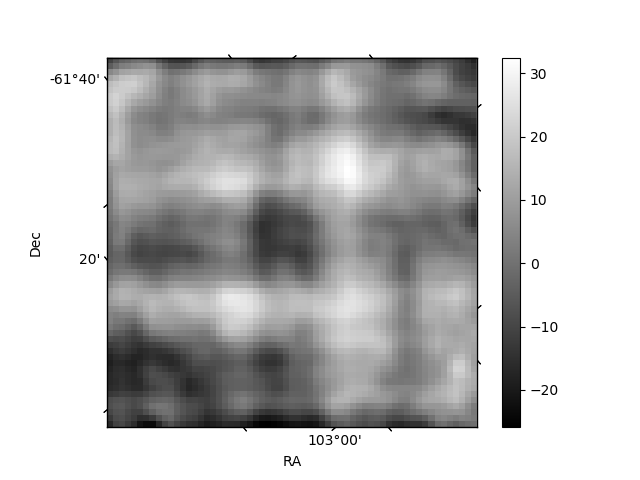
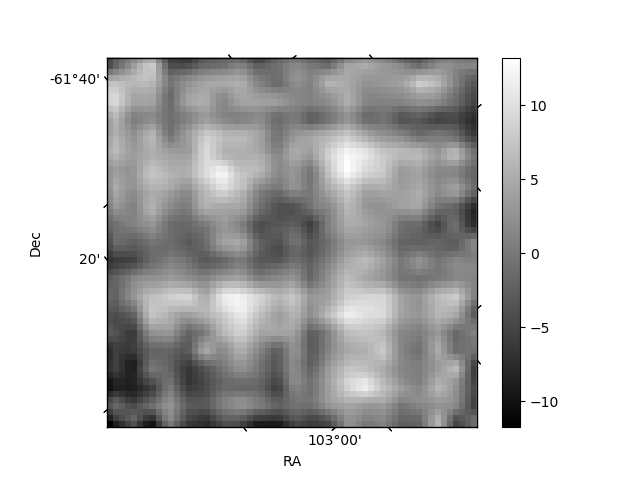
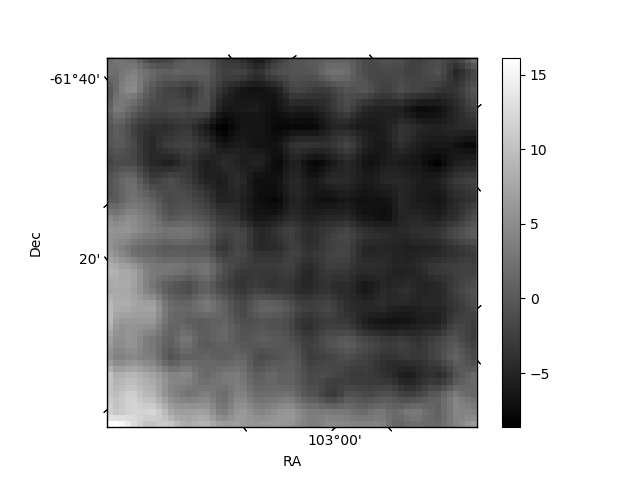
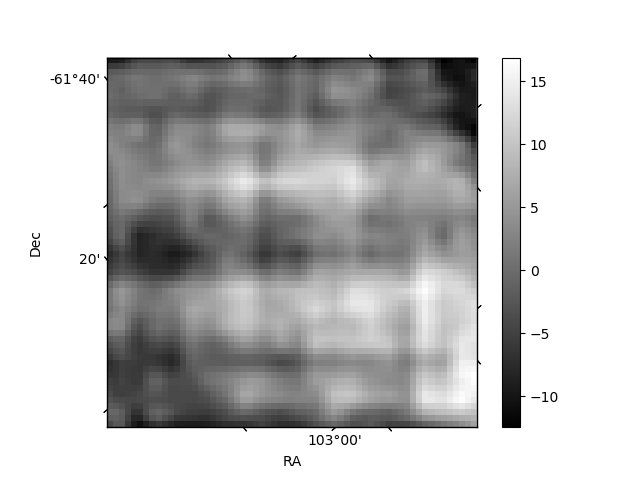
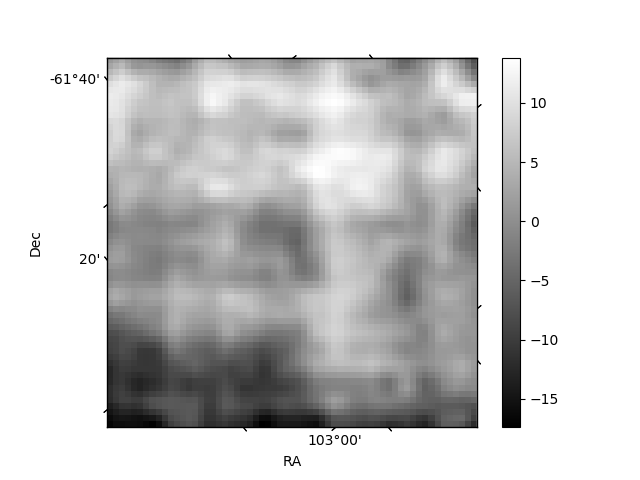
Histogram calculated using DETX and DETY for each event in the final _common_clean file
| Quadrant A | 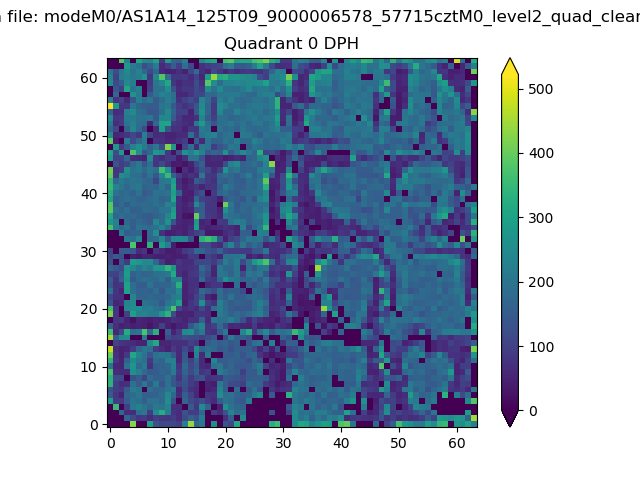 |
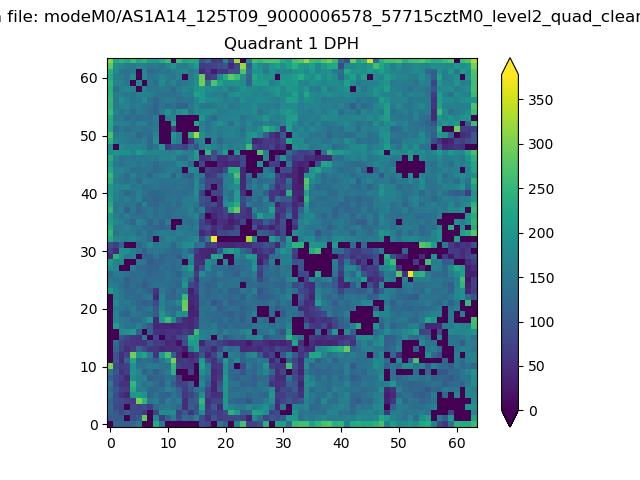 |
Quadrant B |
|---|---|---|---|
| Quadrant D | 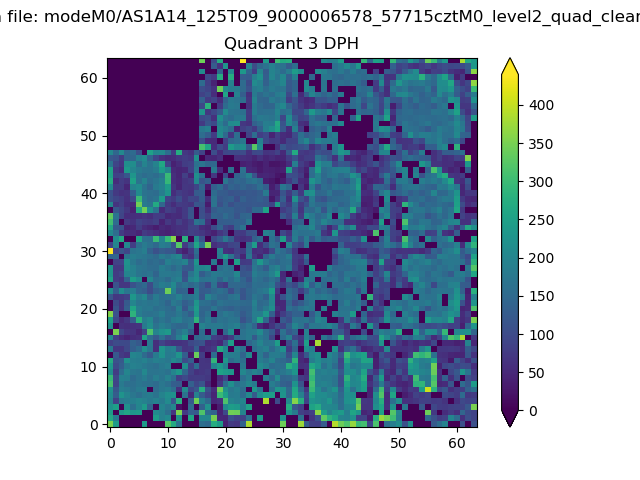 |
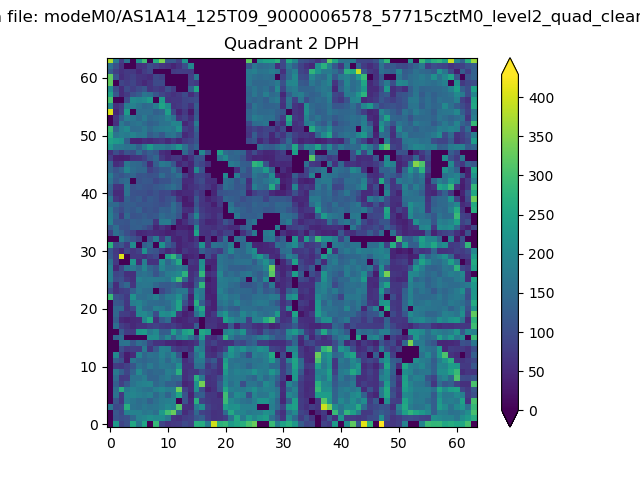 |
Quadrant C |
| Plot type | Count rate plots | Images |
|---|---|---|
| Comparison with Poisson distribution Blue bars denote a histogram of data divided into 1 sec bins. Red curve is a Poisson curve with rate = median count rate of data. |
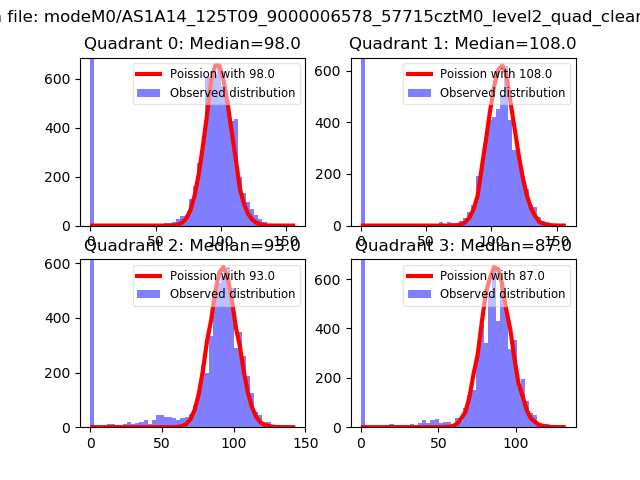 |
 |
| Quadrant-wise count rates Data is divided into 100 sec bins |
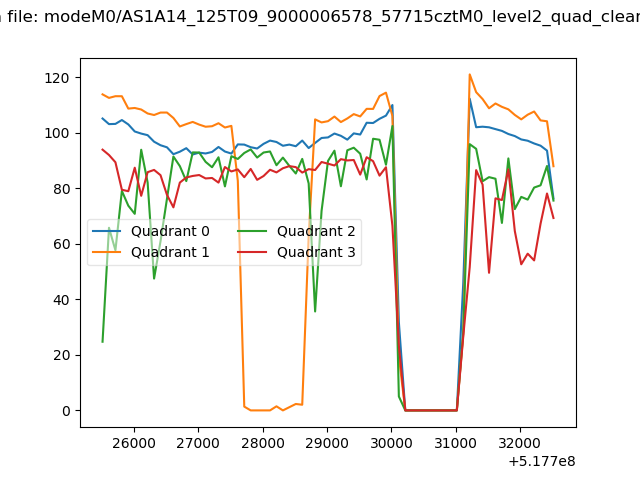 |
|
| Module-wise count rates for Quadrant A Data is divided into 100 sec bins |
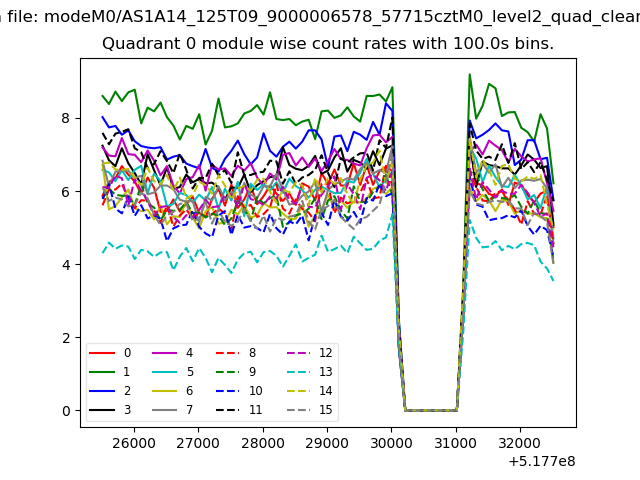 |
 |
| Module-wise count rates for Quadrant B Data is divided into 100 sec bins |
 |
 |
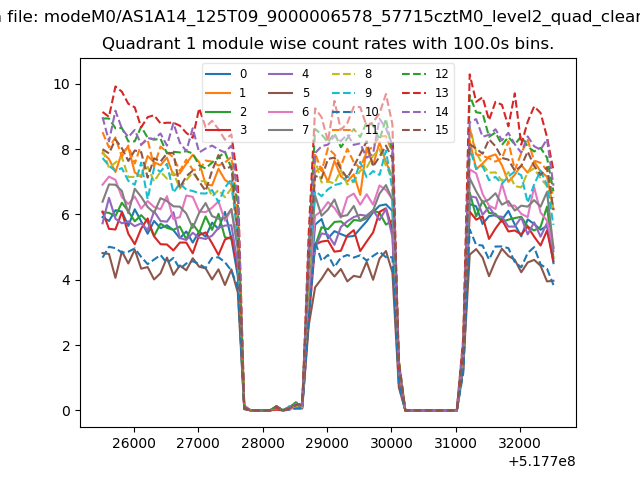
| Module-wise count rates for Quadrant C Data is divided into 100 sec bins |
 |
 |
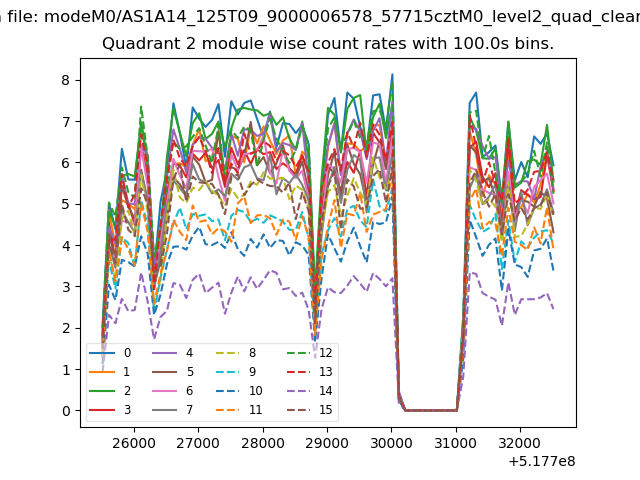
| Module-wise count rates for Quadrant D Data is divided into 100 sec bins |
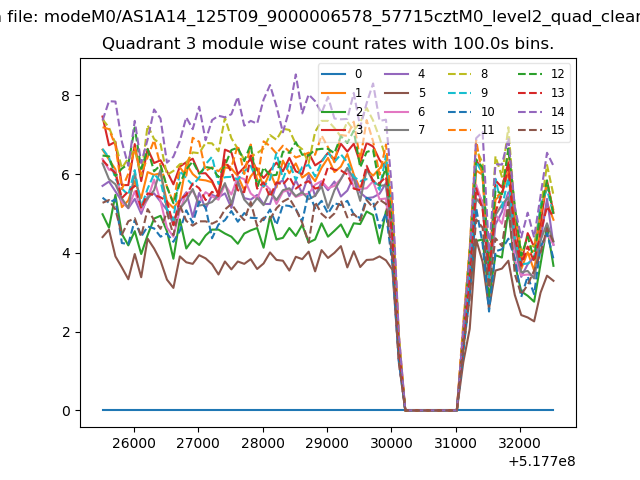 |
 |
| Parameter | Plot |
|---|---|
| CZT HV Monitor |  |
| D_VDD | 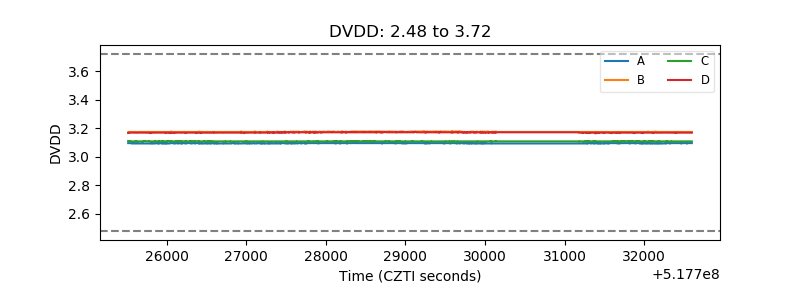 |
| Temperature 1 | 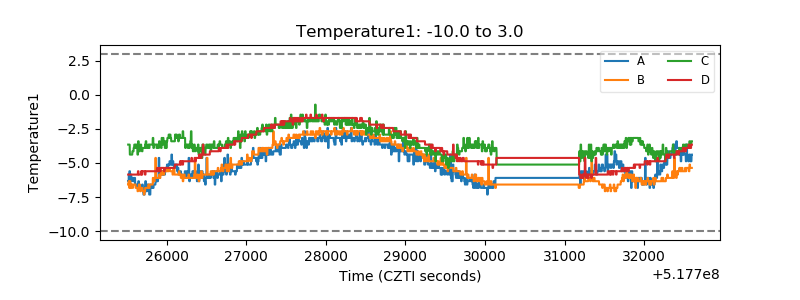 |
| Veto HV Monitor | 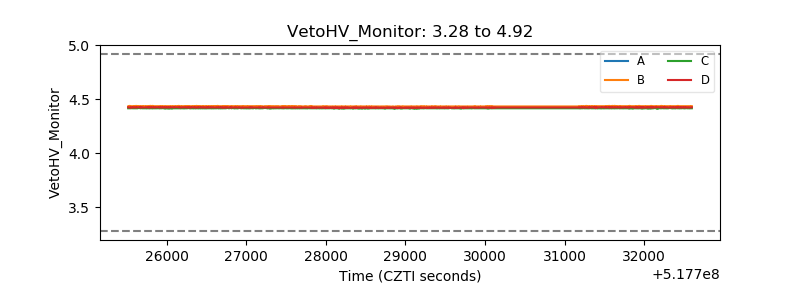 |
| Veto LLD | 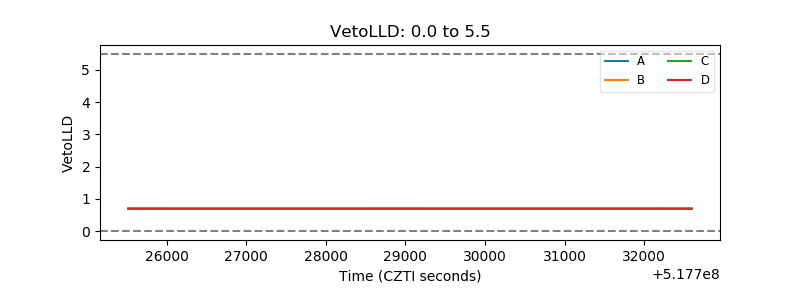 |
| Alpha Counter | 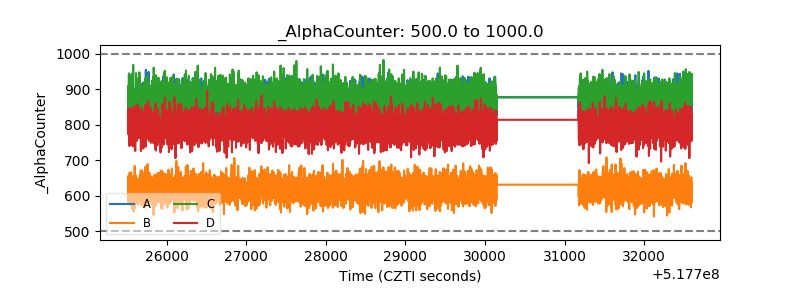 |
| _CPM_Rate | 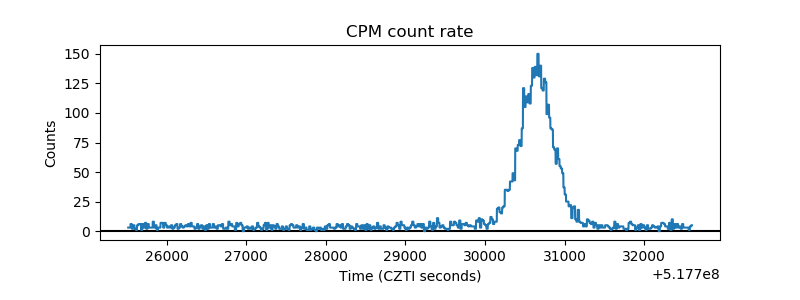 |
| CZT Counter | 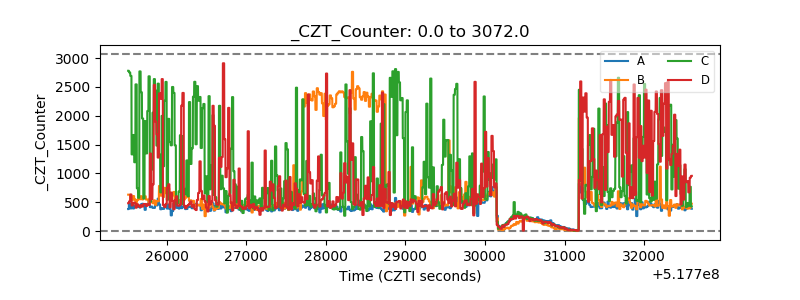 |
| +2.5 Volts monitor |  |
| +5 Volts monitor |  |
| _ROLL_ROT | 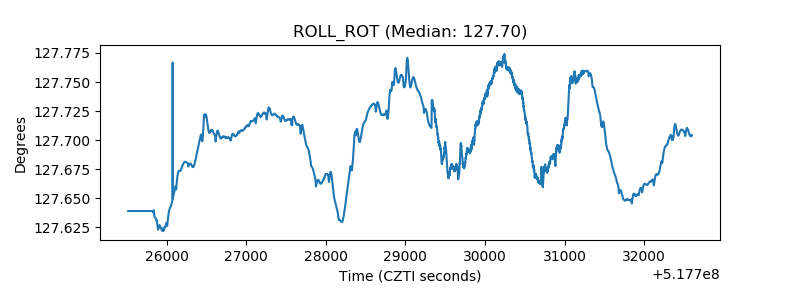 |
| _Roll_DEC | 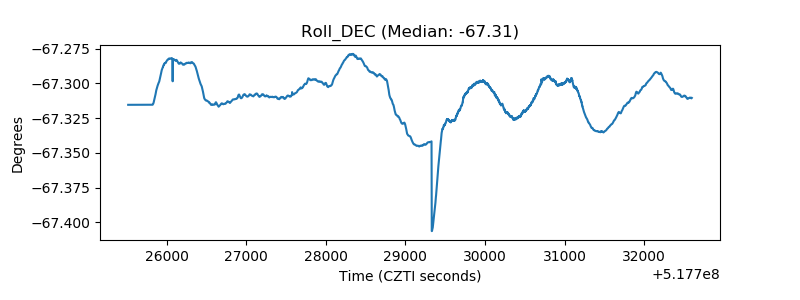 |
| _Roll_RA | 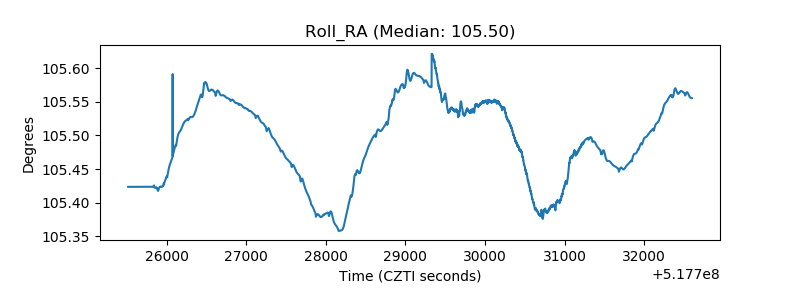 |
| Veto Counter | 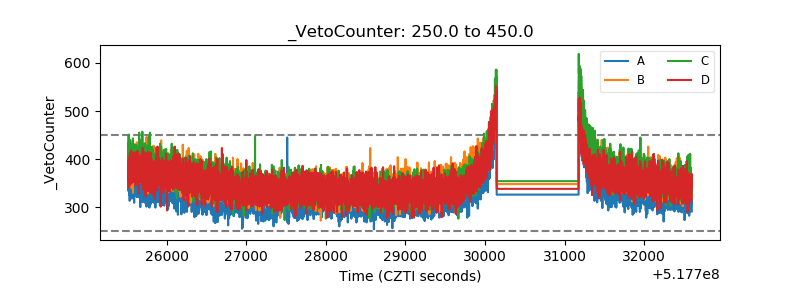 |