| Param | Original file | Final file |
|---|---|---|
| Filename | modeM0/AS1A14_125T09_9000006578_57716cztM0_level2.fits | modeM0/AS1A14_125T09_9000006578_57716cztM0_level2_quad_clean.evt |
| Size (bytes) | 583,845,120 | 96,287,040 |
| Size | 556.8 MB | 91.8 MB |
| Events in quadrant A | 3,071,340 | 663,769 |
| Events in quadrant B | 3,418,558 | 706,850 |
| Events in quadrant C | 8,773,814 | 498,187 |
| Events in quadrant D | 5,810,022 | 563,235 |
| Mode M9 | |||
|---|---|---|---|
| Quadrant | BADHDUFLAG | Total packets | Discarded packets |
| A | 0 | 5 | 0 |
| B | 0 | 5 | 0 |
| C | 0 | 5 | 0 |
| D | 0 | 5 | 0 |
| Mode SS | |||
|---|---|---|---|
| Quadrant | BADHDUFLAG | Total packets | Discarded packets |
| A | 0 | 142 | 0 |
| B | 0 | 142 | 0 |
| C | 0 | 142 | 0 |
| D | 0 | 142 | 0 |
| Mode M0 | |||
|---|---|---|---|
| Quadrant | BADHDUFLAG | Total packets | Discarded packets |
| A | 0 | 14298 | 1 |
| B | 0 | 14842 | 1 |
| C | 0 | 30917 | 4 |
| D | 0 | 21967 | 1 |
| Quadrant | Total seconds | Saturated seconds | Saturation percentage |
|---|---|---|---|
| A | 6931 | 164 | 2.366181% |
| B | 6931 | 222 | 3.203001% |
| C | 6931 | 1921 | 27.716058% |
| D | 6931 | 700 | 10.099553% |
Noise dominated data is calculated using 1-second bins in cleaned event files. If a bin has >2000 counts, and if more than 50% of those come from <1% of pixels, then it is considered to be noise-dominated and hence unusable.
| Quadrant | # 1 sec bins | Bins with >0 counts | Bins with >2000 counts | High rate bins dominated by noise | Noise dominated (total time) | Noise dominated (detector-on time) | Marked lightcurve |
|---|---|---|---|---|---|---|---|
| A | 7441 | 6931 | 3 | 3 | 0.04% | 0.04% | 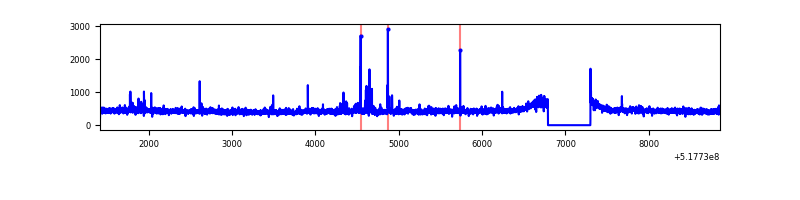 |
| B | 7441 | 6931 | 28 | 28 | 0.38% | 0.40% | 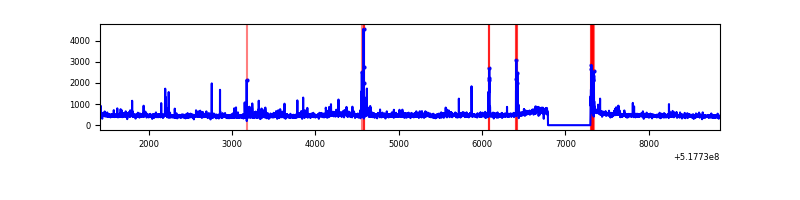 |
| C | 7441 | 6931 | 1408 | 1408 | 18.92% | 20.31% | 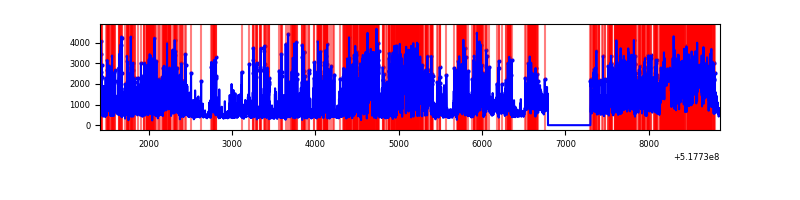 |
| D | 7441 | 6932 | 510 | 510 | 6.85% | 7.36% | 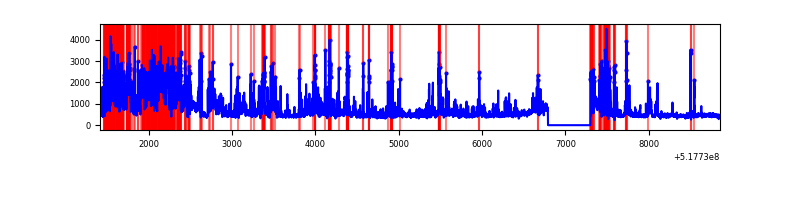 |
Top three noisy pixels from each quadrant. If the there are fewer than three noisy pixels in the level2.evt file, extra rows are filled as -1
| Pixel properties | Quadrant properties | ||||||
|---|---|---|---|---|---|---|---|
| Quadrant | DetID | PixID | Counts | Sigma | Mean | Median | Sigma |
| A | 3 | 128 | 55316 | 291.21 | 760 | 739 | 187.4 |
| A | 13 | 248 | 48720 | 256.02 | 760 | 739 | 187.4 |
| A | 3 | 245 | 14733 | 74.67 | 760 | 739 | 187.4 |
| B | 4 | 80 | 162127 | 1026.47 | 744 | 717 | 157.2 |
| B | 10 | 16 | 77993 | 491.43 | 744 | 717 | 157.2 |
| B | 0 | 155 | 56511 | 354.82 | 744 | 717 | 157.2 |
| C | 15 | 224 | 4824575 | 27044.27 | 660 | 653 | 178.4 |
| C | 12 | 254 | 938904 | 5260.1 | 660 | 653 | 178.4 |
| C | 6 | 223 | 228911 | 1279.68 | 660 | 653 | 178.4 |
| D | 8 | 160 | 2198623 | 10822.88 | 723 | 690 | 203.1 |
| D | 3 | 224 | 268758 | 1320.0 | 723 | 690 | 203.1 |
| D | 3 | 12 | 206642 | 1014.13 | 723 | 690 | 203.1 |
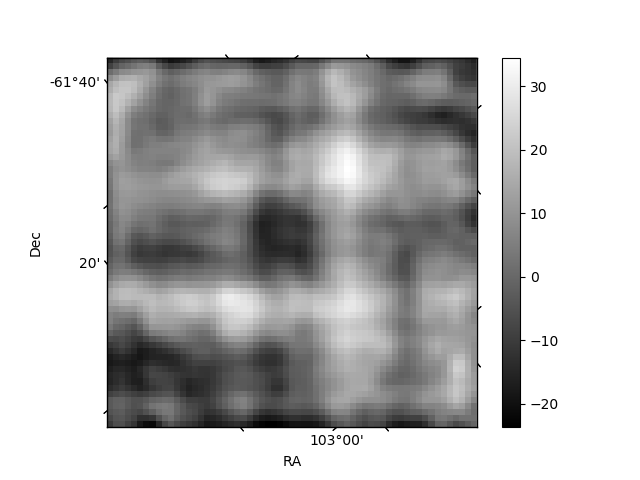
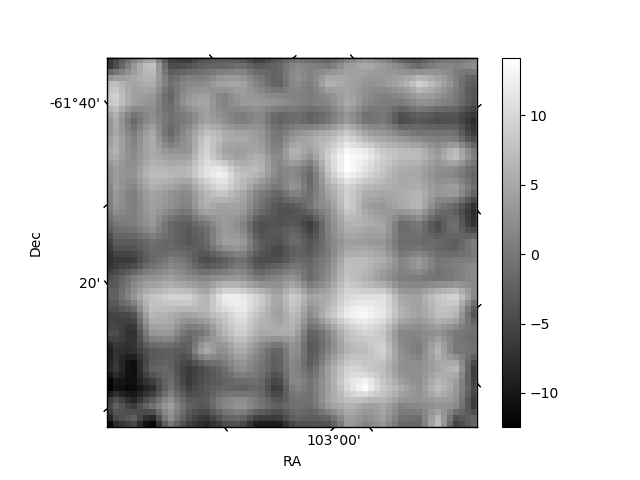
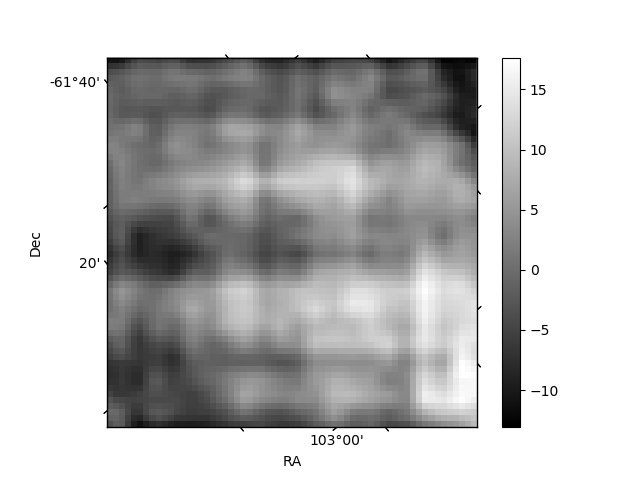
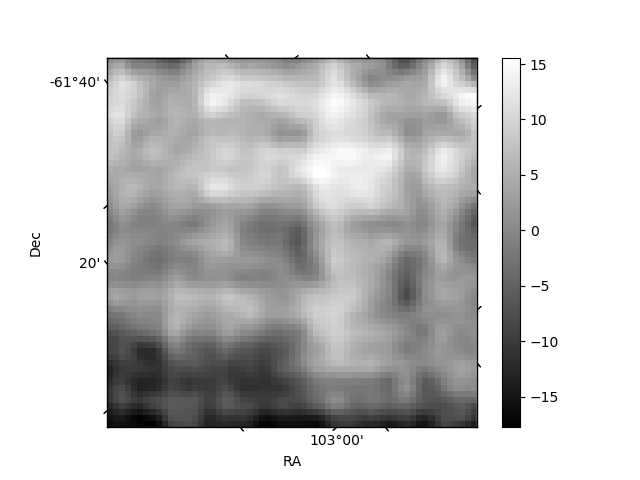
Histogram calculated using DETX and DETY for each event in the final _common_clean file
| Quadrant A | 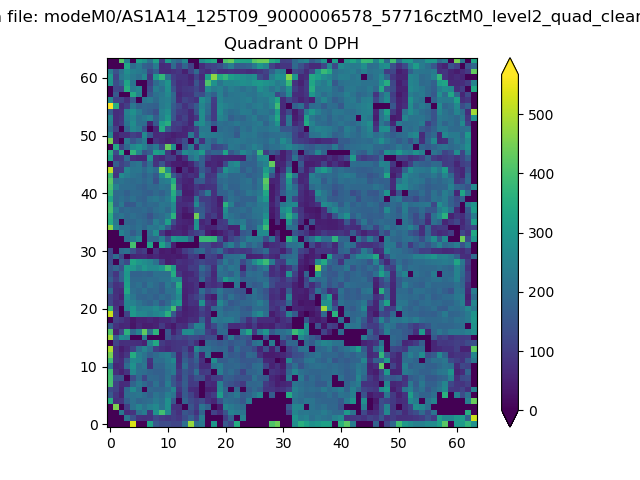 |
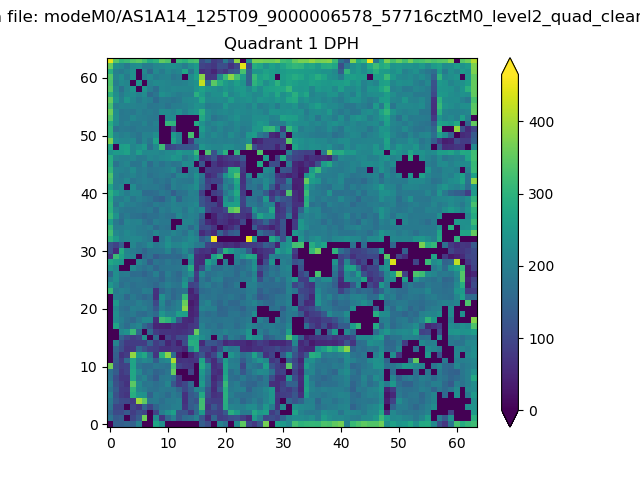 |
Quadrant B |
|---|---|---|---|
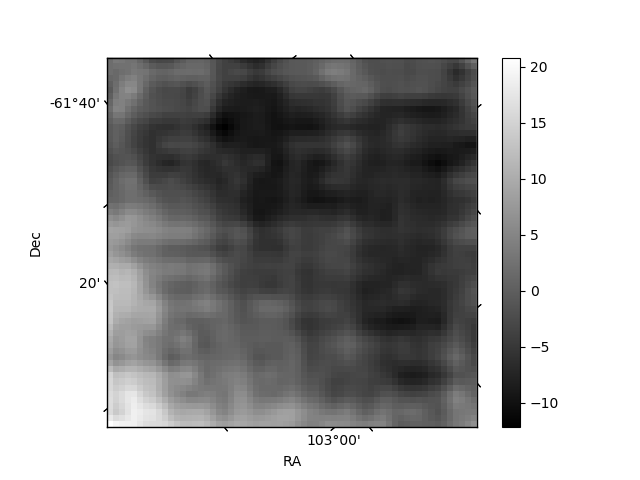
| Quadrant D | 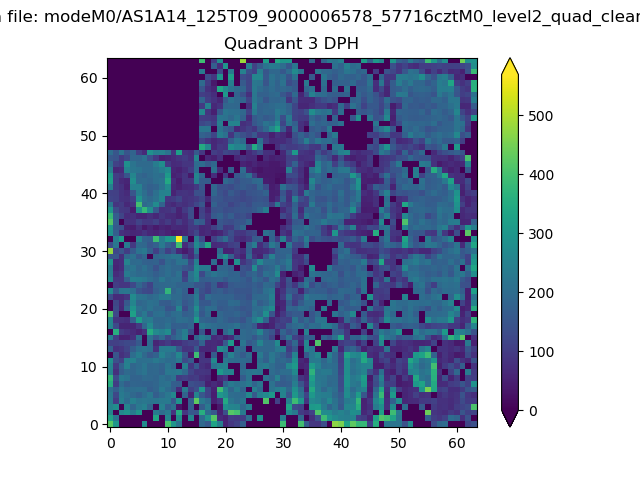 |
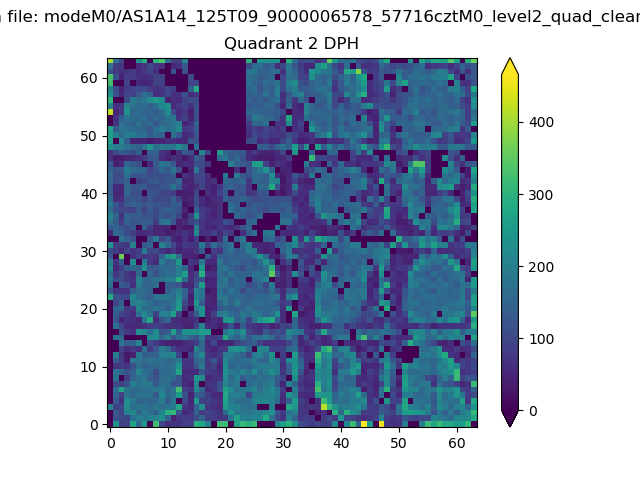 |
Quadrant C |
| Plot type | Count rate plots | Images |
|---|---|---|
| Comparison with Poisson distribution Blue bars denote a histogram of data divided into 1 sec bins. Red curve is a Poisson curve with rate = median count rate of data. |
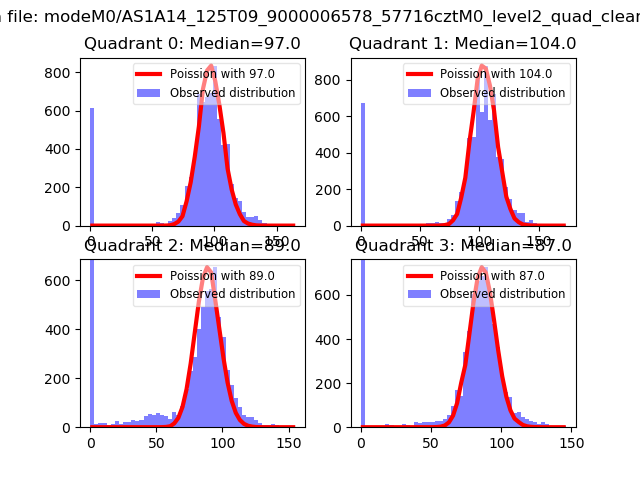 |
 |
| Quadrant-wise count rates Data is divided into 100 sec bins |
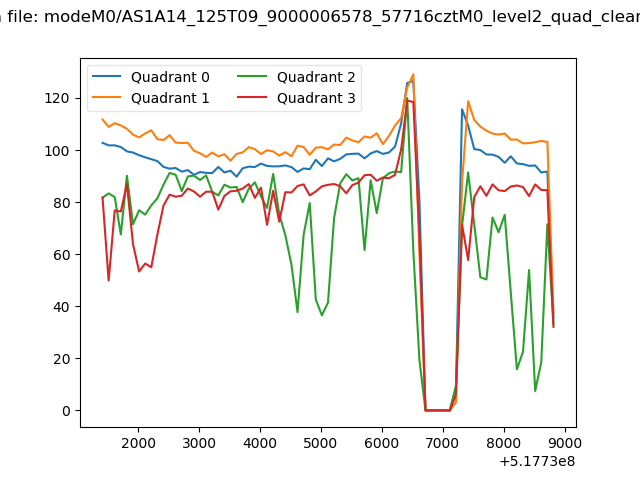 |
|
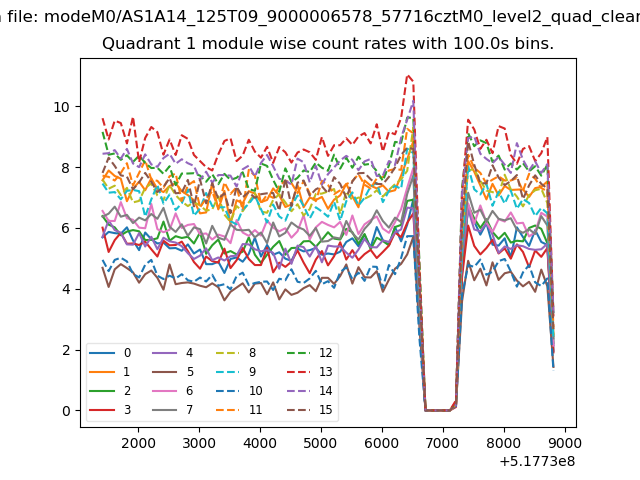
| Module-wise count rates for Quadrant A Data is divided into 100 sec bins |
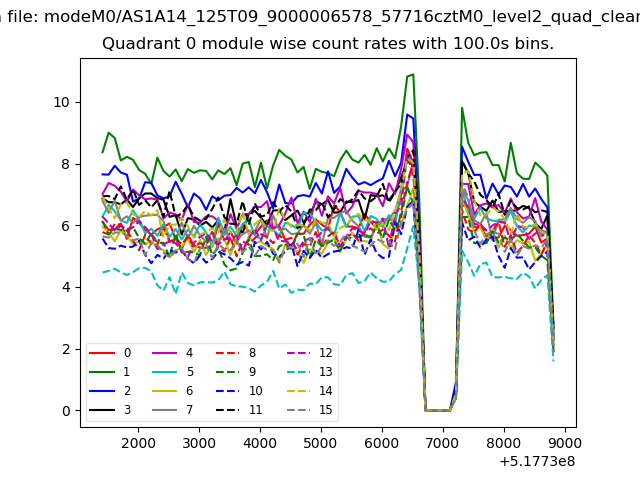 |
 |
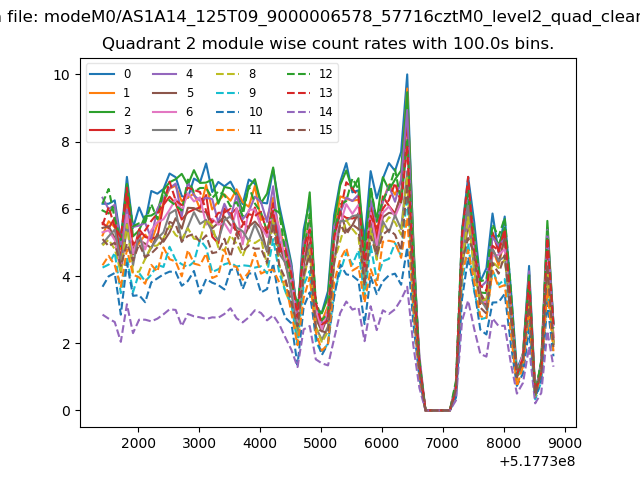
| Module-wise count rates for Quadrant B Data is divided into 100 sec bins |
 |
 |
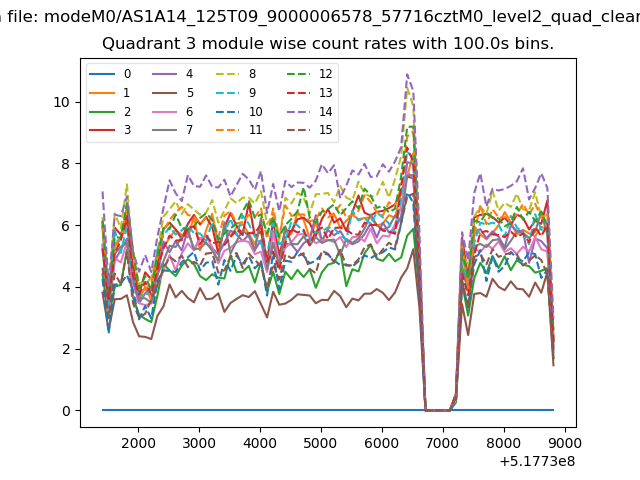
| Module-wise count rates for Quadrant C Data is divided into 100 sec bins |
 |
 |
| Module-wise count rates for Quadrant D Data is divided into 100 sec bins |
 |
 |
| Parameter | Plot |
|---|---|
| CZT HV Monitor |  |
| D_VDD | 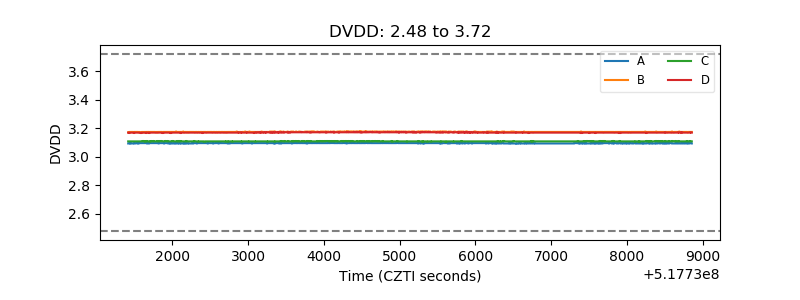 |
| Temperature 1 | 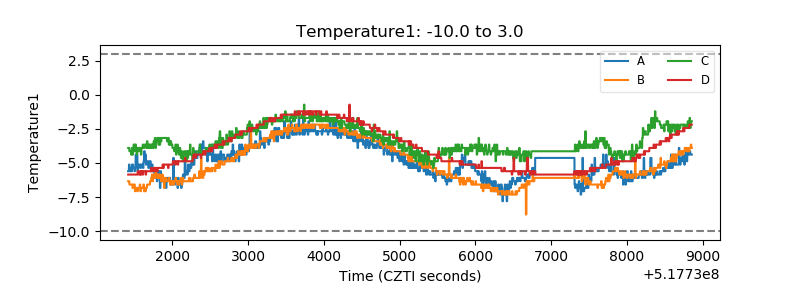 |
| Veto HV Monitor | 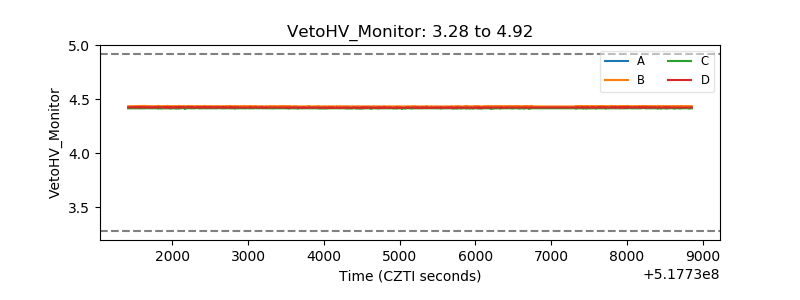 |
| Veto LLD | 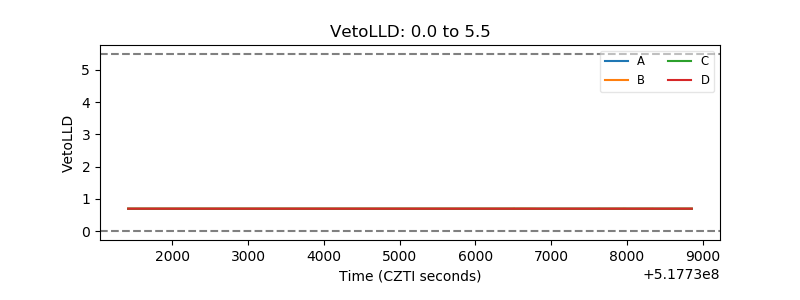 |
| Alpha Counter | 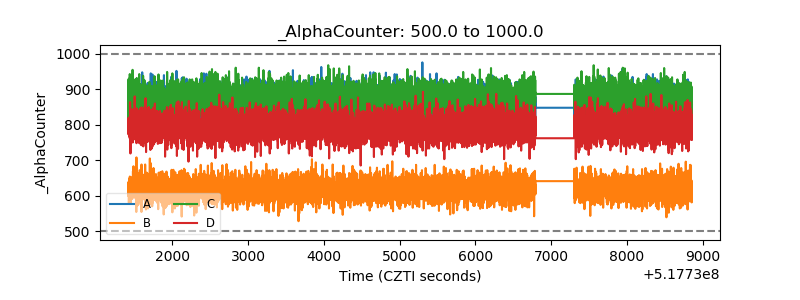 |
| _CPM_Rate | 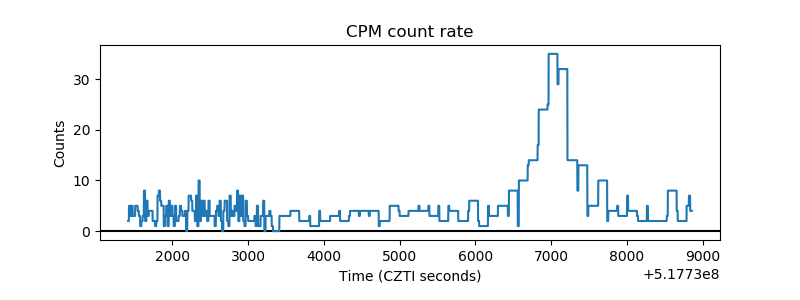 |
| CZT Counter | 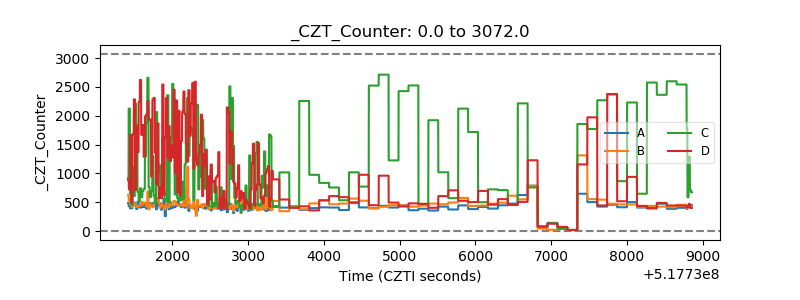 |
| +2.5 Volts monitor |  |
| +5 Volts monitor | 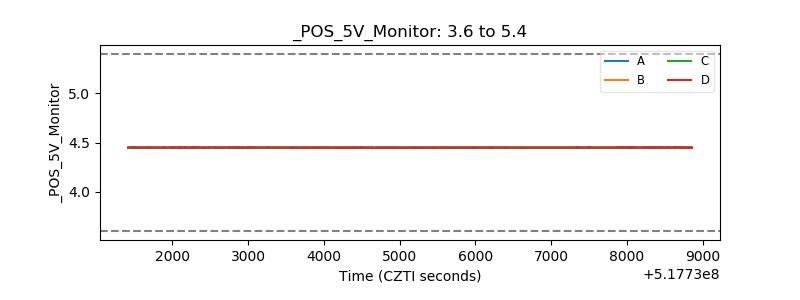 |
| _ROLL_ROT | 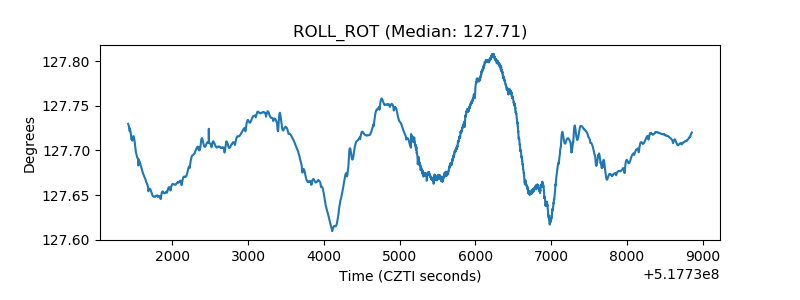 |
| _Roll_DEC | 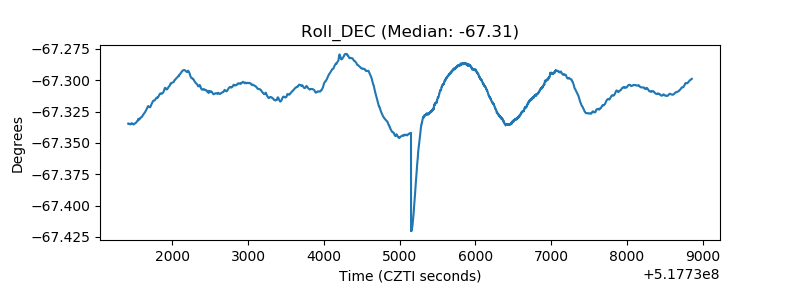 |
| _Roll_RA | 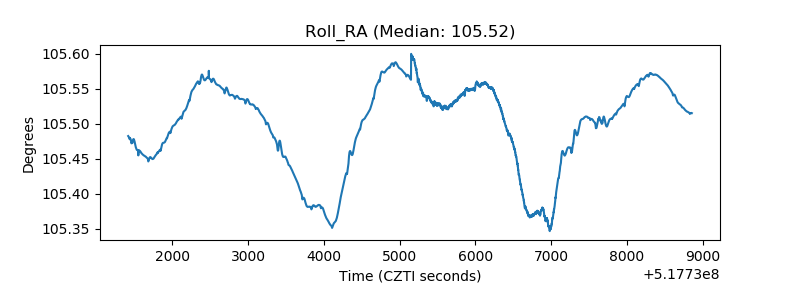 |
| Veto Counter | 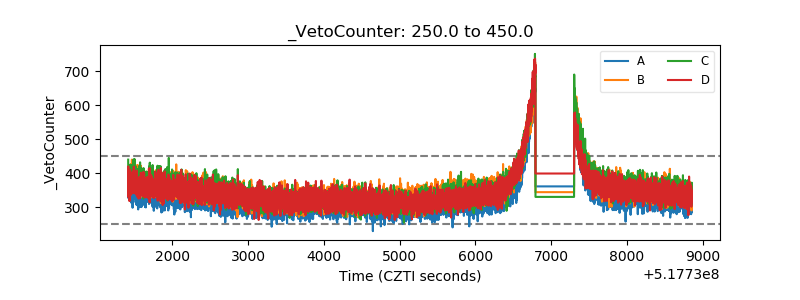 |