| Param | Original file | Final file |
|---|---|---|
| Filename | modeM0/AS1A14_125T09_9000006578_57717cztM0_level2.fits | modeM0/AS1A14_125T09_9000006578_57717cztM0_level2_quad_clean.evt |
| Size (bytes) | 678,127,680 | 100,897,920 |
| Size | 646.7 MB | 96.2 MB |
| Events in quadrant A | 3,233,492 | 707,163 |
| Events in quadrant B | 5,739,100 | 700,483 |
| Events in quadrant C | 8,939,303 | 554,140 |
| Events in quadrant D | 6,619,066 | 579,962 |
| Mode SS | |||
|---|---|---|---|
| Quadrant | BADHDUFLAG | Total packets | Discarded packets |
| A | 0 | 148 | 0 |
| B | 0 | 148 | 0 |
| C | 0 | 148 | 0 |
| D | 0 | 148 | 0 |
| Mode M0 | |||
|---|---|---|---|
| Quadrant | BADHDUFLAG | Total packets | Discarded packets |
| A | 0 | 15167 | 0 |
| B | 0 | 22113 | 1 |
| C | 0 | 31690 | 0 |
| D | 0 | 24692 | 0 |
| Quadrant | Total seconds | Saturated seconds | Saturation percentage |
|---|---|---|---|
| A | 7368 | 31 | 0.420738% |
| B | 7368 | 791 | 10.735613% |
| C | 7368 | 1598 | 21.688382% |
| D | 7368 | 794 | 10.776330% |
Noise dominated data is calculated using 1-second bins in cleaned event files. If a bin has >2000 counts, and if more than 50% of those come from <1% of pixels, then it is considered to be noise-dominated and hence unusable.
| Quadrant | # 1 sec bins | Bins with >0 counts | Bins with >2000 counts | High rate bins dominated by noise | Noise dominated (total time) | Noise dominated (detector-on time) | Marked lightcurve |
|---|---|---|---|---|---|---|---|
| A | 7368 | 7368 | 5 | 5 | 0.07% | 0.07% | 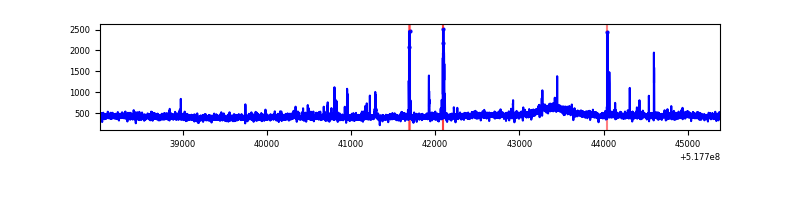 |
| B | 7367 | 7367 | 428 | 428 | 5.81% | 5.81% | 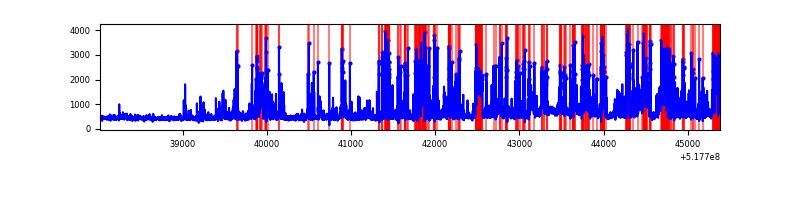 |
| C | 7368 | 7368 | 1256 | 1256 | 17.05% | 17.05% | 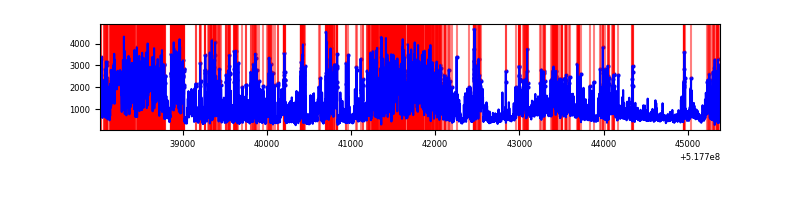 |
| D | 7368 | 7368 | 828 | 828 | 11.24% | 11.24% | 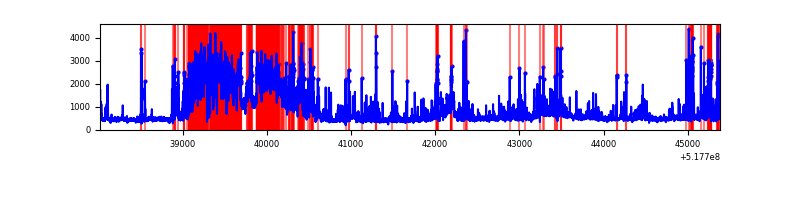 |
Top three noisy pixels from each quadrant. If the there are fewer than three noisy pixels in the level2.evt file, extra rows are filled as -1
| Pixel properties | Quadrant properties | ||||||
|---|---|---|---|---|---|---|---|
| Quadrant | DetID | PixID | Counts | Sigma | Mean | Median | Sigma |
| A | 8 | 6 | 64914 | 326.68 | 800 | 777 | 196.3 |
| A | 3 | 128 | 50581 | 253.68 | 800 | 777 | 196.3 |
| A | 3 | 14 | 12315 | 58.77 | 800 | 777 | 196.3 |
| B | 4 | 171 | 1918671 | 11853.53 | 763 | 735 | 161.8 |
| B | 4 | 80 | 379240 | 2339.3 | 763 | 735 | 161.8 |
| B | 0 | 155 | 127903 | 785.94 | 763 | 735 | 161.8 |
| C | 15 | 224 | 2888591 | 14889.58 | 713 | 705 | 194.0 |
| C | 12 | 254 | 2331118 | 12015.32 | 713 | 705 | 194.0 |
| C | 12 | 252 | 433003 | 2228.87 | 713 | 705 | 194.0 |
| D | 8 | 160 | 2682711 | 12746.55 | 750 | 717 | 210.4 |
| D | 3 | 12 | 350165 | 1660.8 | 750 | 717 | 210.4 |
| D | 3 | 224 | 197981 | 937.52 | 750 | 717 | 210.4 |
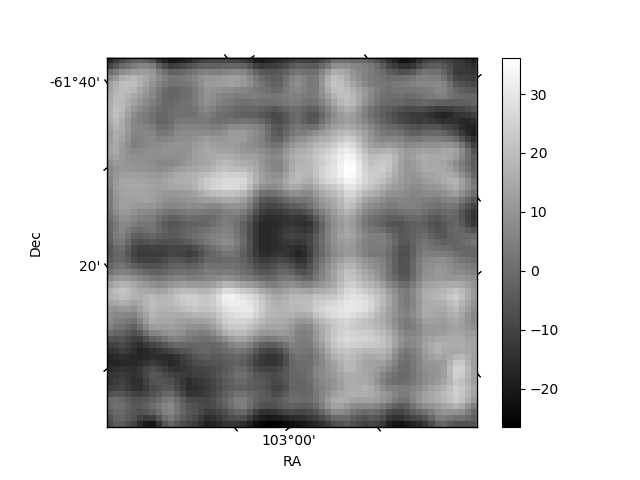
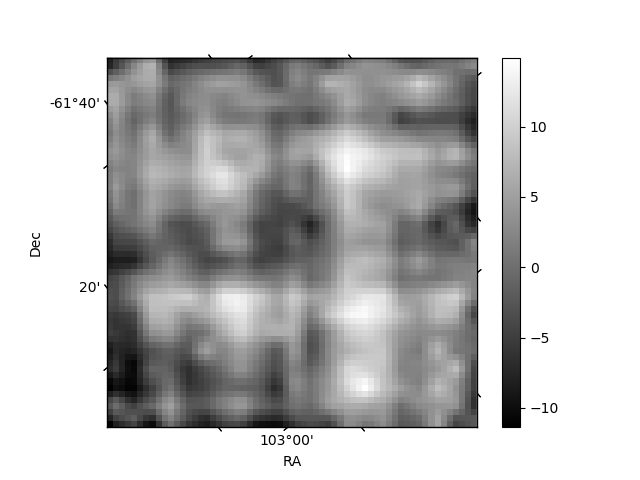
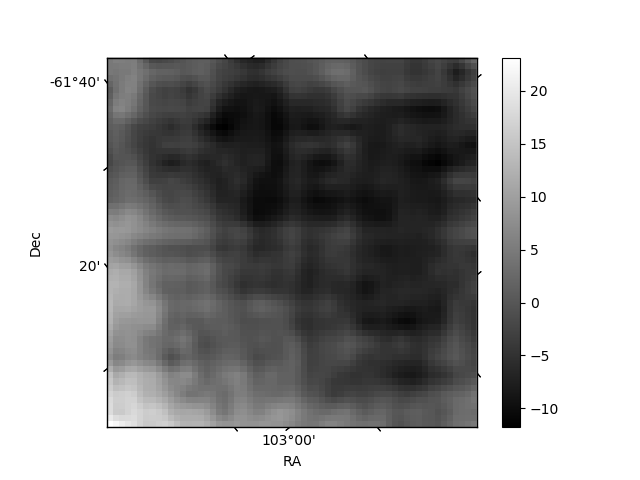
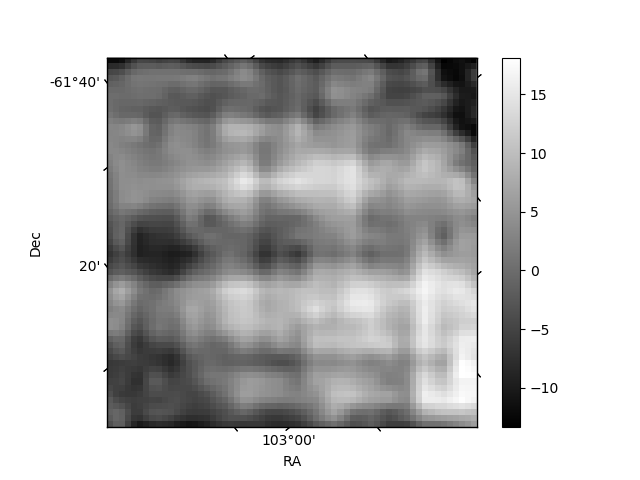
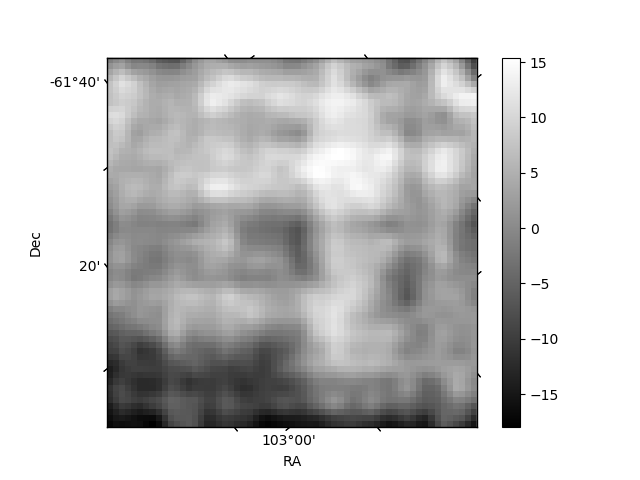
Histogram calculated using DETX and DETY for each event in the final _common_clean file
| Quadrant A | 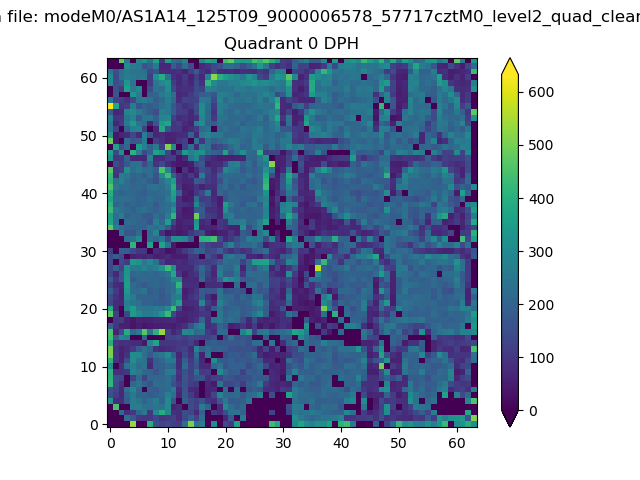 |
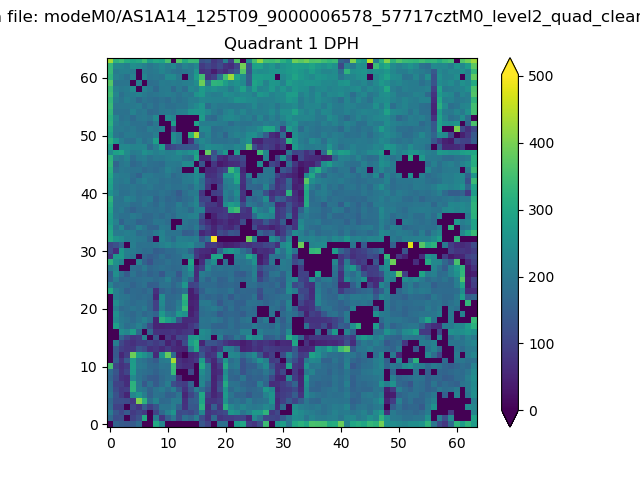 |
Quadrant B |
|---|---|---|---|
| Quadrant D | 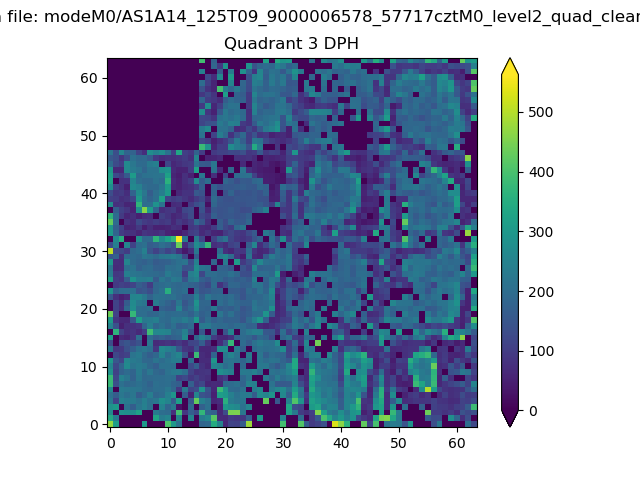 |
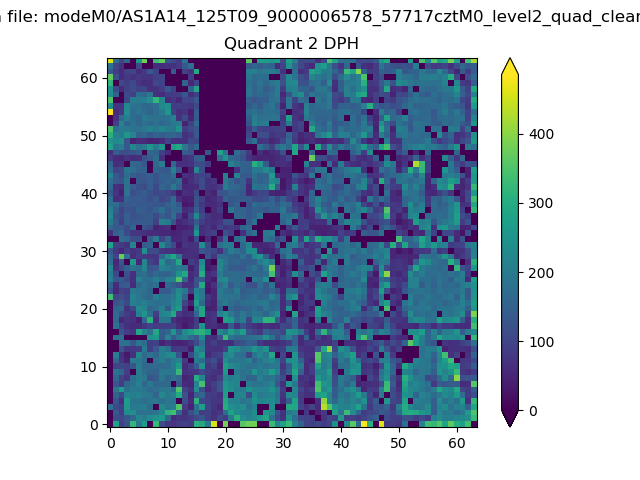 |
Quadrant C |
| Plot type | Count rate plots | Images |
|---|---|---|
| Comparison with Poisson distribution Blue bars denote a histogram of data divided into 1 sec bins. Red curve is a Poisson curve with rate = median count rate of data. |
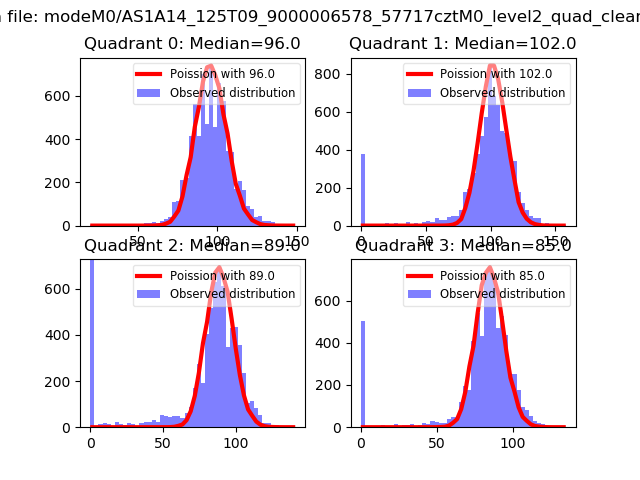 |
 |
| Quadrant-wise count rates Data is divided into 100 sec bins |
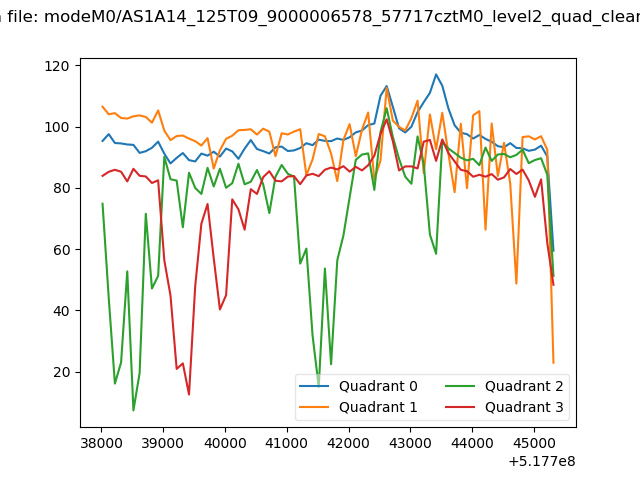 |
|
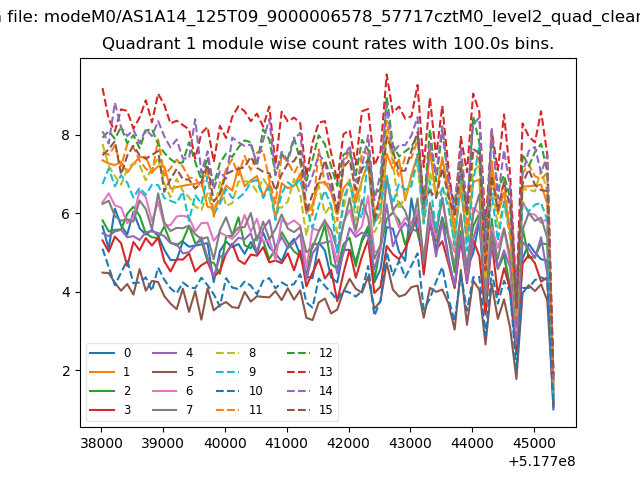
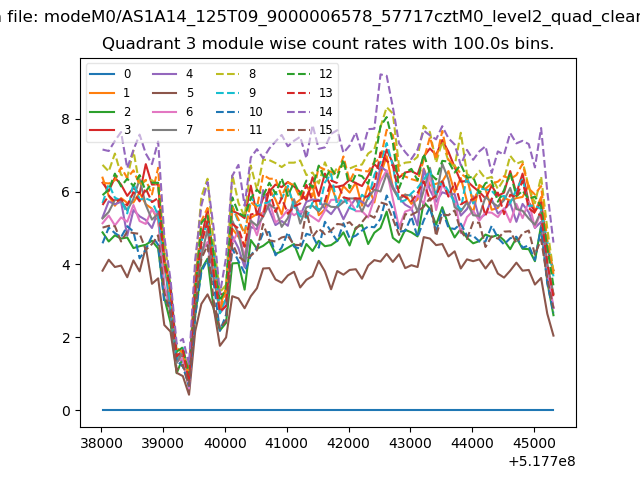
| Module-wise count rates for Quadrant A Data is divided into 100 sec bins |
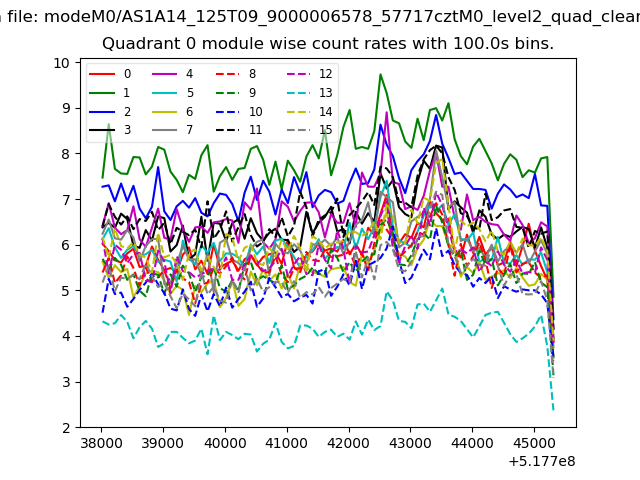 |
 |
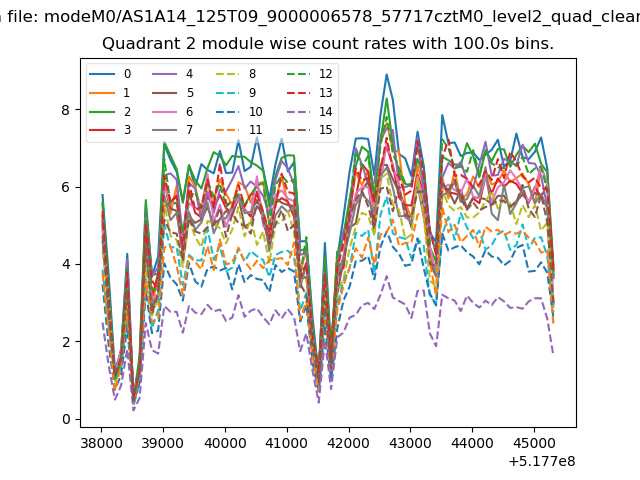
| Module-wise count rates for Quadrant B Data is divided into 100 sec bins |
 |
 |
| Module-wise count rates for Quadrant C Data is divided into 100 sec bins |
 |
 |
| Module-wise count rates for Quadrant D Data is divided into 100 sec bins |
 |
 |
| Parameter | Plot |
|---|---|
| CZT HV Monitor | 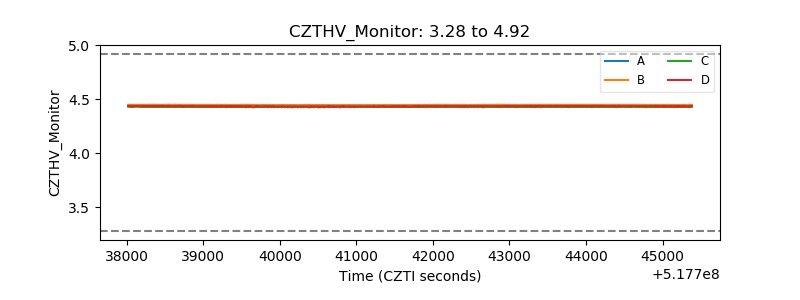 |
| D_VDD | 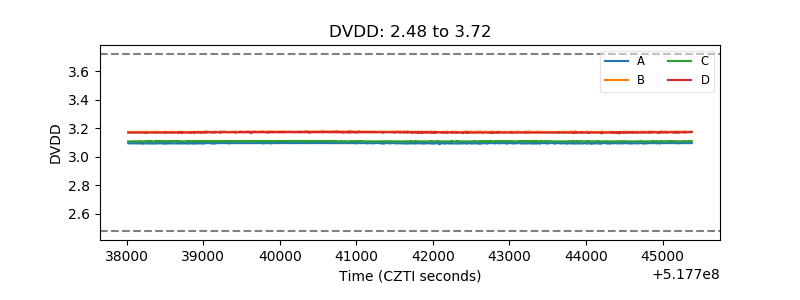 |
| Temperature 1 | 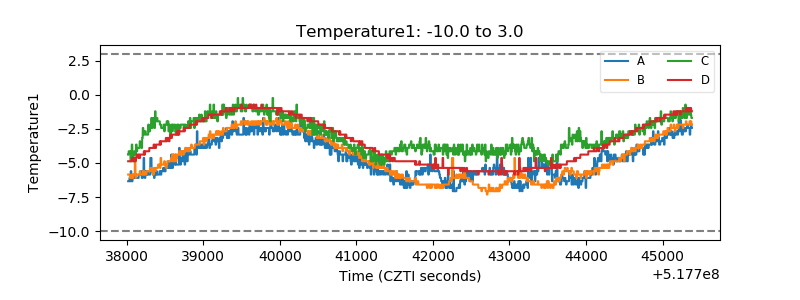 |
| Veto HV Monitor | 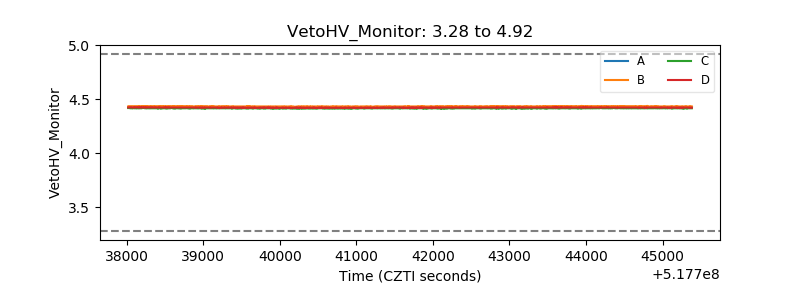 |
| Veto LLD | 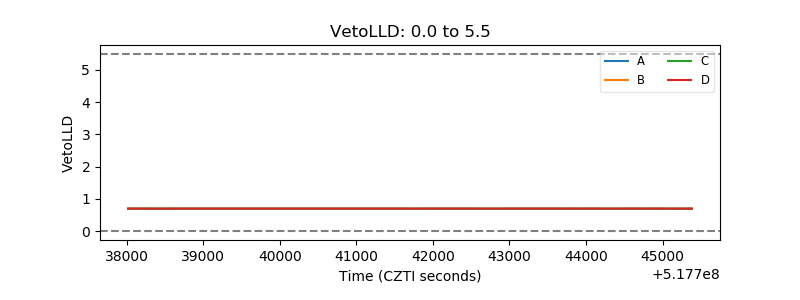 |
| Alpha Counter | 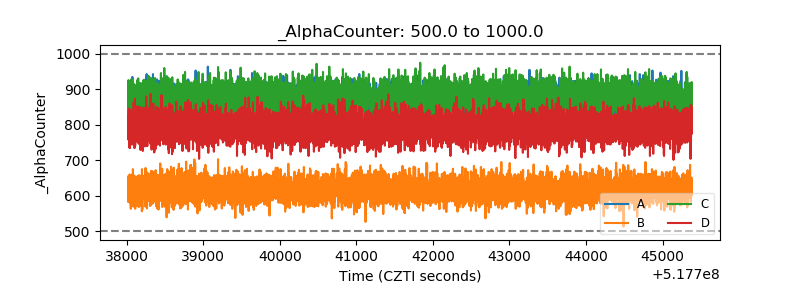 |
| _CPM_Rate | 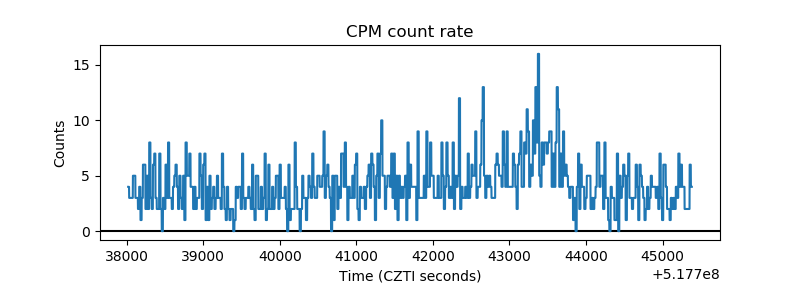 |
| CZT Counter | 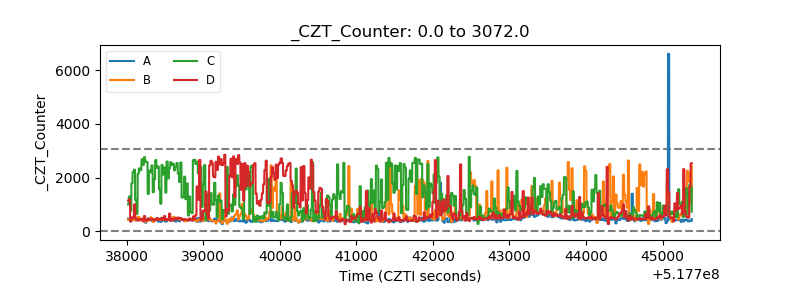 |
| +2.5 Volts monitor | 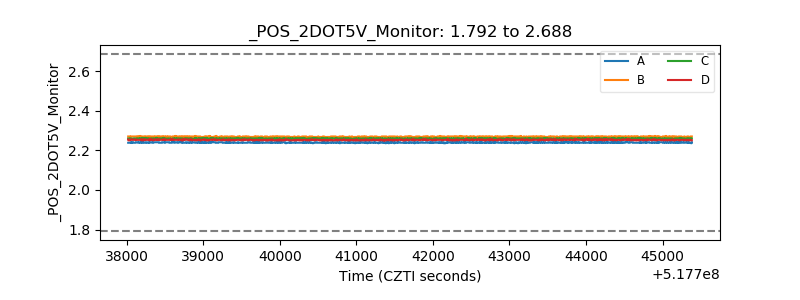 |
| +5 Volts monitor |  |
| _ROLL_ROT | 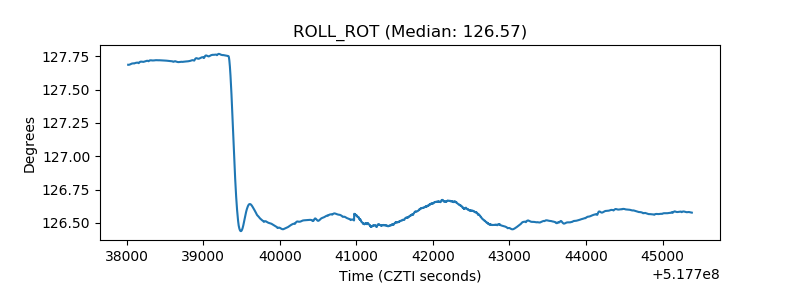 |
| _Roll_DEC | 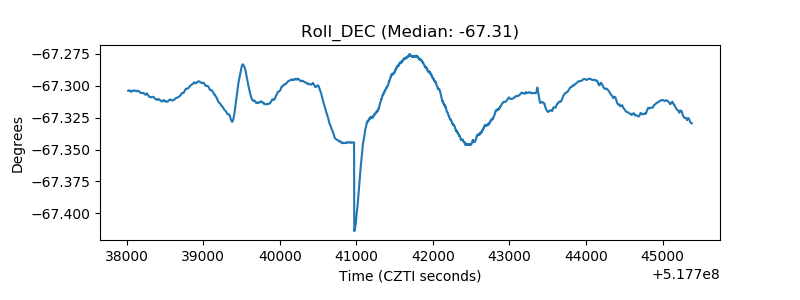 |
| _Roll_RA | 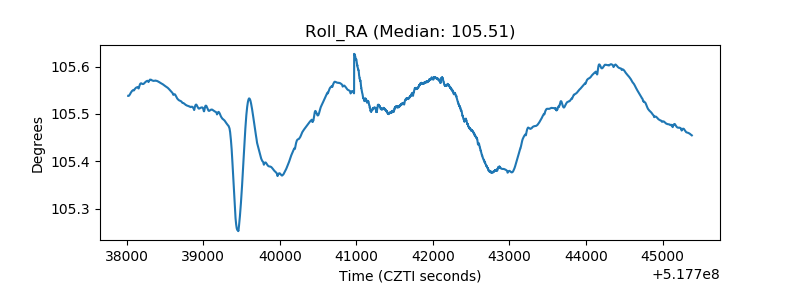 |
| Veto Counter | 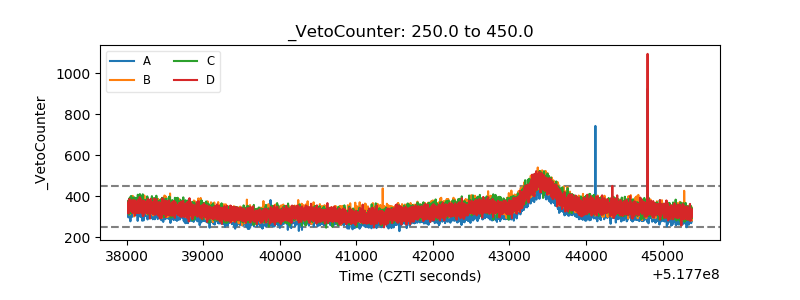 |