| Param | Original file | Final file |
|---|---|---|
| Filename | modeM0/AS1A14_125T09_9000006578_57722cztM0_level2.fits | modeM0/AS1A14_125T09_9000006578_57722cztM0_level2_quad_clean.evt |
| Size (bytes) | 1,367,697,600 | 256,406,400 |
| Size | 1.3 GB | 244.5 MB |
| Events in quadrant A | 9,655,608 | 1,714,542 |
| Events in quadrant B | 8,869,418 | 1,816,198 |
| Events in quadrant C | 21,246,988 | 1,428,265 |
| Events in quadrant D | 9,442,829 | 1,545,049 |
| Mode M9 | |||
|---|---|---|---|
| Quadrant | BADHDUFLAG | Total packets | Discarded packets |
| A | 0 | 16 | 0 |
| B | 0 | 16 | 0 |
| C | 0 | 16 | 0 |
| D | 0 | 16 | 0 |
| Mode SS | |||
|---|---|---|---|
| Quadrant | BADHDUFLAG | Total packets | Discarded packets |
| A | 0 | 370 | 0 |
| B | 0 | 370 | 0 |
| C | 0 | 370 | 0 |
| D | 0 | 370 | 0 |
| Mode M0 | |||
|---|---|---|---|
| Quadrant | BADHDUFLAG | Total packets | Discarded packets |
| A | 0 | 41719 | 4 |
| B | 0 | 39679 | 4 |
| C | 0 | 75888 | 5 |
| D | 0 | 40848 | 4 |
| Quadrant | Total seconds | Saturated seconds | Saturation percentage |
|---|---|---|---|
| A | 18269 | 375 | 2.052658% |
| B | 18270 | 353 | 1.932129% |
| C | 18269 | 3194 | 17.483168% |
| D | 18269 | 211 | 1.154962% |
Noise dominated data is calculated using 1-second bins in cleaned event files. If a bin has >2000 counts, and if more than 50% of those come from <1% of pixels, then it is considered to be noise-dominated and hence unusable.
| Quadrant | # 1 sec bins | Bins with >0 counts | Bins with >2000 counts | High rate bins dominated by noise | Noise dominated (total time) | Noise dominated (detector-on time) | Marked lightcurve |
|---|---|---|---|---|---|---|---|
| A | 19794 | 18273 | 62 | 62 | 0.31% | 0.34% | 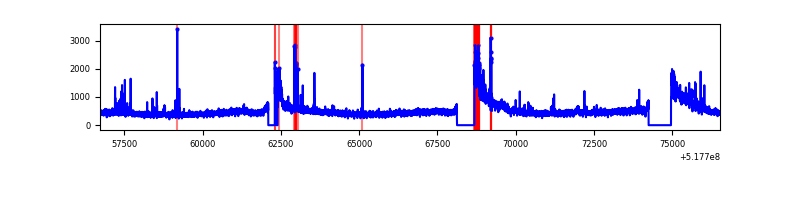 |
| B | 19795 | 18273 | 142 | 142 | 0.72% | 0.78% | 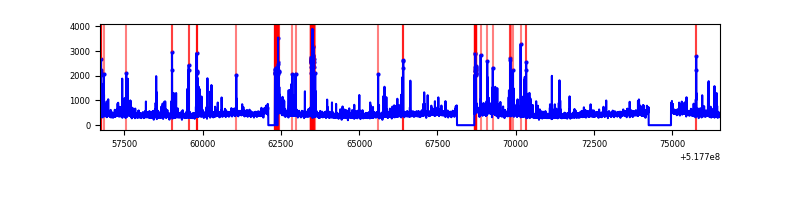 |
| C | 19794 | 18272 | 2645 | 2645 | 13.36% | 14.48% | 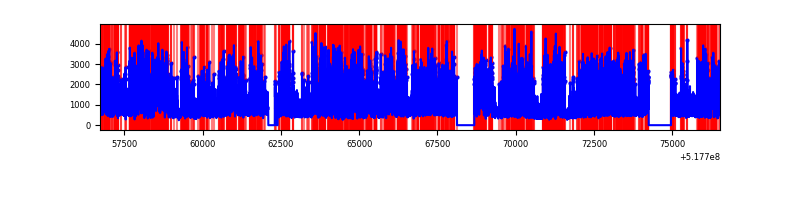 |
| D | 19794 | 18273 | 118 | 118 | 0.60% | 0.65% | 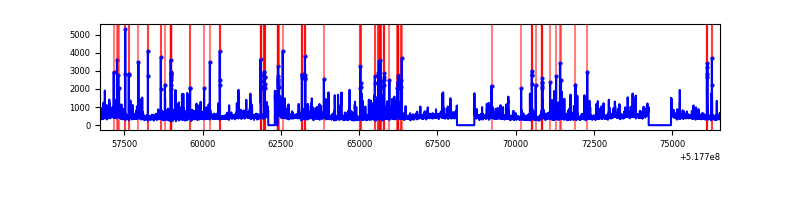 |
Top three noisy pixels from each quadrant. If the there are fewer than three noisy pixels in the level2.evt file, extra rows are filled as -1
| Pixel properties | Quadrant properties | ||||||
|---|---|---|---|---|---|---|---|
| Quadrant | DetID | PixID | Counts | Sigma | Mean | Median | Sigma |
| A | 11 | 31 | 1749984 | 3628.43 | 1959 | 1911 | 481.8 |
| A | 13 | 248 | 205254 | 422.07 | 1959 | 1911 | 481.8 |
| A | 3 | 128 | 36927 | 72.68 | 1959 | 1911 | 481.8 |
| B | 4 | 142 | 278587 | 672.99 | 1927 | 1855 | 411.2 |
| B | 0 | 213 | 219883 | 530.23 | 1927 | 1855 | 411.2 |
| B | 10 | 16 | 166888 | 401.35 | 1927 | 1855 | 411.2 |
| C | 15 | 224 | 9570181 | 20046.43 | 1772 | 1757 | 477.3 |
| C | 12 | 254 | 3881170 | 8127.61 | 1772 | 1757 | 477.3 |
| C | 14 | 254 | 321060 | 668.96 | 1772 | 1757 | 477.3 |
| D | 3 | 12 | 462993 | 865.75 | 1894 | 1807 | 532.7 |
| D | 8 | 160 | 296207 | 552.66 | 1894 | 1807 | 532.7 |
| D | 8 | 240 | 281358 | 524.78 | 1894 | 1807 | 532.7 |
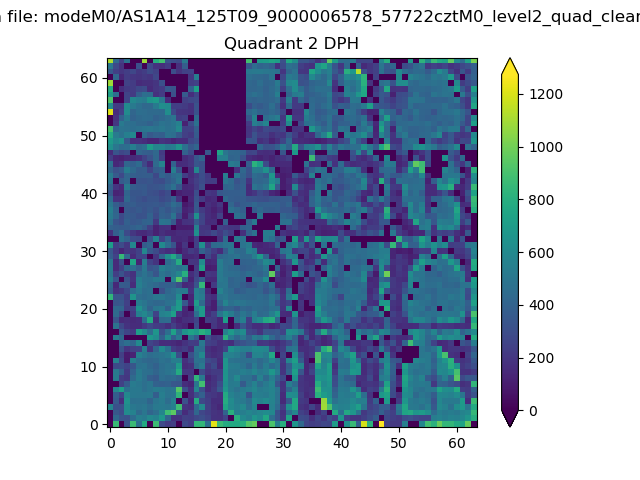
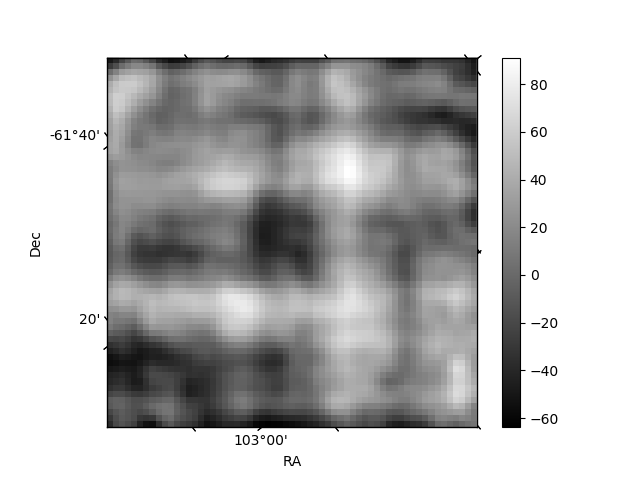
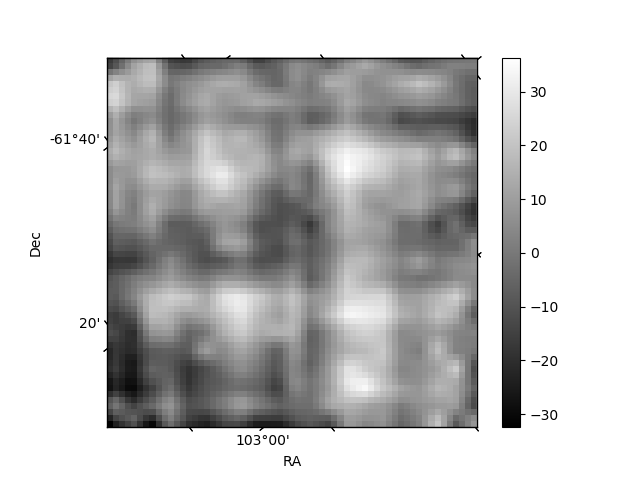
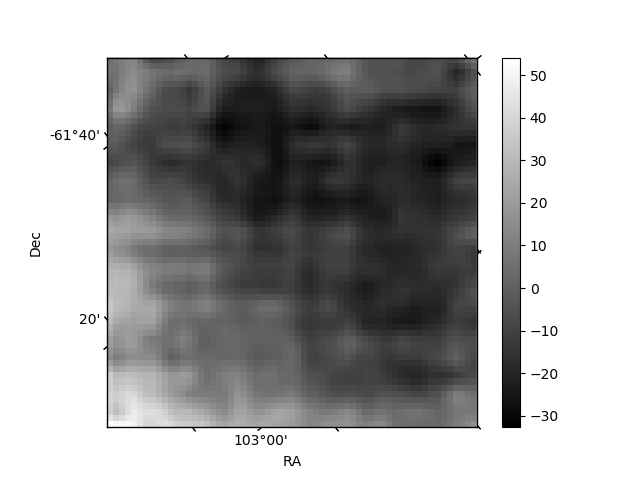
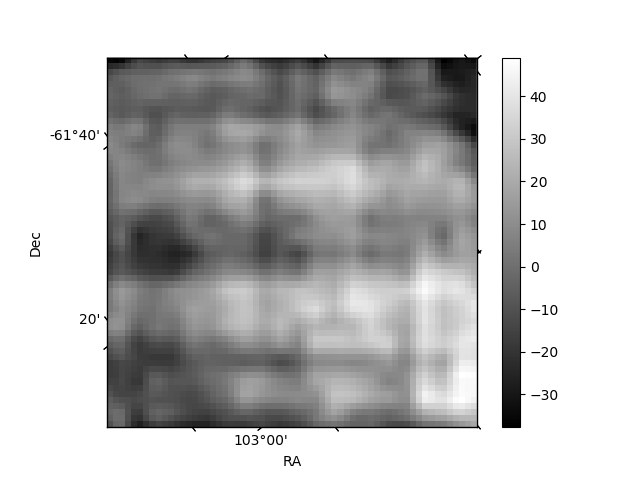
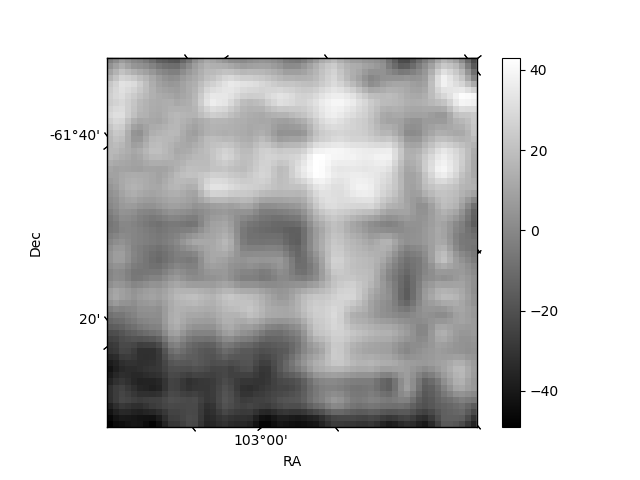
Histogram calculated using DETX and DETY for each event in the final _common_clean file
| Quadrant A | 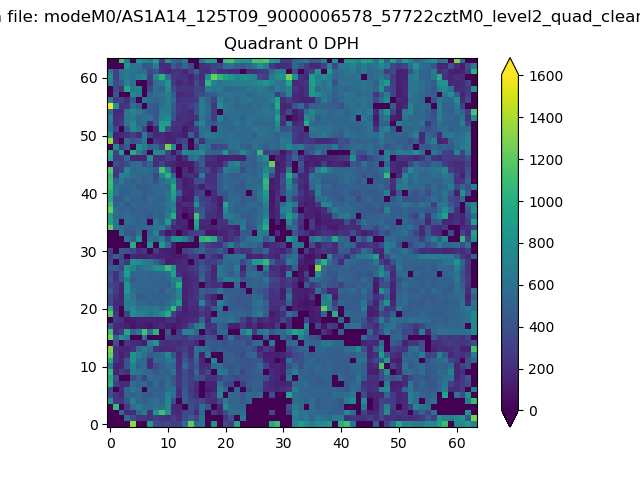 |
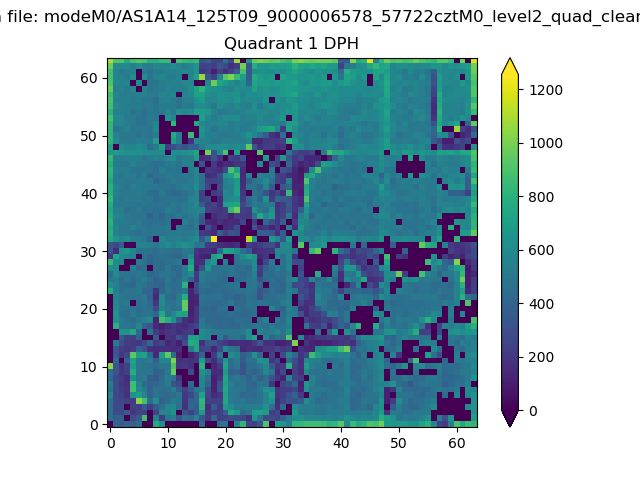 |
Quadrant B |
|---|---|---|---|
| Quadrant D | 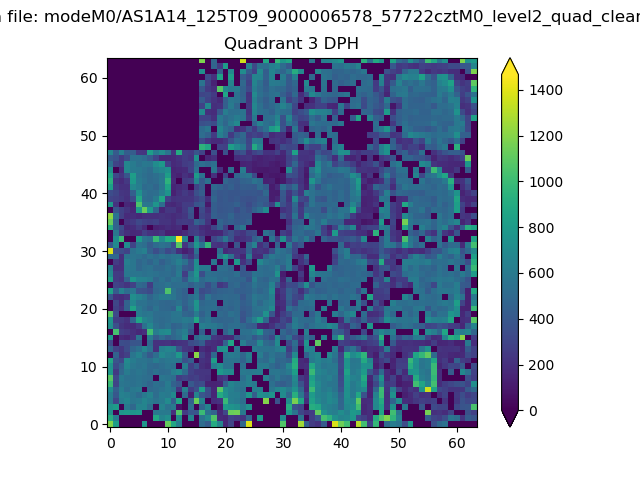 |
 |
Quadrant C |
| Plot type | Count rate plots | Images |
|---|---|---|
| Comparison with Poisson distribution Blue bars denote a histogram of data divided into 1 sec bins. Red curve is a Poisson curve with rate = median count rate of data. |
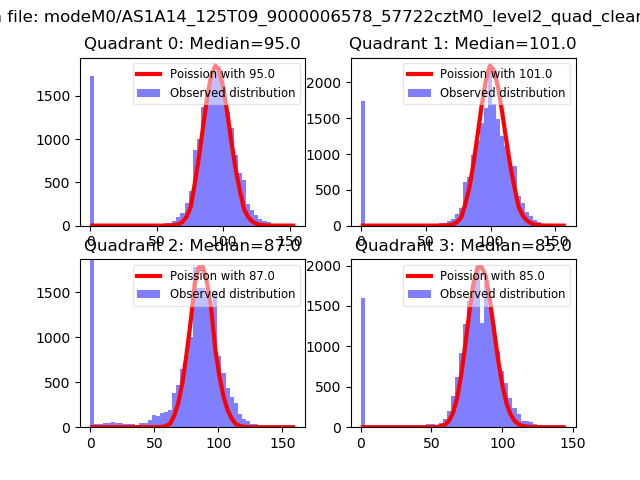 |
 |
| Quadrant-wise count rates Data is divided into 100 sec bins |
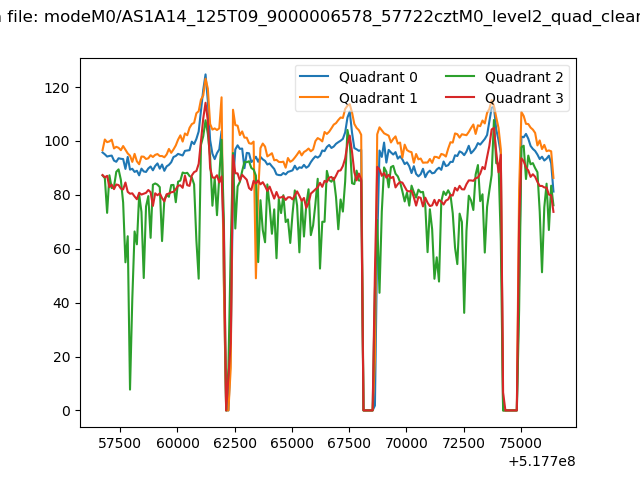 |
|
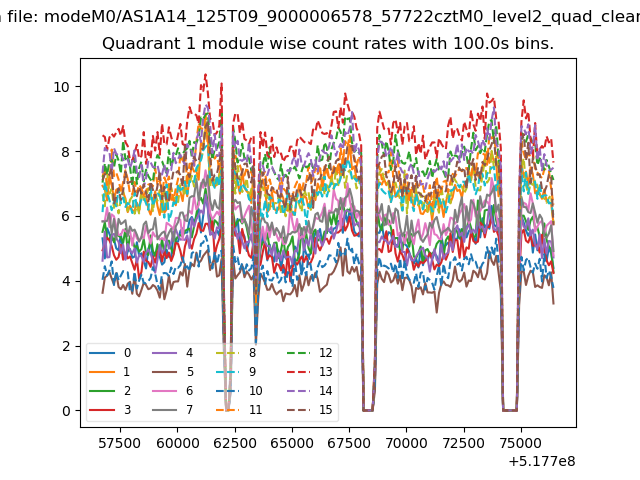
| Module-wise count rates for Quadrant A Data is divided into 100 sec bins |
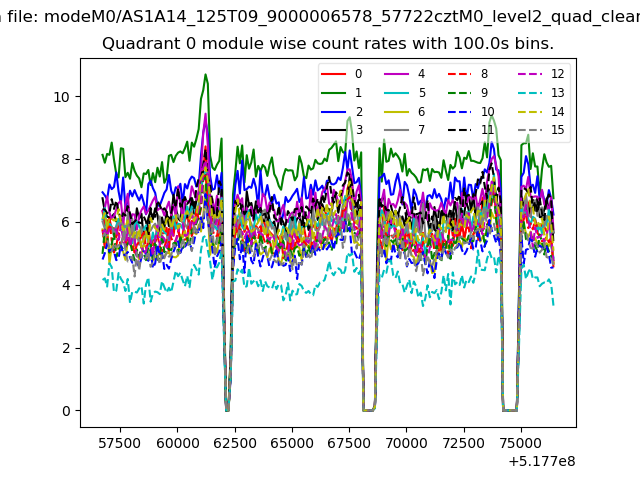 |
 |
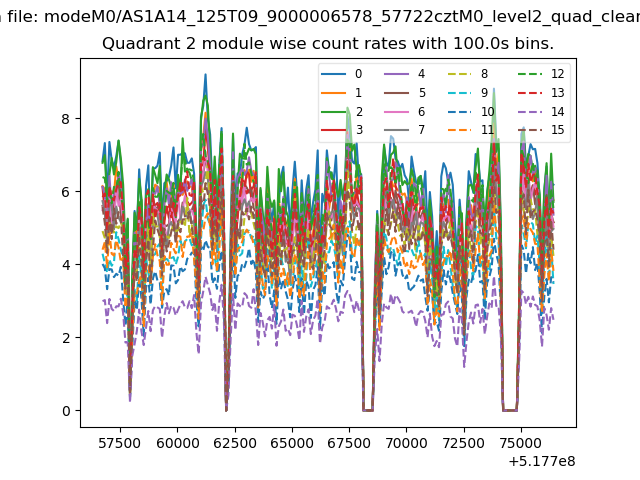
| Module-wise count rates for Quadrant B Data is divided into 100 sec bins |
 |
 |
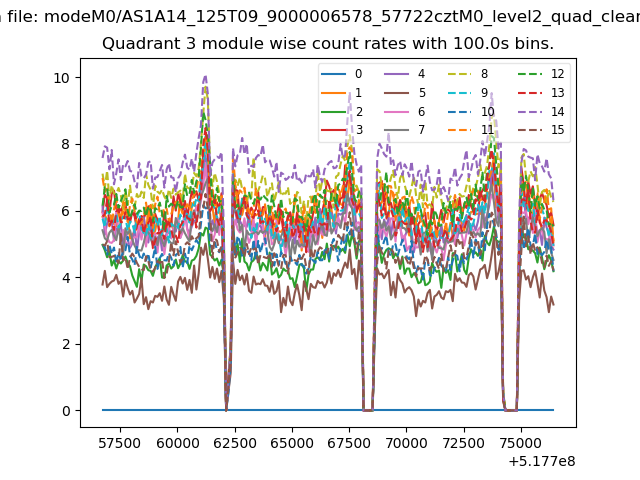
| Module-wise count rates for Quadrant C Data is divided into 100 sec bins |
 |
 |
| Module-wise count rates for Quadrant D Data is divided into 100 sec bins |
 |
 |
| Parameter | Plot |
|---|---|
| CZT HV Monitor | 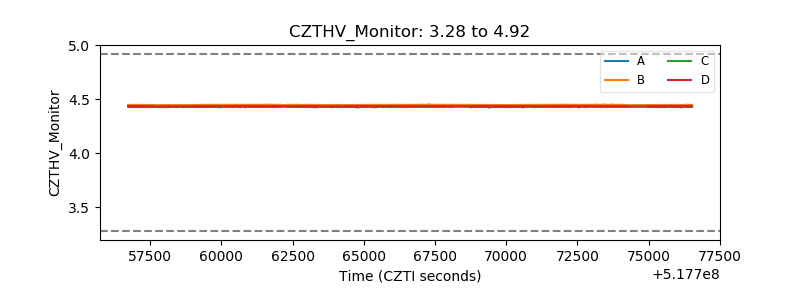 |
| D_VDD | 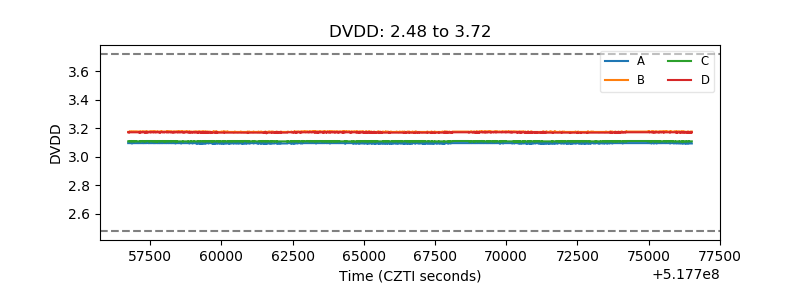 |
| Temperature 1 | 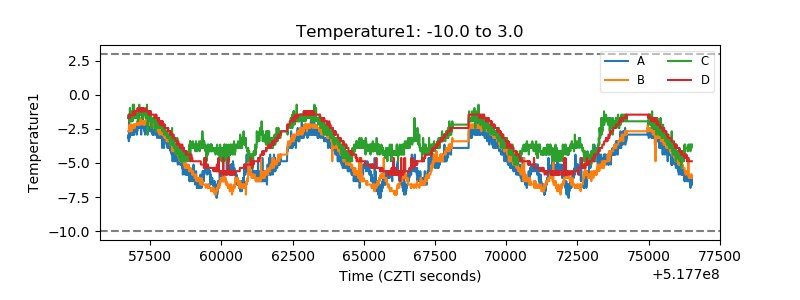 |
| Veto HV Monitor | 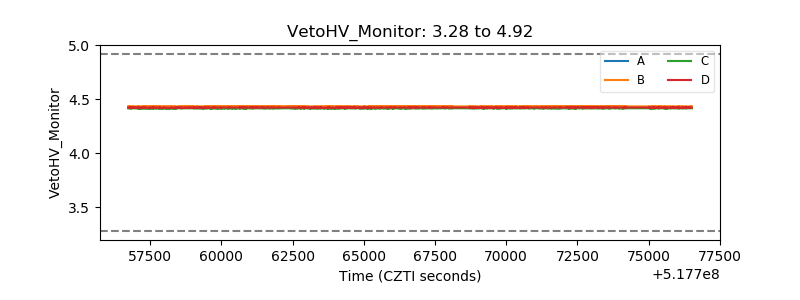 |
| Veto LLD | 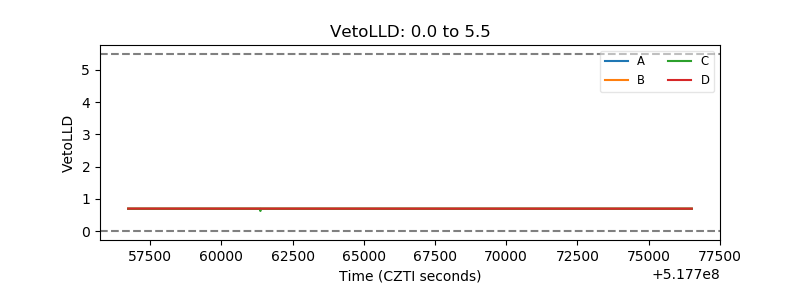 |
| Alpha Counter | 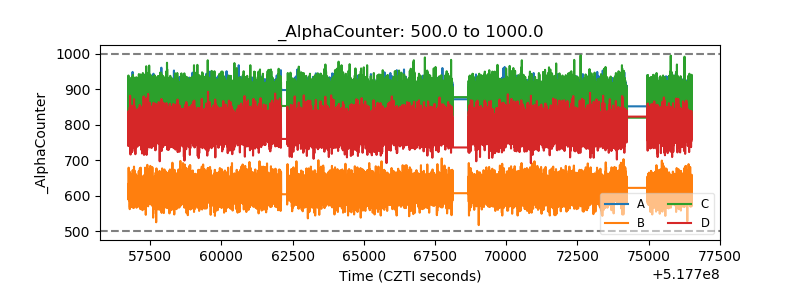 |
| _CPM_Rate | 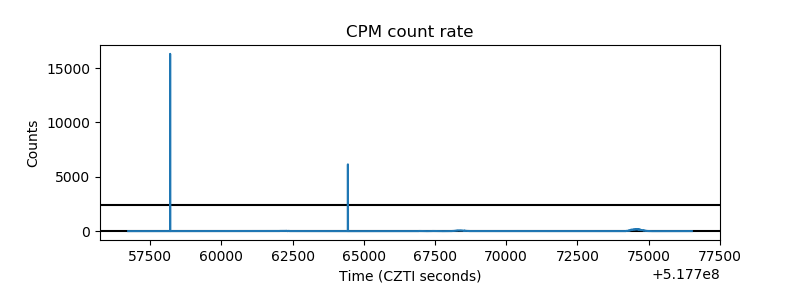 |
| CZT Counter | 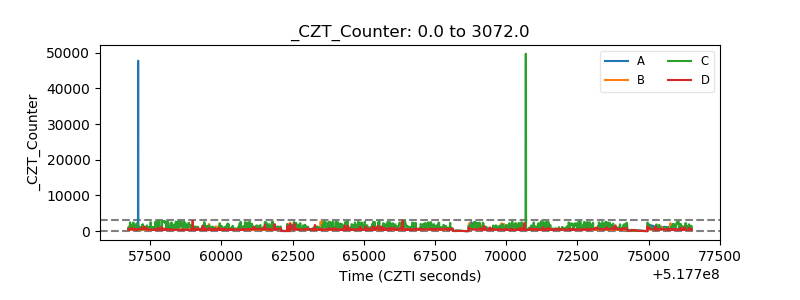 |
| +2.5 Volts monitor | 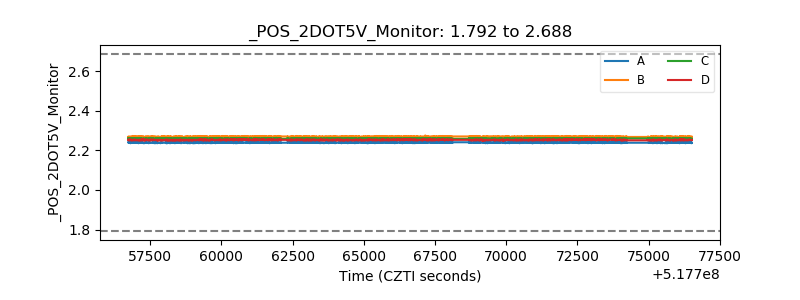 |
| +5 Volts monitor |  |
| _ROLL_ROT | 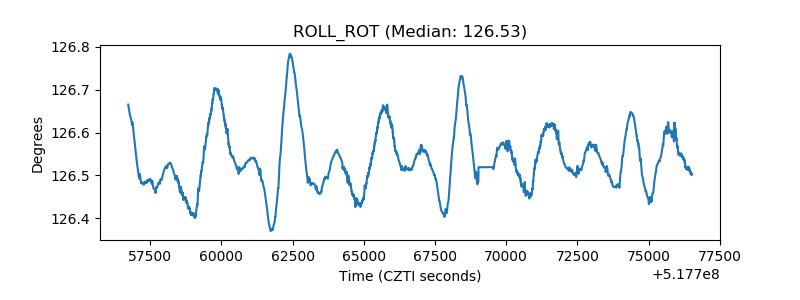 |
| _Roll_DEC | 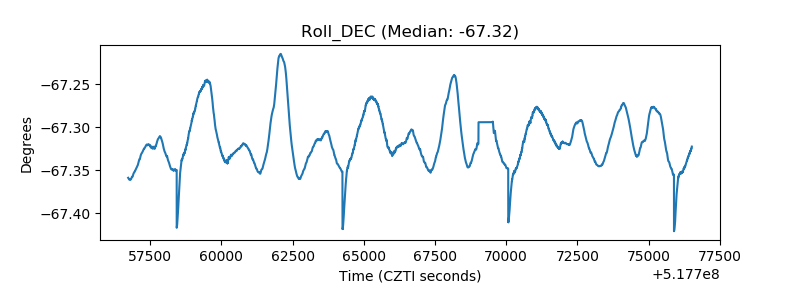 |
| _Roll_RA | 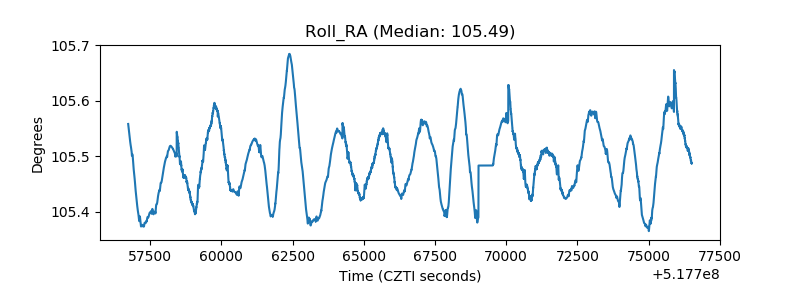 |
| Veto Counter | 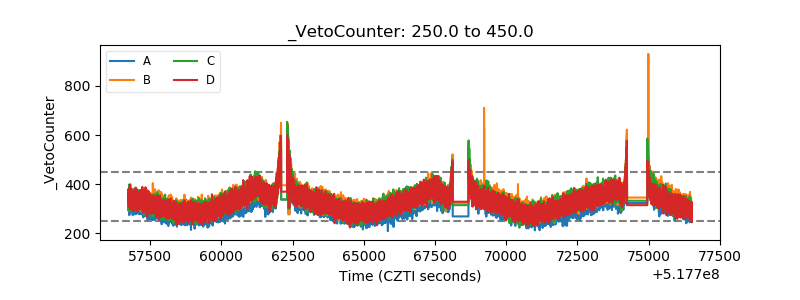 |