| Param | Original file | Final file |
|---|---|---|
| Filename | modeM0/AS1A14_125T09_9000006578_57723cztM0_level2.fits | modeM0/AS1A14_125T09_9000006578_57723cztM0_level2_quad_clean.evt |
| Size (bytes) | 2,254,559,040 | 409,688,640 |
| Size | 2.1 GB | 390.7 MB |
| Events in quadrant A | 14,929,497 | 2,765,434 |
| Events in quadrant B | 14,348,968 | 2,935,458 |
| Events in quadrant C | 36,135,648 | 2,220,226 |
| Events in quadrant D | 15,800,571 | 2,488,049 |
| Mode M9 | |||
|---|---|---|---|
| Quadrant | BADHDUFLAG | Total packets | Discarded packets |
| A | 0 | 26 | 0 |
| B | 0 | 26 | 0 |
| C | 0 | 26 | 0 |
| D | 0 | 26 | 0 |
| Mode SS | |||
|---|---|---|---|
| Quadrant | BADHDUFLAG | Total packets | Discarded packets |
| A | 0 | 584 | 0 |
| B | 0 | 584 | 0 |
| C | 0 | 584 | 0 |
| D | 0 | 584 | 0 |
| Mode M0 | |||
|---|---|---|---|
| Quadrant | BADHDUFLAG | Total packets | Discarded packets |
| A | 0 | 65370 | 4 |
| B | 0 | 63573 | 4 |
| C | 0 | 127582 | 7 |
| D | 0 | 67427 | 4 |
| Quadrant | Total seconds | Saturated seconds | Saturation percentage |
|---|---|---|---|
| A | 29021 | 471 | 1.622963% |
| B | 29022 | 518 | 1.784853% |
| C | 29021 | 6171 | 21.263912% |
| D | 29021 | 432 | 1.488577% |
Noise dominated data is calculated using 1-second bins in cleaned event files. If a bin has >2000 counts, and if more than 50% of those come from <1% of pixels, then it is considered to be noise-dominated and hence unusable.
| Quadrant | # 1 sec bins | Bins with >0 counts | Bins with >2000 counts | High rate bins dominated by noise | Noise dominated (total time) | Noise dominated (detector-on time) | Marked lightcurve |
|---|---|---|---|---|---|---|---|
| A | 31461 | 29026 | 86 | 86 | 0.27% | 0.30% | 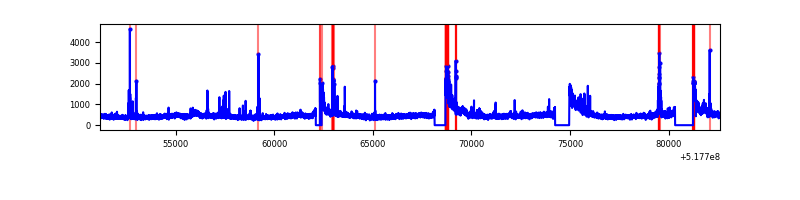 |
| B | 31462 | 29026 | 215 | 215 | 0.68% | 0.74% | 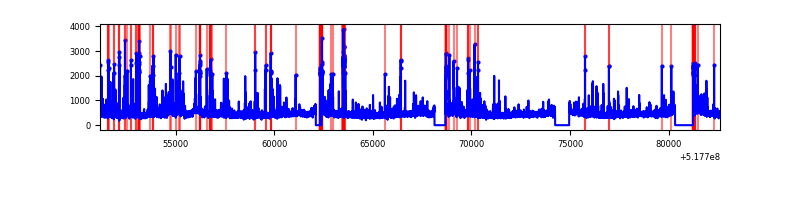 |
| C | 31461 | 29024 | 5180 | 5180 | 16.46% | 17.85% | 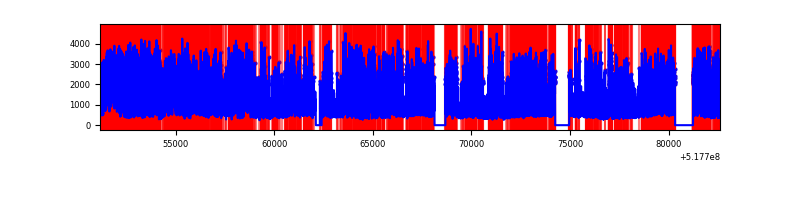 |
| D | 31461 | 29026 | 310 | 310 | 0.99% | 1.07% | 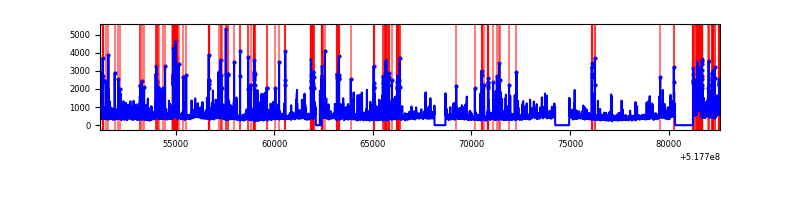 |
Top three noisy pixels from each quadrant. If the there are fewer than three noisy pixels in the level2.evt file, extra rows are filled as -1
| Pixel properties | Quadrant properties | ||||||
|---|---|---|---|---|---|---|---|
| Quadrant | DetID | PixID | Counts | Sigma | Mean | Median | Sigma |
| A | 11 | 31 | 2307246 | 3006.65 | 3119 | 3037 | 766.4 |
| A | 13 | 248 | 372155 | 481.64 | 3119 | 3037 | 766.4 |
| A | 3 | 128 | 73736 | 92.25 | 3119 | 3037 | 766.4 |
| B | 4 | 142 | 409053 | 619.07 | 3071 | 2954 | 656.0 |
| B | 0 | 213 | 254461 | 383.4 | 3071 | 2954 | 656.0 |
| B | 5 | 185 | 250981 | 378.1 | 3071 | 2954 | 656.0 |
| C | 15 | 224 | 15752553 | 21068.0 | 2777 | 2754 | 747.6 |
| C | 12 | 254 | 7737318 | 10346.28 | 2777 | 2754 | 747.6 |
| C | 14 | 254 | 796875 | 1062.27 | 2777 | 2754 | 747.6 |
| D | 8 | 160 | 793759 | 941.73 | 3004 | 2864 | 839.8 |
| D | 3 | 12 | 727974 | 863.4 | 3004 | 2864 | 839.8 |
| D | 8 | 240 | 367732 | 434.46 | 3004 | 2864 | 839.8 |
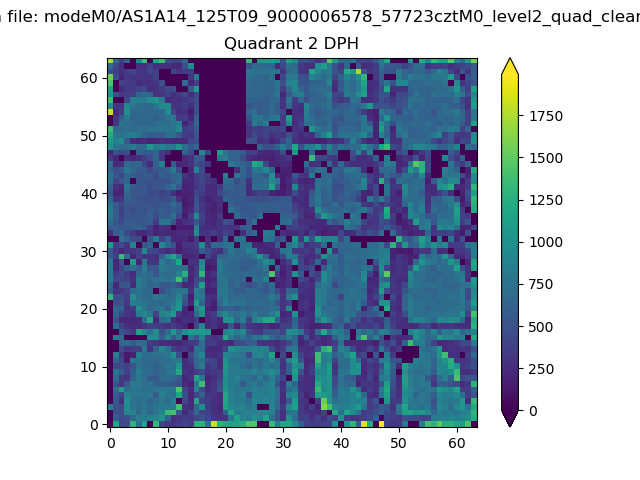
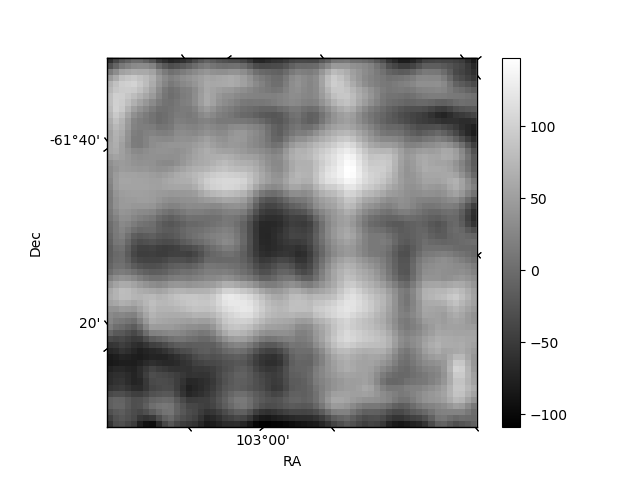
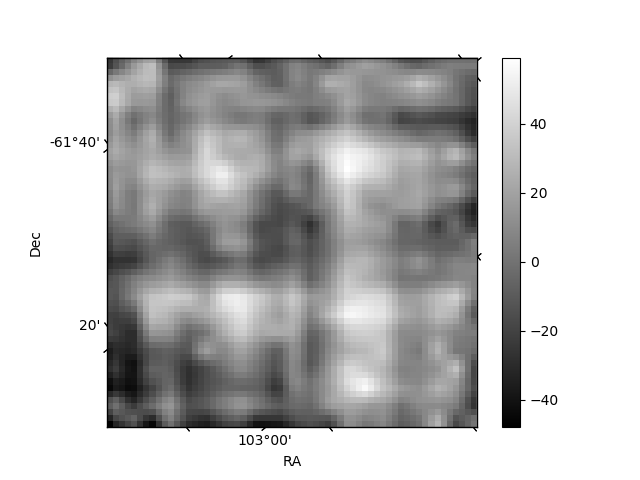
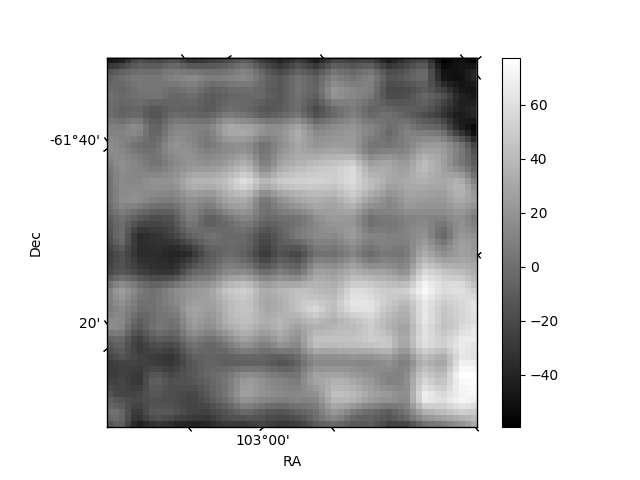
Histogram calculated using DETX and DETY for each event in the final _common_clean file
| Quadrant A | 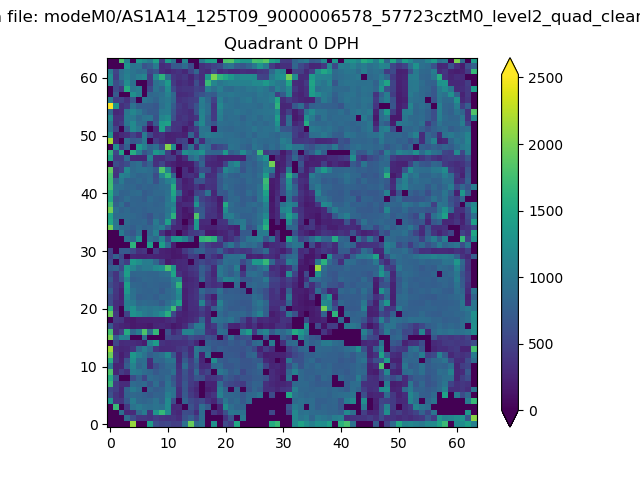 |
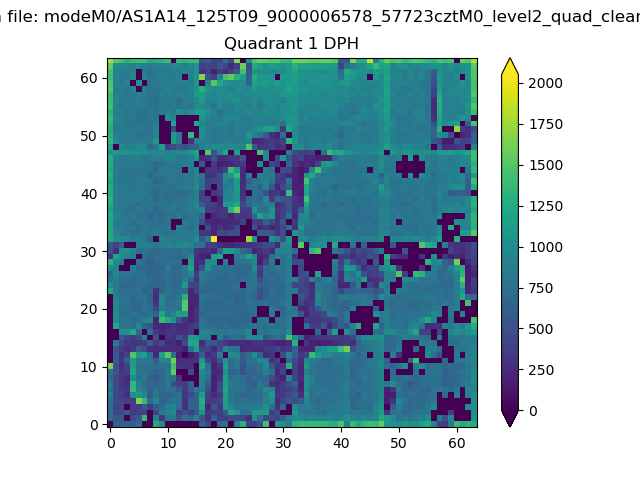 |
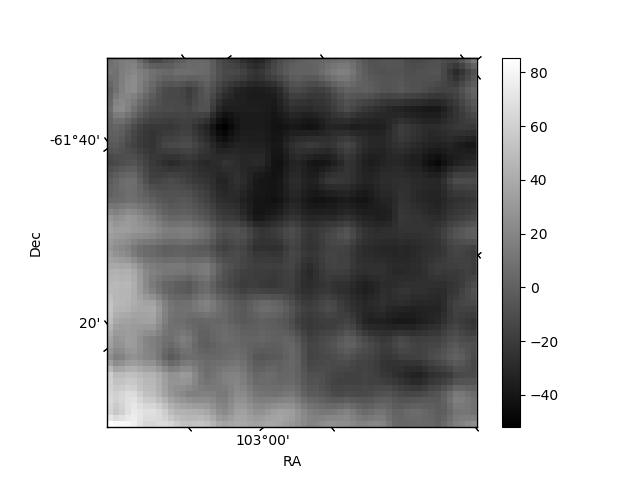
Quadrant B |
|---|---|---|---|
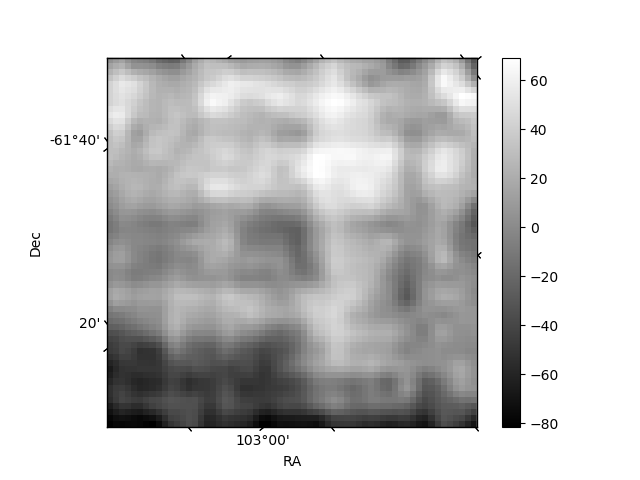
| Quadrant D | 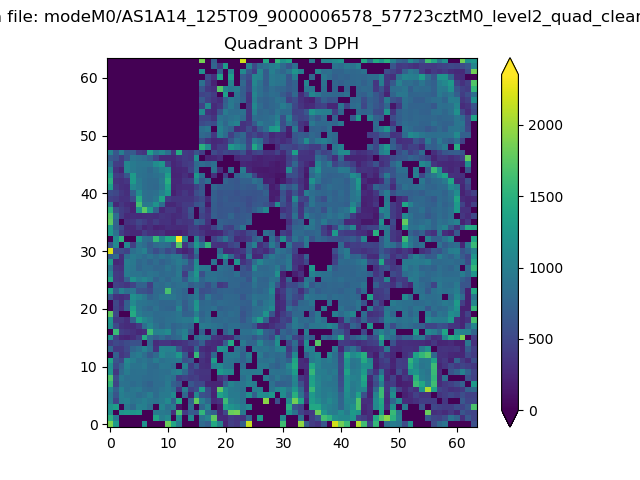 |
 |
Quadrant C |
| Plot type | Count rate plots | Images |
|---|---|---|
| Comparison with Poisson distribution Blue bars denote a histogram of data divided into 1 sec bins. Red curve is a Poisson curve with rate = median count rate of data. |
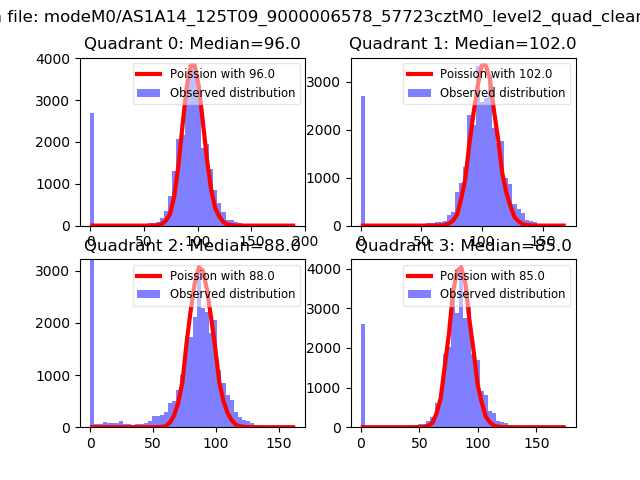 |
 |
| Quadrant-wise count rates Data is divided into 100 sec bins |
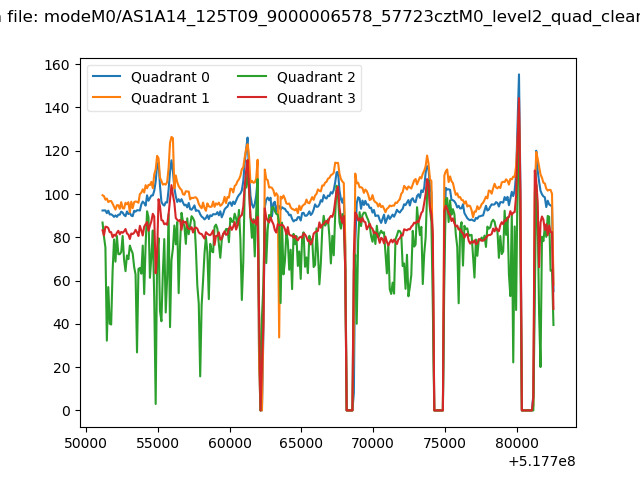 |
|
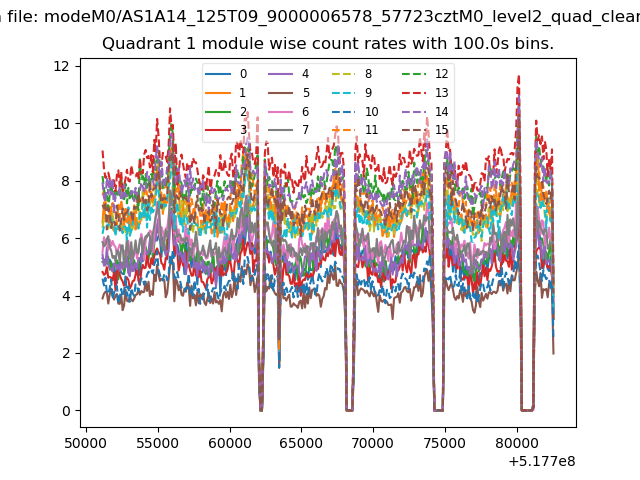
| Module-wise count rates for Quadrant A Data is divided into 100 sec bins |
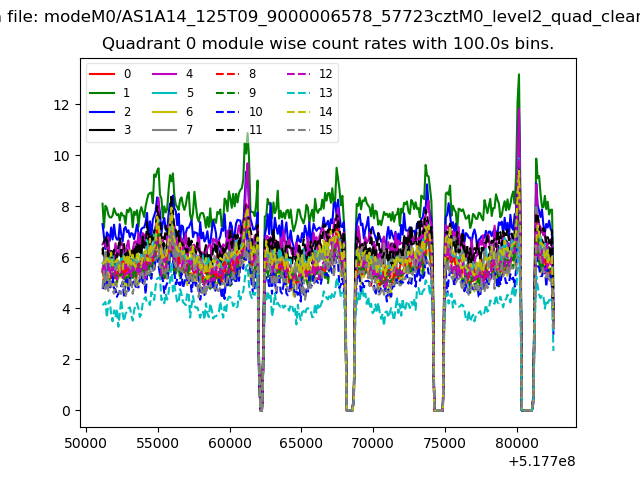 |
 |
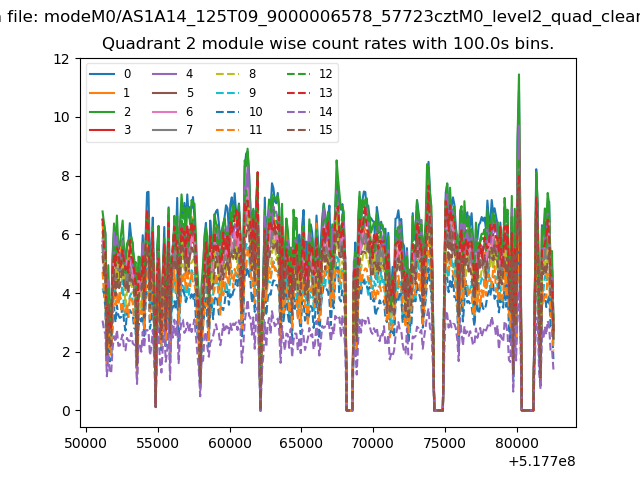
| Module-wise count rates for Quadrant B Data is divided into 100 sec bins |
 |
 |
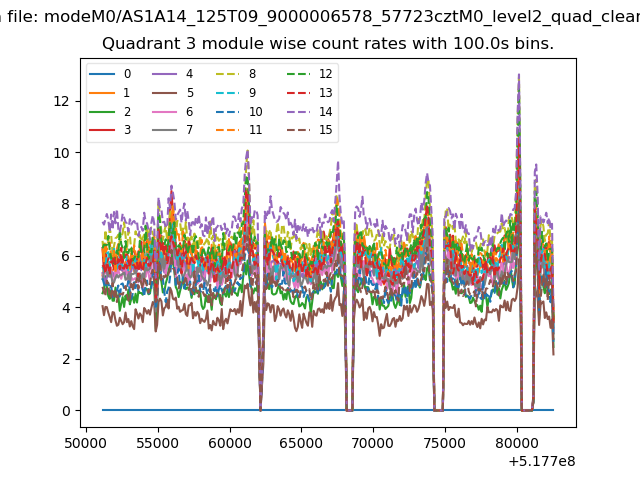
| Module-wise count rates for Quadrant C Data is divided into 100 sec bins |
 |
 |
| Module-wise count rates for Quadrant D Data is divided into 100 sec bins |
 |
 |
| Parameter | Plot |
|---|---|
| CZT HV Monitor | 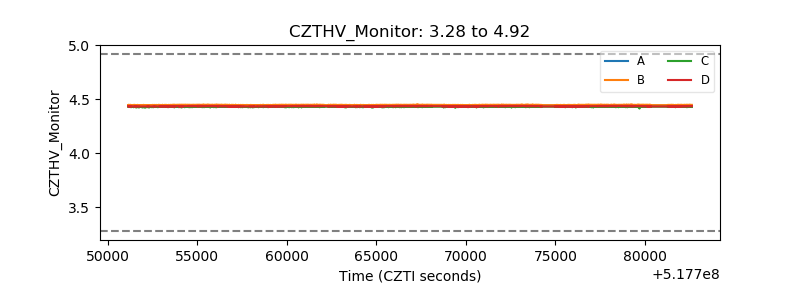 |
| D_VDD | 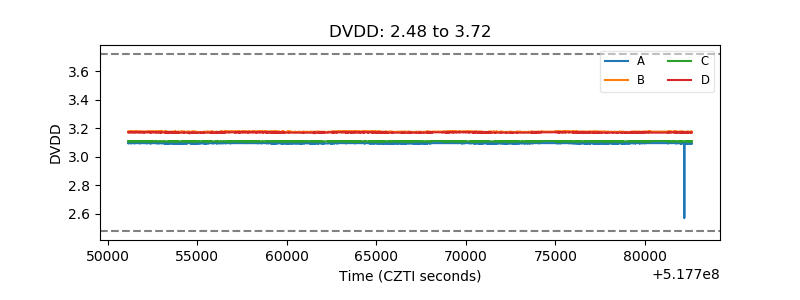 |
| Temperature 1 | 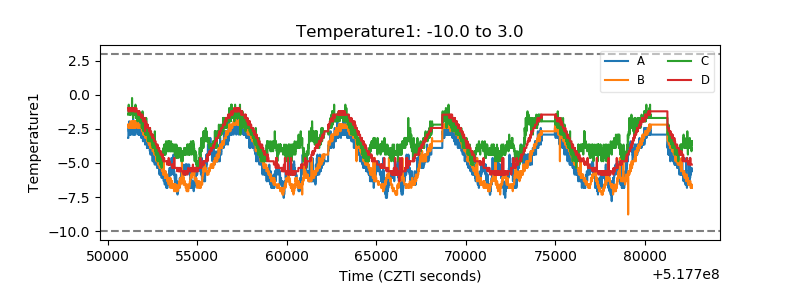 |
| Veto HV Monitor | 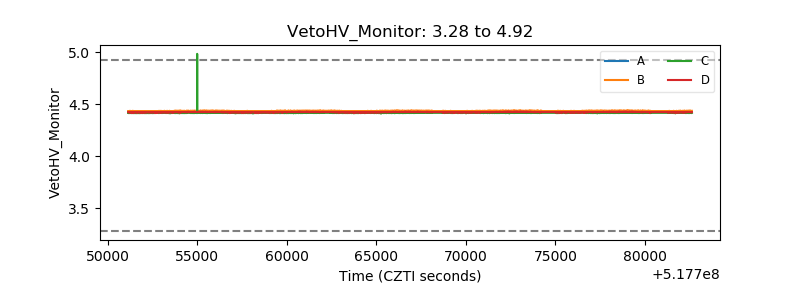 |
| Veto LLD | 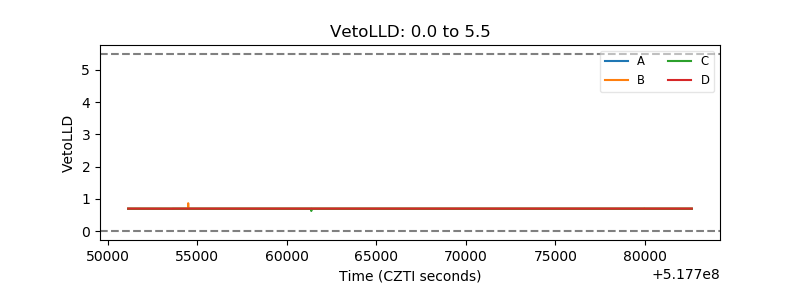 |
| Alpha Counter | 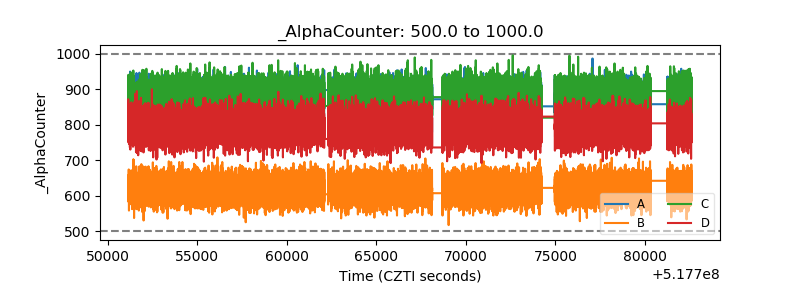 |
| _CPM_Rate | 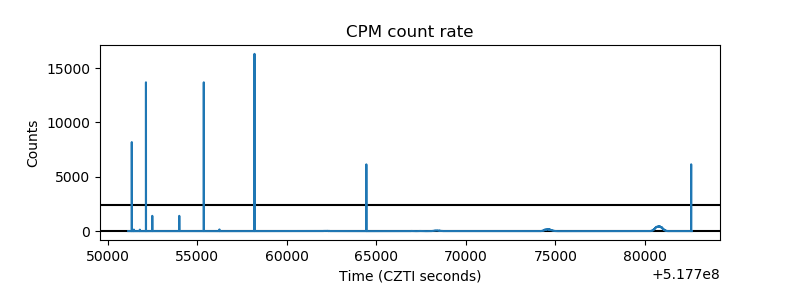 |
| CZT Counter | 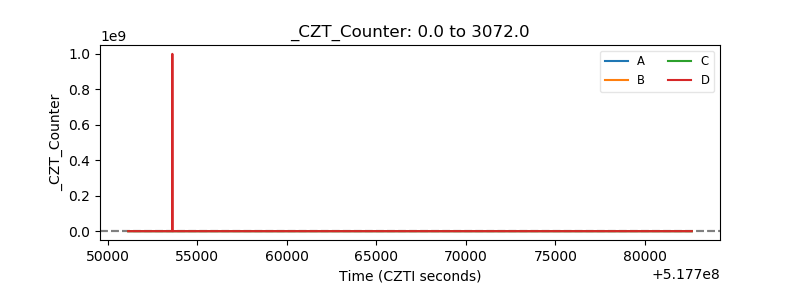 |
| +2.5 Volts monitor |  |
| +5 Volts monitor |  |
| _ROLL_ROT | 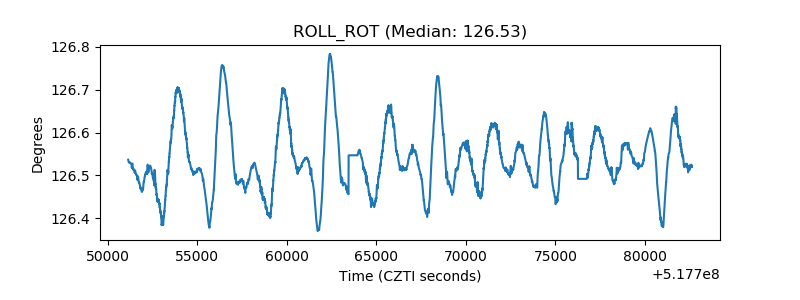 |
| _Roll_DEC | 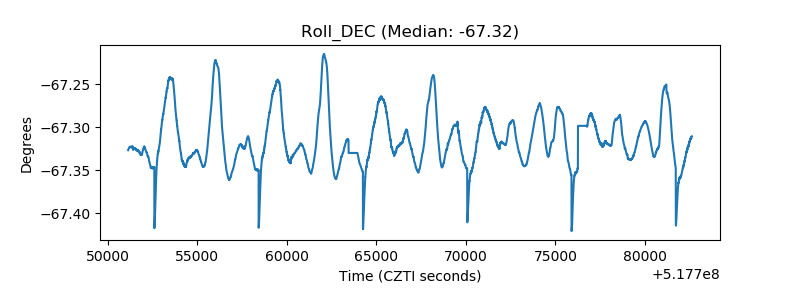 |
| _Roll_RA | 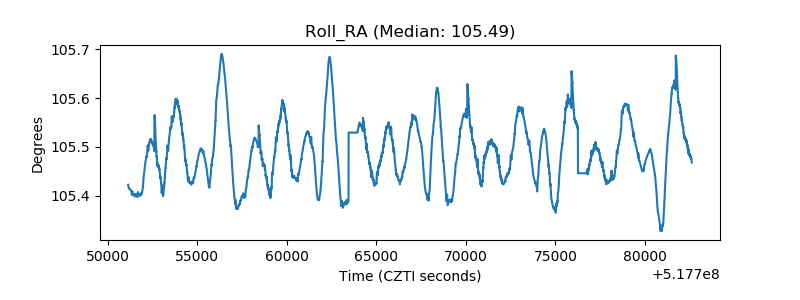 |
| Veto Counter | 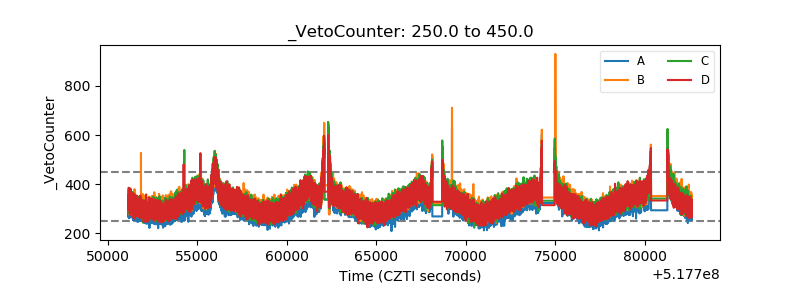 |