| Param | Original file | Final file |
|---|---|---|
| Filename | modeM0/AS1A14_125T09_9000006578_57727cztM0_level2.fits | modeM0/AS1A14_125T09_9000006578_57727cztM0_level2_quad_clean.evt |
| Size (bytes) | 513,368,640 | 93,481,920 |
| Size | 489.6 MB | 89.2 MB |
| Events in quadrant A | 2,837,646 | 650,302 |
| Events in quadrant B | 3,881,394 | 677,306 |
| Events in quadrant C | 7,540,715 | 527,479 |
| Events in quadrant D | 4,254,874 | 536,626 |
| Mode M9 | |||
|---|---|---|---|
| Quadrant | BADHDUFLAG | Total packets | Discarded packets |
| A | 0 | 15 | 0 |
| B | 0 | 16 | 0 |
| C | 0 | 16 | 0 |
| D | 0 | 16 | 0 |
| Mode SS | |||
|---|---|---|---|
| Quadrant | BADHDUFLAG | Total packets | Discarded packets |
| A | 0 | 128 | 0 |
| B | 0 | 128 | 0 |
| C | 0 | 128 | 0 |
| D | 0 | 128 | 0 |
| Mode M0 | |||
|---|---|---|---|
| Quadrant | BADHDUFLAG | Total packets | Discarded packets |
| A | 0 | 12917 | 2 |
| B | 0 | 15816 | 2 |
| C | 0 | 26745 | 2 |
| D | 0 | 17111 | 2 |
| Quadrant | Total seconds | Saturated seconds | Saturation percentage |
|---|---|---|---|
| A | 6288 | 28 | 0.445293% |
| B | 6288 | 272 | 4.325700% |
| C | 6288 | 1235 | 19.640585% |
| D | 6288 | 500 | 7.951654% |
Noise dominated data is calculated using 1-second bins in cleaned event files. If a bin has >2000 counts, and if more than 50% of those come from <1% of pixels, then it is considered to be noise-dominated and hence unusable.
| Quadrant | # 1 sec bins | Bins with >0 counts | Bins with >2000 counts | High rate bins dominated by noise | Noise dominated (total time) | Noise dominated (detector-on time) | Marked lightcurve |
|---|---|---|---|---|---|---|---|
| A | 7498 | 6289 | 5 | 5 | 0.07% | 0.08% | 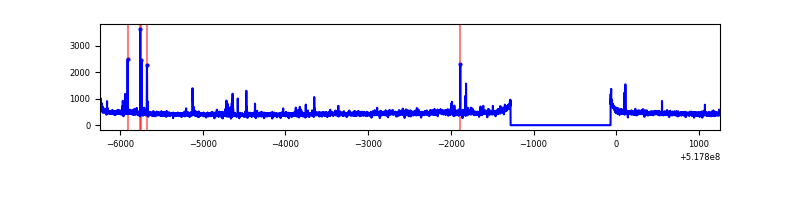 |
| B | 7498 | 6289 | 139 | 139 | 1.85% | 2.21% | 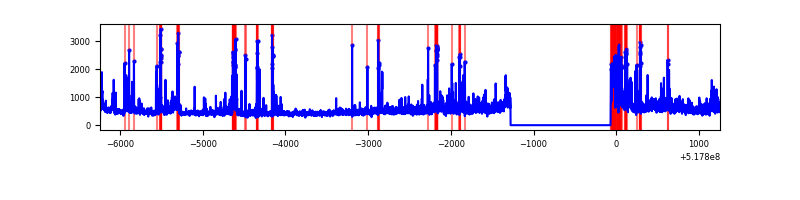 |
| C | 7498 | 6289 | 1151 | 1151 | 15.35% | 18.30% | 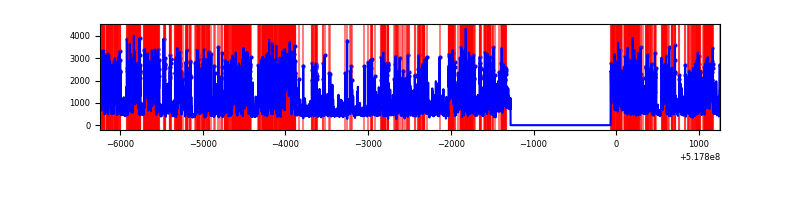 |
| D | 7498 | 6289 | 429 | 429 | 5.72% | 6.82% | 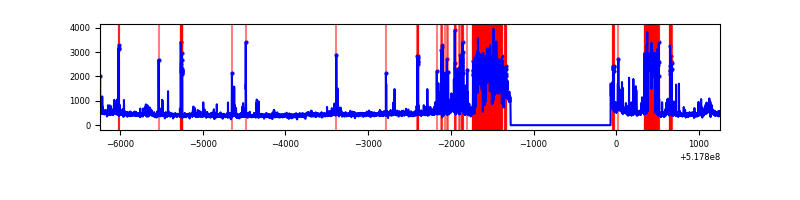 |
Top three noisy pixels from each quadrant. If the there are fewer than three noisy pixels in the level2.evt file, extra rows are filled as -1
| Pixel properties | Quadrant properties | ||||||
|---|---|---|---|---|---|---|---|
| Quadrant | DetID | PixID | Counts | Sigma | Mean | Median | Sigma |
| A | 3 | 128 | 47283 | 268.77 | 699 | 683 | 173.4 |
| A | 3 | 61 | 35641 | 201.63 | 699 | 683 | 173.4 |
| A | 3 | 245 | 29486 | 166.13 | 699 | 683 | 173.4 |
| B | 4 | 171 | 332225 | 2311.32 | 680 | 655 | 143.5 |
| B | 4 | 80 | 226109 | 1571.6 | 680 | 655 | 143.5 |
| B | 0 | 155 | 162253 | 1126.47 | 680 | 655 | 143.5 |
| C | 15 | 224 | 2548331 | 14730.24 | 635 | 628 | 173.0 |
| C | 12 | 254 | 2300935 | 13299.85 | 635 | 628 | 173.0 |
| C | 14 | 254 | 145747 | 839.05 | 635 | 628 | 173.0 |
| D | 8 | 160 | 685138 | 3699.31 | 657 | 627 | 185.0 |
| D | 8 | 240 | 431660 | 2329.43 | 657 | 627 | 185.0 |
| D | 3 | 224 | 260017 | 1401.82 | 657 | 627 | 185.0 |
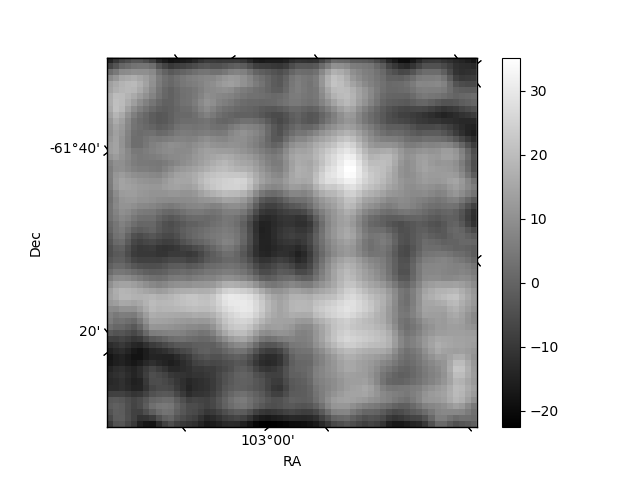
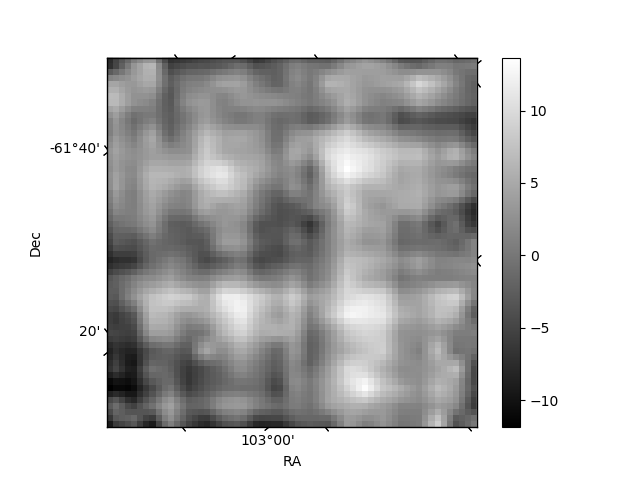
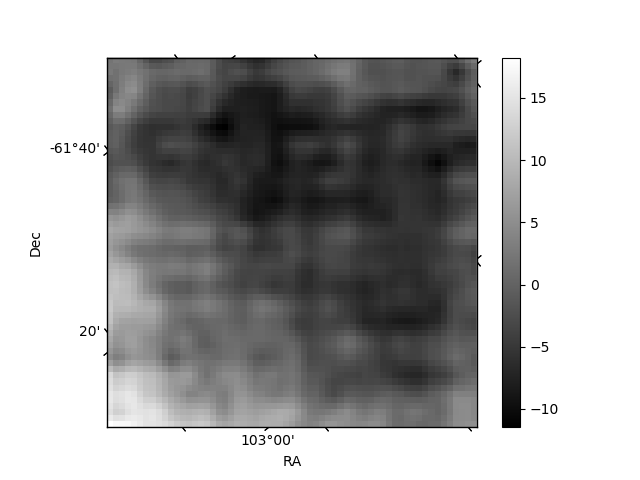
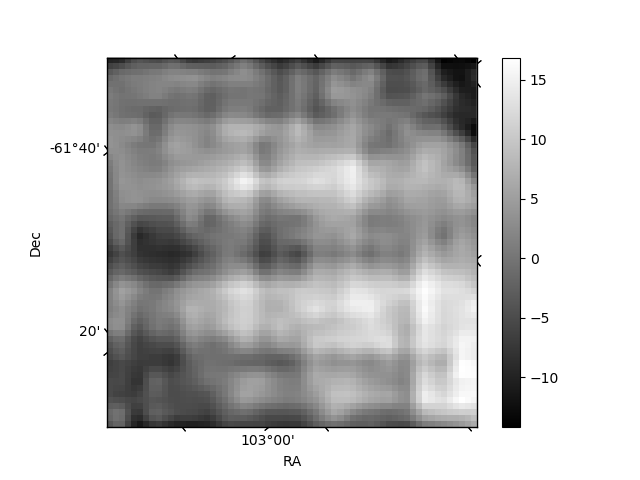
Histogram calculated using DETX and DETY for each event in the final _common_clean file
| Quadrant A | 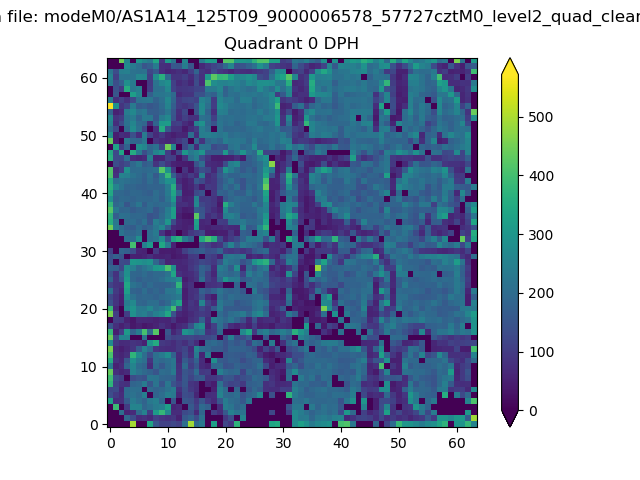 |
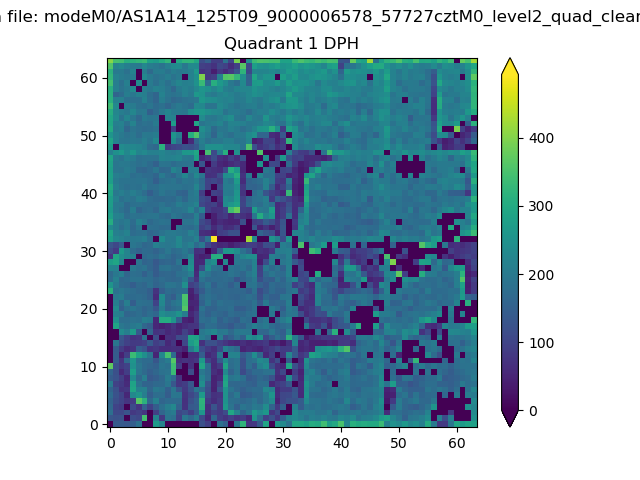 |
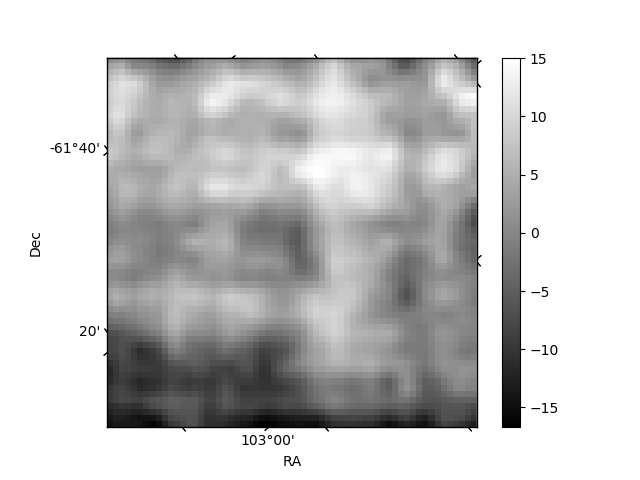
Quadrant B |
|---|---|---|---|
| Quadrant D | 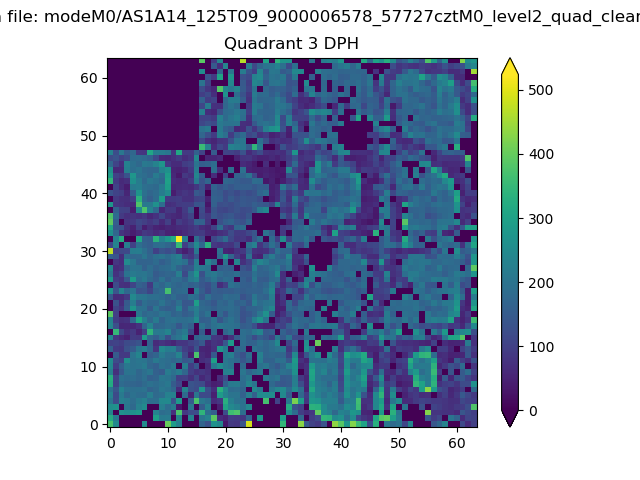 |
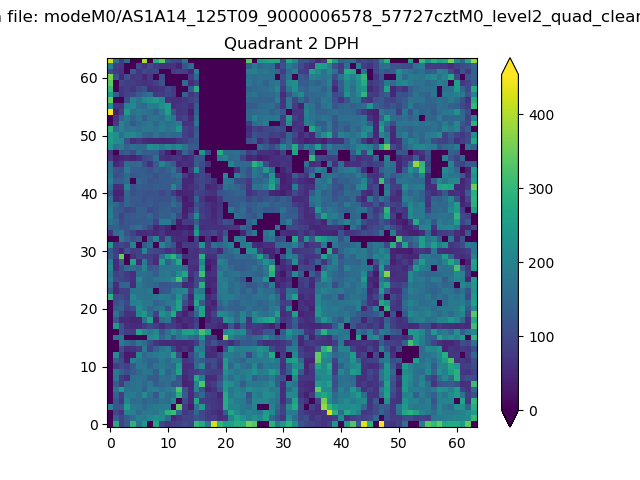 |
Quadrant C |
| Plot type | Count rate plots | Images |
|---|---|---|
| Comparison with Poisson distribution Blue bars denote a histogram of data divided into 1 sec bins. Red curve is a Poisson curve with rate = median count rate of data. |
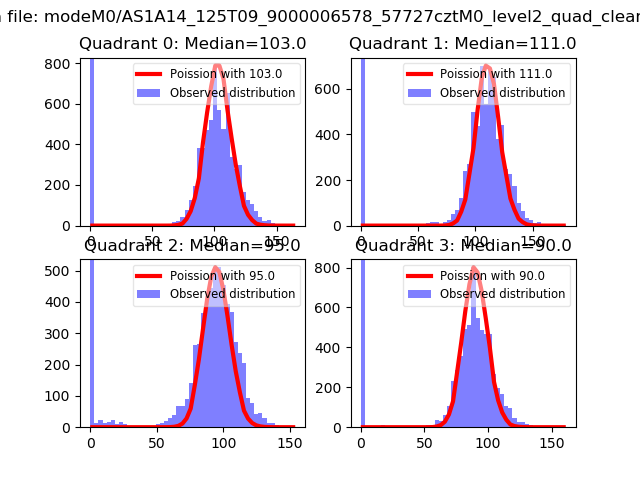 |
 |
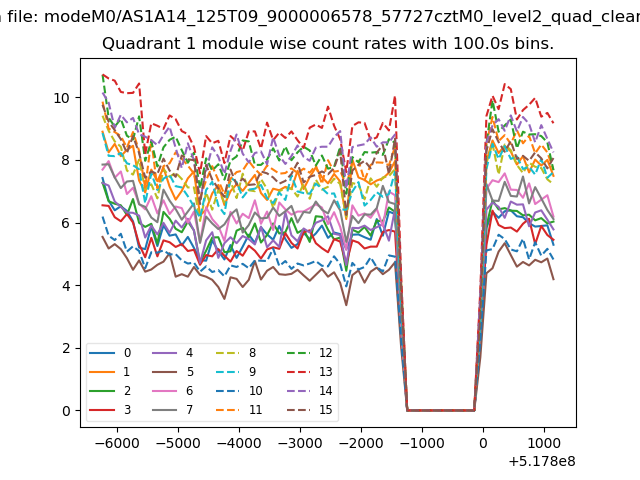
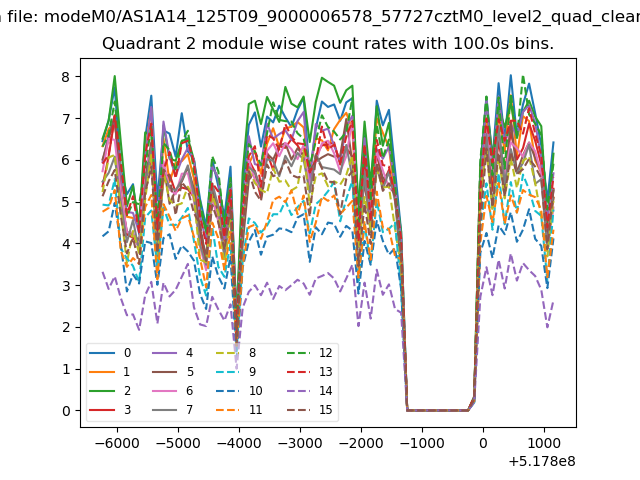
| Quadrant-wise count rates Data is divided into 100 sec bins |
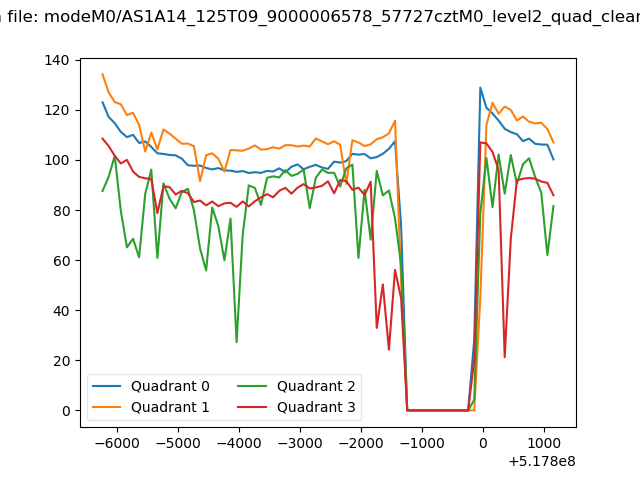 |
|
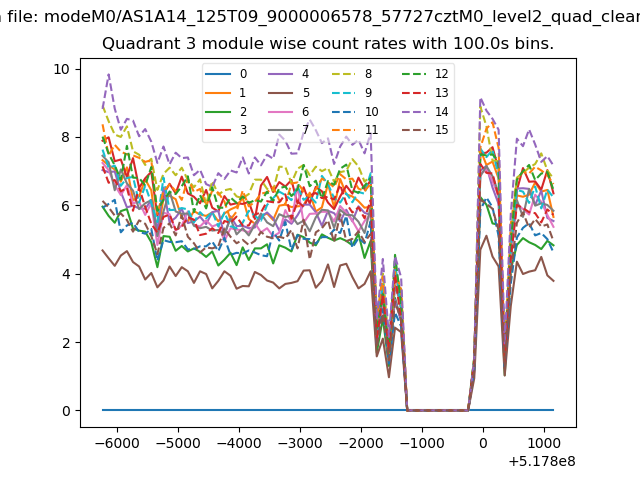
| Module-wise count rates for Quadrant A Data is divided into 100 sec bins |
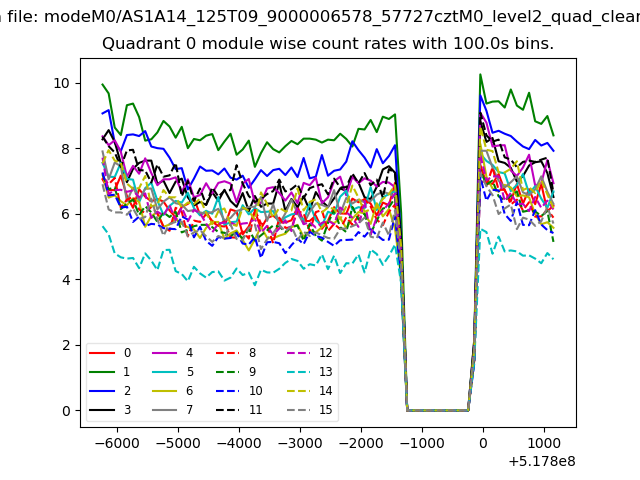 |
 |
| Module-wise count rates for Quadrant B Data is divided into 100 sec bins |
 |
 |
| Module-wise count rates for Quadrant C Data is divided into 100 sec bins |
 |
 |
| Module-wise count rates for Quadrant D Data is divided into 100 sec bins |
 |
 |
| Parameter | Plot |
|---|---|
| CZT HV Monitor | 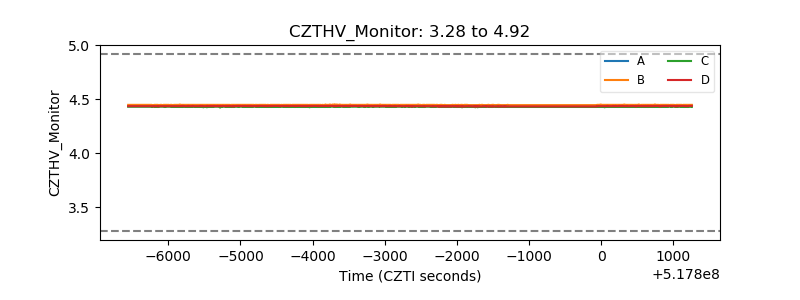 |
| D_VDD | 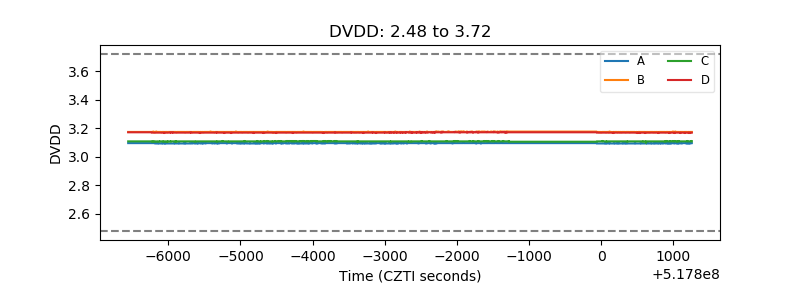 |
| Temperature 1 | 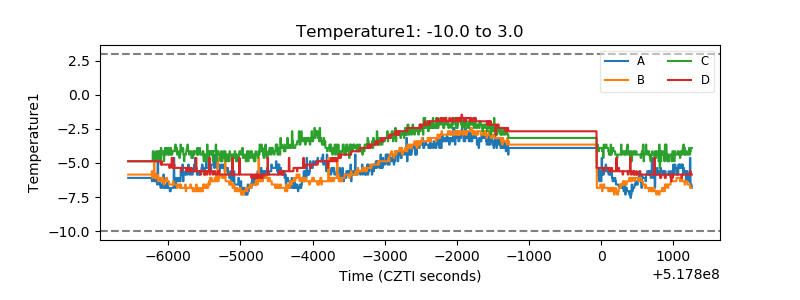 |
| Veto HV Monitor | 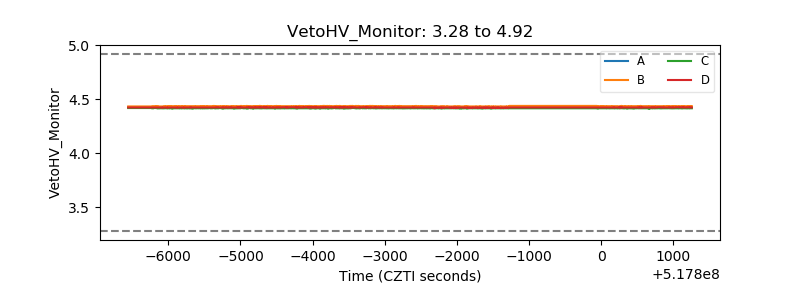 |
| Veto LLD | 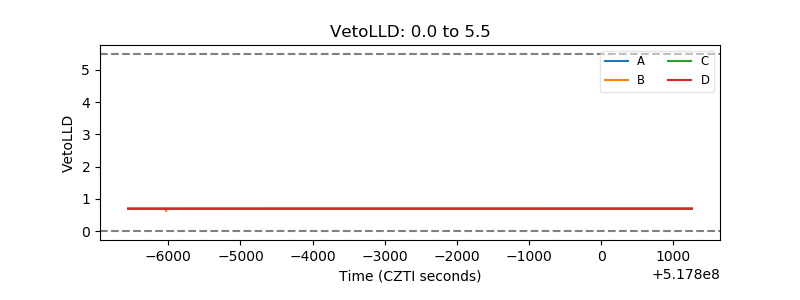 |
| Alpha Counter | 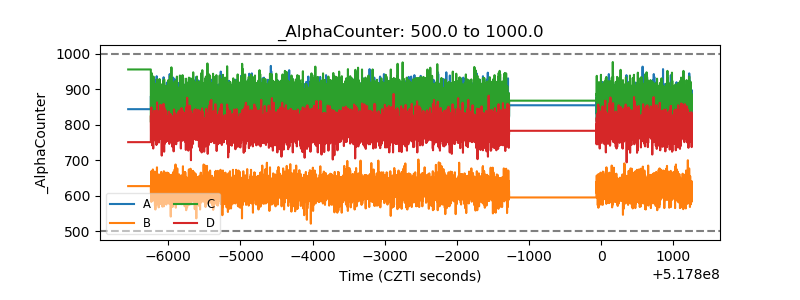 |
| _CPM_Rate | 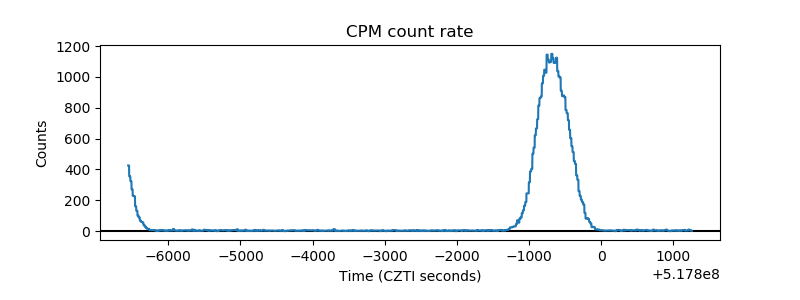 |
| CZT Counter | 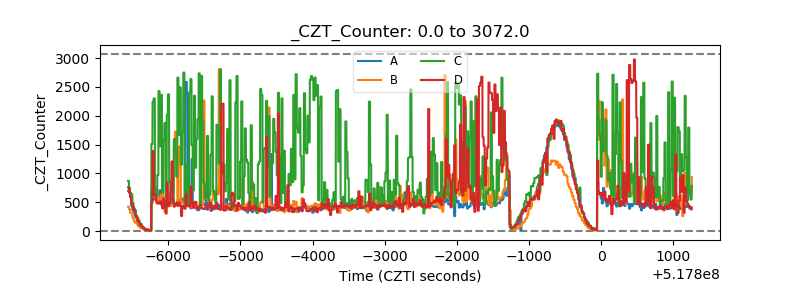 |
| +2.5 Volts monitor |  |
| +5 Volts monitor |  |
| _ROLL_ROT | 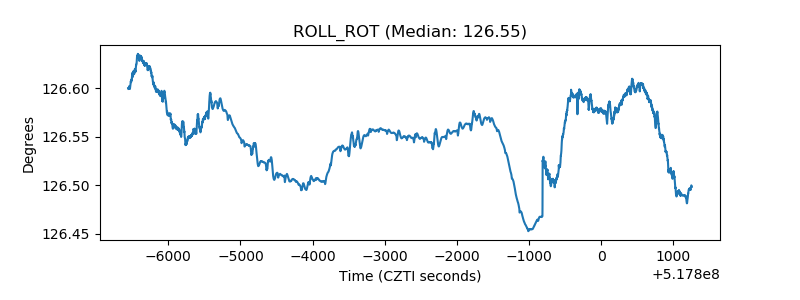 |
| _Roll_DEC | 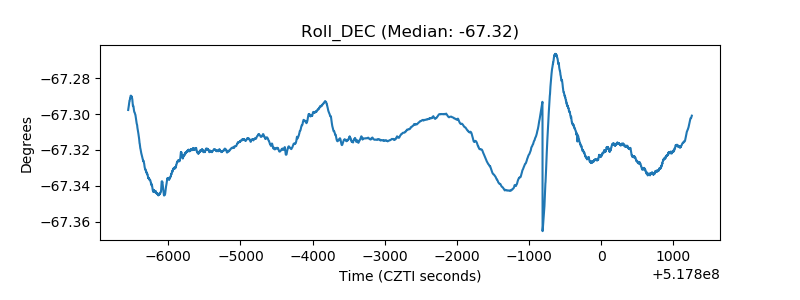 |
| _Roll_RA | 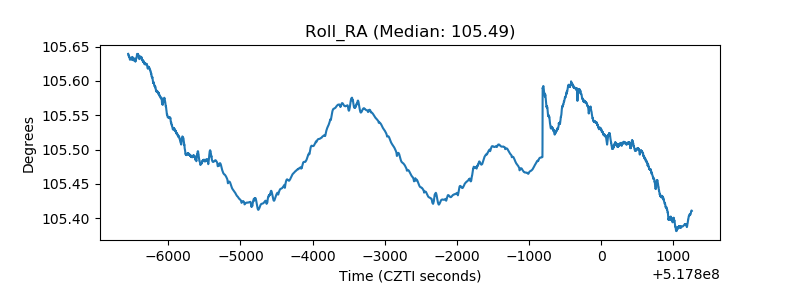 |
| Veto Counter | 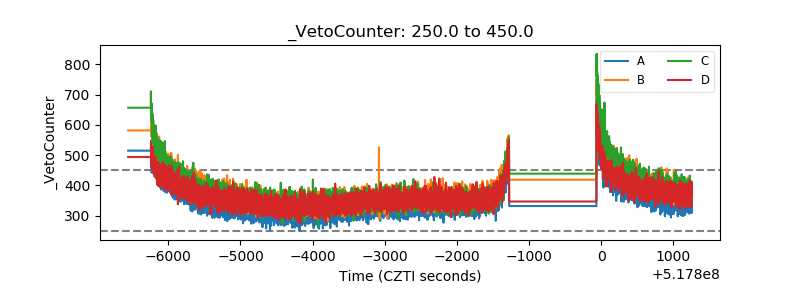 |