| Param | Original file | Final file |
|---|---|---|
| Filename | modeM0/AS1A14_125T09_9000006578_57728cztM0_level2.fits | modeM0/AS1A14_125T09_9000006578_57728cztM0_level2_quad_clean.evt |
| Size (bytes) | 574,312,320 | 96,122,880 |
| Size | 547.7 MB | 91.7 MB |
| Events in quadrant A | 2,973,425 | 669,330 |
| Events in quadrant B | 4,208,140 | 692,293 |
| Events in quadrant C | 8,224,144 | 526,834 |
| Events in quadrant D | 5,351,900 | 570,416 |
| Mode M9 | |||
|---|---|---|---|
| Quadrant | BADHDUFLAG | Total packets | Discarded packets |
| A | 0 | 14 | 0 |
| B | 0 | 15 | 0 |
| C | 0 | 15 | 0 |
| D | 0 | 15 | 0 |
| Mode SS | |||
|---|---|---|---|
| Quadrant | BADHDUFLAG | Total packets | Discarded packets |
| A | 0 | 134 | 0 |
| B | 0 | 134 | 0 |
| C | 0 | 134 | 0 |
| D | 0 | 134 | 0 |
| Mode M0 | |||
|---|---|---|---|
| Quadrant | BADHDUFLAG | Total packets | Discarded packets |
| A | 0 | 13472 | 2 |
| B | 0 | 16862 | 2 |
| C | 0 | 28872 | 3 |
| D | 0 | 20291 | 2 |
| Quadrant | Total seconds | Saturated seconds | Saturation percentage |
|---|---|---|---|
| A | 6466 | 69 | 1.067120% |
| B | 6466 | 319 | 4.933498% |
| C | 6465 | 1538 | 23.789637% |
| D | 6465 | 407 | 6.295437% |
Noise dominated data is calculated using 1-second bins in cleaned event files. If a bin has >2000 counts, and if more than 50% of those come from <1% of pixels, then it is considered to be noise-dominated and hence unusable.
| Quadrant | # 1 sec bins | Bins with >0 counts | Bins with >2000 counts | High rate bins dominated by noise | Noise dominated (total time) | Noise dominated (detector-on time) | Marked lightcurve |
|---|---|---|---|---|---|---|---|
| A | 7636 | 6466 | 3 | 3 | 0.04% | 0.05% | 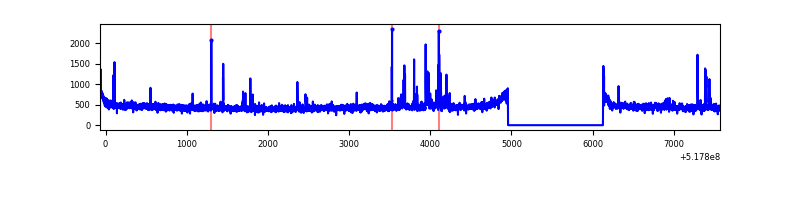 |
| B | 7636 | 6466 | 107 | 107 | 1.40% | 1.65% | 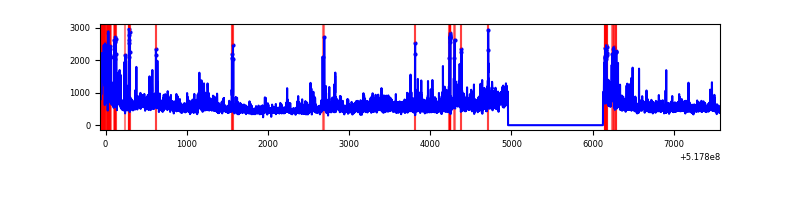 |
| C | 7635 | 6465 | 1332 | 1332 | 17.45% | 20.60% | 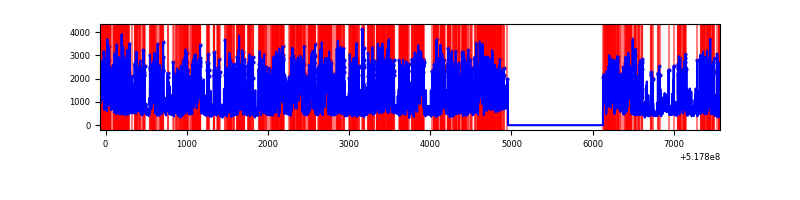 |
| D | 7635 | 6465 | 374 | 374 | 4.90% | 5.78% | 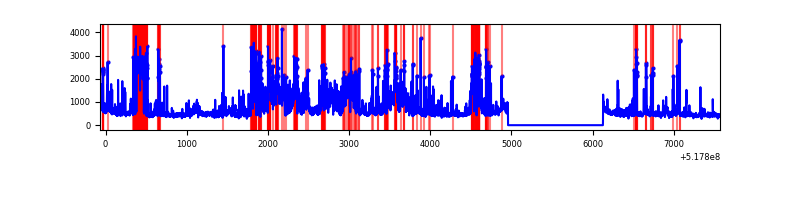 |
Top three noisy pixels from each quadrant. If the there are fewer than three noisy pixels in the level2.evt file, extra rows are filled as -1
| Pixel properties | Quadrant properties | ||||||
|---|---|---|---|---|---|---|---|
| Quadrant | DetID | PixID | Counts | Sigma | Mean | Median | Sigma |
| A | 7 | 223 | 87464 | 488.47 | 728 | 710 | 177.6 |
| A | 3 | 128 | 30255 | 166.35 | 728 | 710 | 177.6 |
| A | 3 | 61 | 17929 | 96.95 | 728 | 710 | 177.6 |
| B | 4 | 80 | 605969 | 4080.77 | 704 | 677 | 148.3 |
| B | 10 | 16 | 285171 | 1918.01 | 704 | 677 | 148.3 |
| B | 4 | 171 | 220957 | 1485.09 | 704 | 677 | 148.3 |
| C | 12 | 254 | 3553023 | 19992.84 | 650 | 643 | 177.7 |
| C | 15 | 224 | 1963376 | 11046.28 | 650 | 643 | 177.7 |
| C | 14 | 254 | 105137 | 588.09 | 650 | 643 | 177.7 |
| D | 8 | 160 | 1967159 | 10148.07 | 694 | 665 | 193.8 |
| D | 8 | 240 | 232707 | 1197.45 | 694 | 665 | 193.8 |
| D | 3 | 224 | 163018 | 837.82 | 694 | 665 | 193.8 |
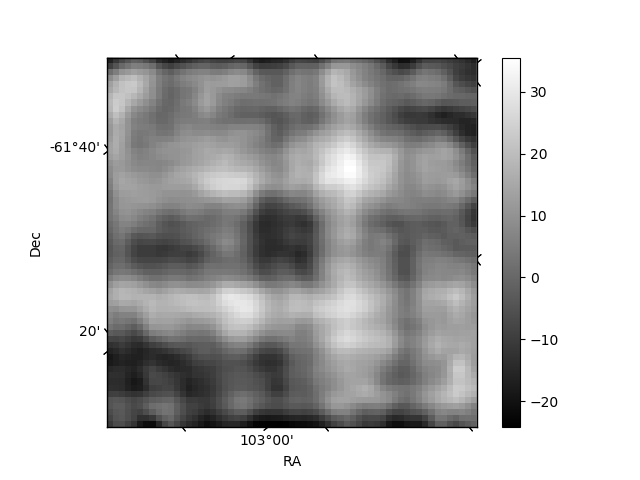
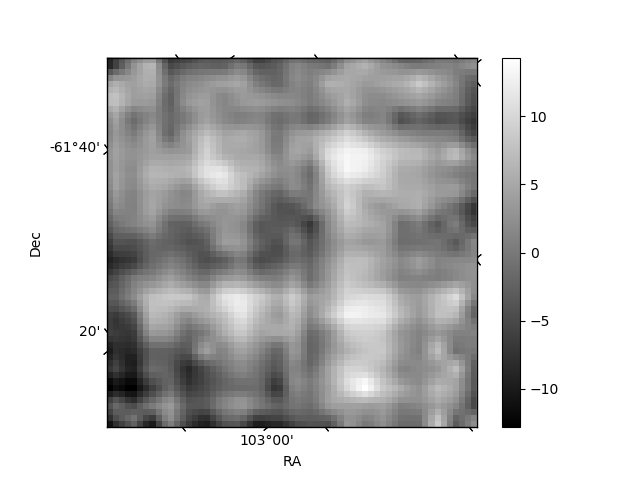
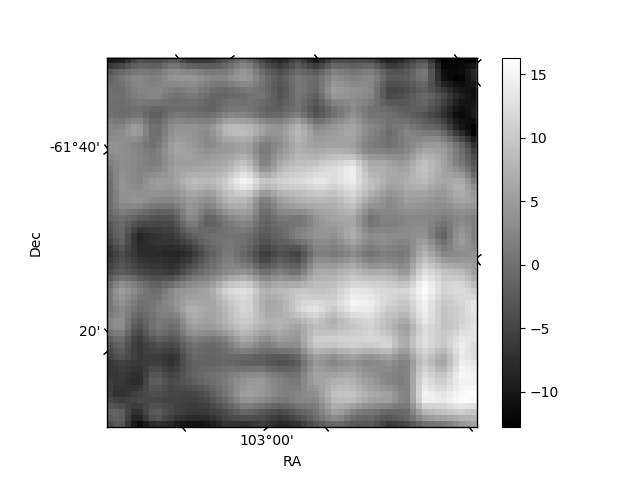
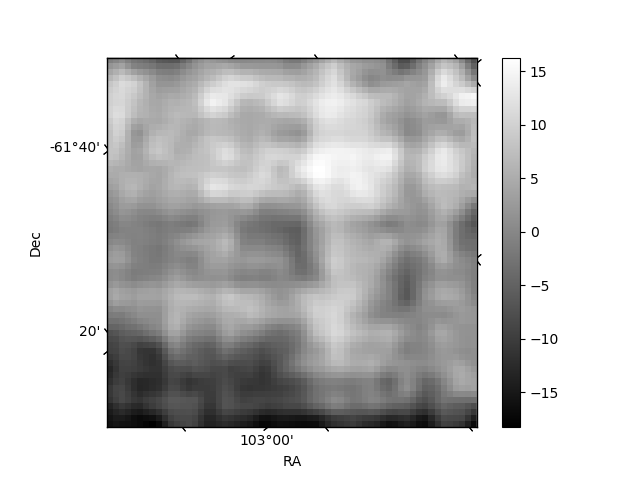
Histogram calculated using DETX and DETY for each event in the final _common_clean file
| Quadrant A | 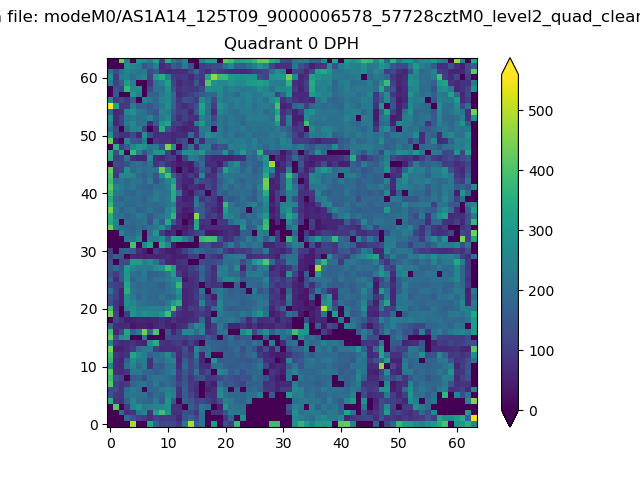 |
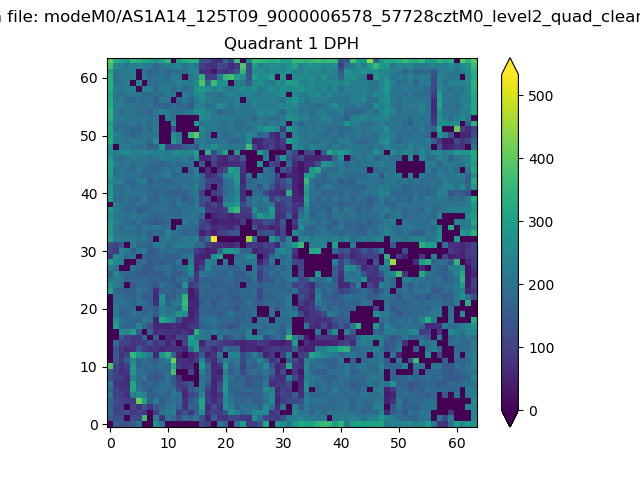 |
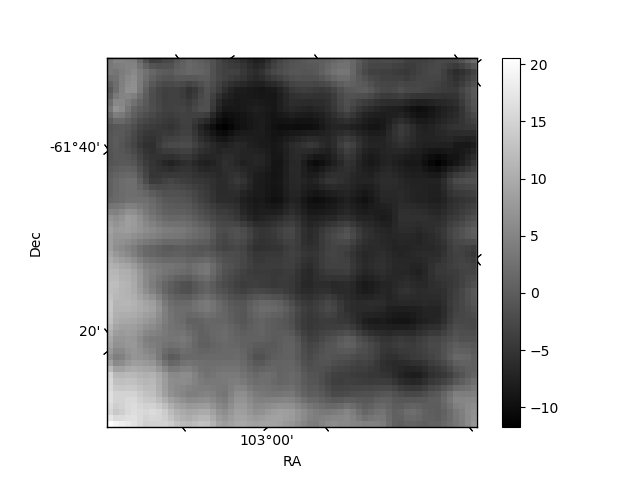
Quadrant B |
|---|---|---|---|
| Quadrant D | 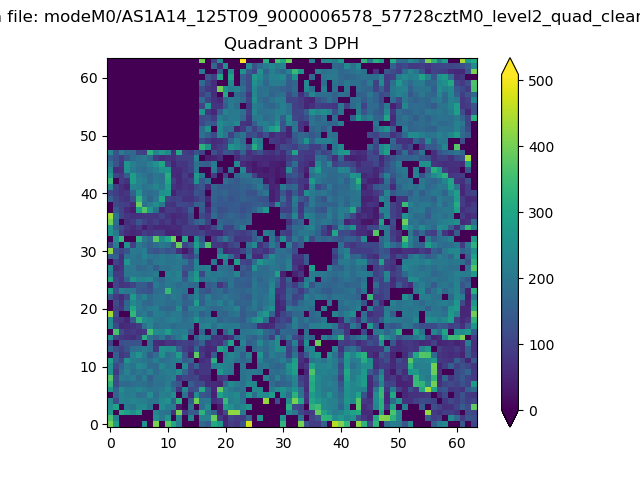 |
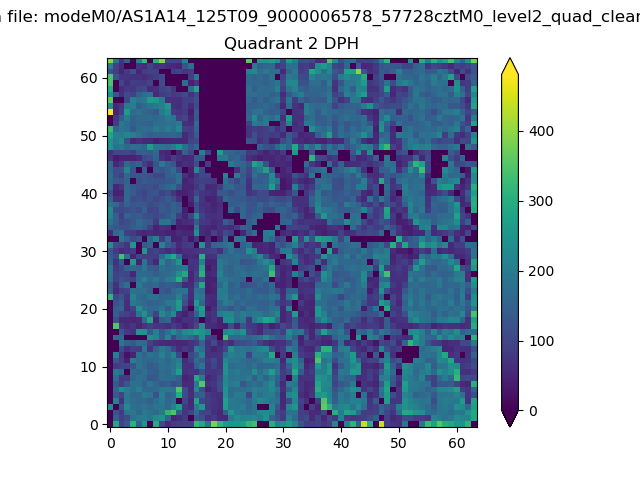 |
Quadrant C |
| Plot type | Count rate plots | Images |
|---|---|---|
| Comparison with Poisson distribution Blue bars denote a histogram of data divided into 1 sec bins. Red curve is a Poisson curve with rate = median count rate of data. |
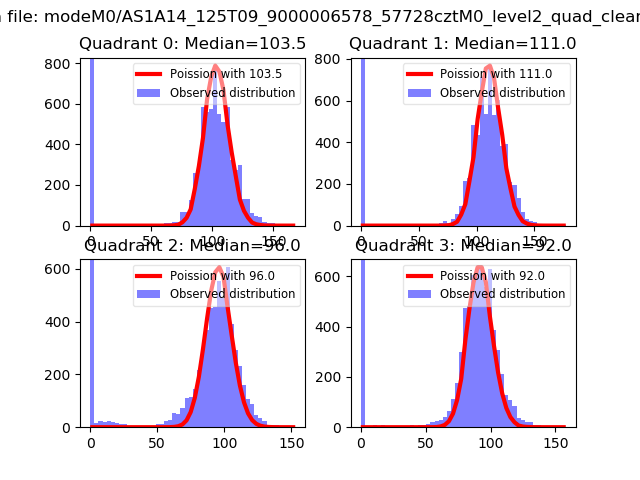 |
 |
| Quadrant-wise count rates Data is divided into 100 sec bins |
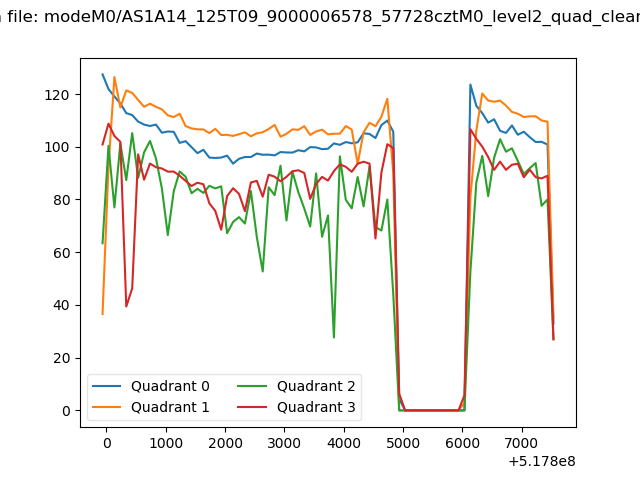 |
|
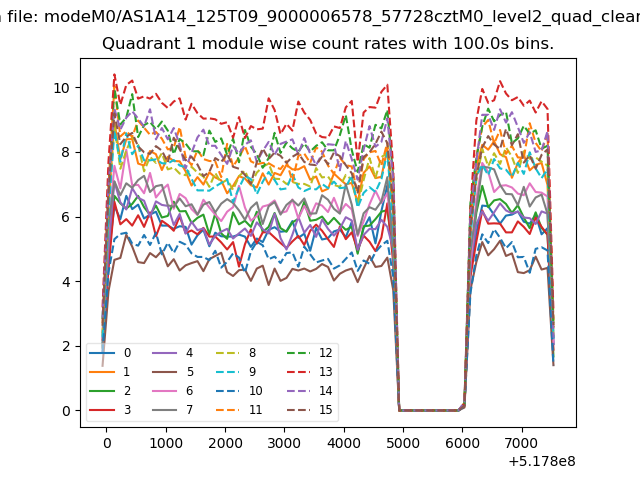
| Module-wise count rates for Quadrant A Data is divided into 100 sec bins |
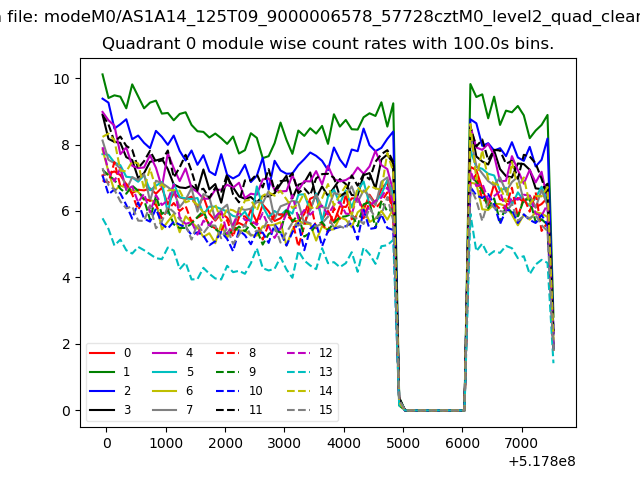 |
 |
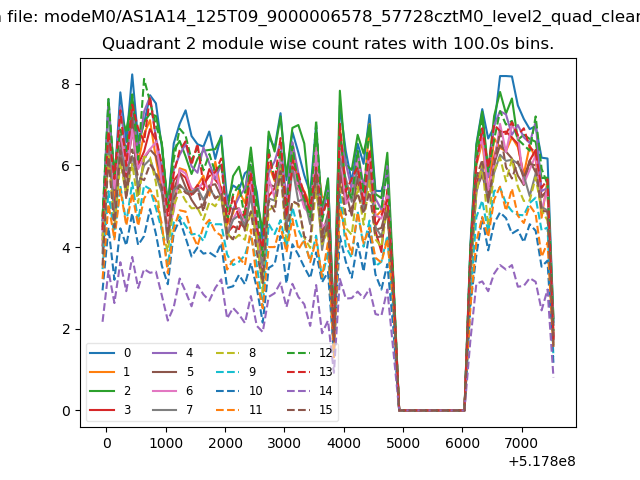
| Module-wise count rates for Quadrant B Data is divided into 100 sec bins |
 |
 |
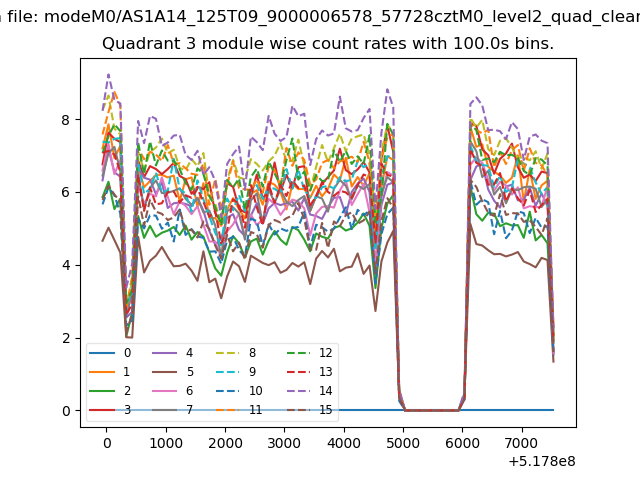
| Module-wise count rates for Quadrant C Data is divided into 100 sec bins |
 |
 |
| Module-wise count rates for Quadrant D Data is divided into 100 sec bins |
 |
 |
| Parameter | Plot |
|---|---|
| CZT HV Monitor | 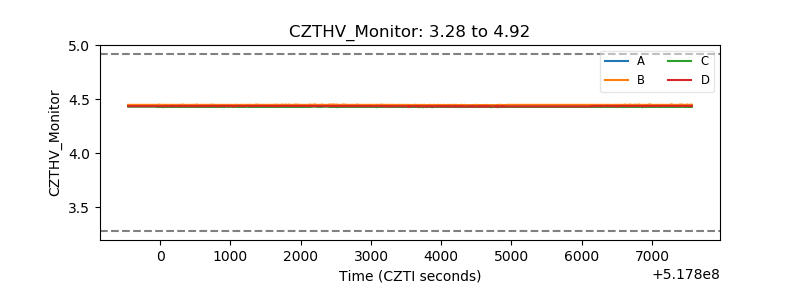 |
| D_VDD | 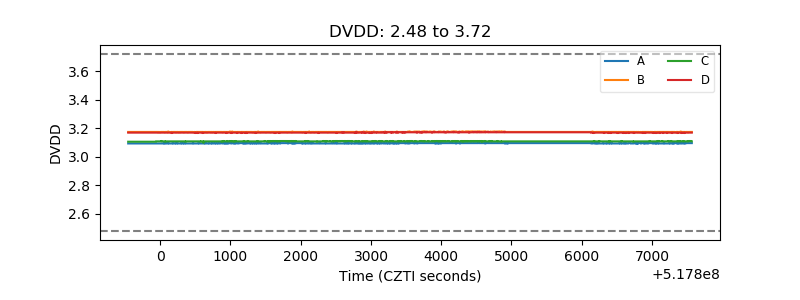 |
| Temperature 1 | 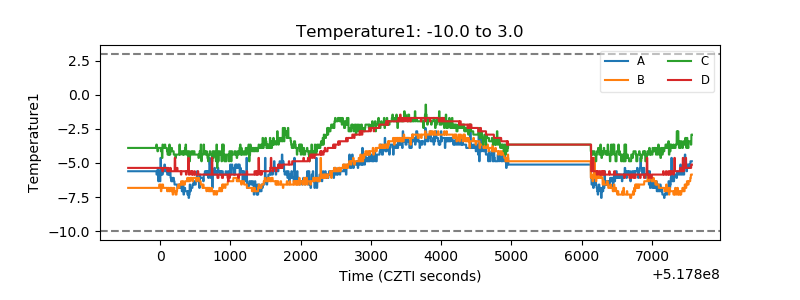 |
| Veto HV Monitor | 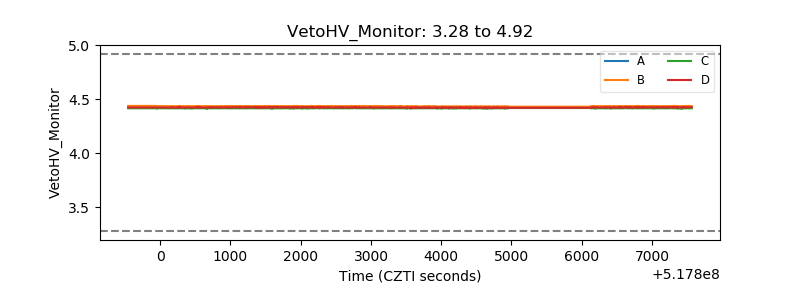 |
| Veto LLD | 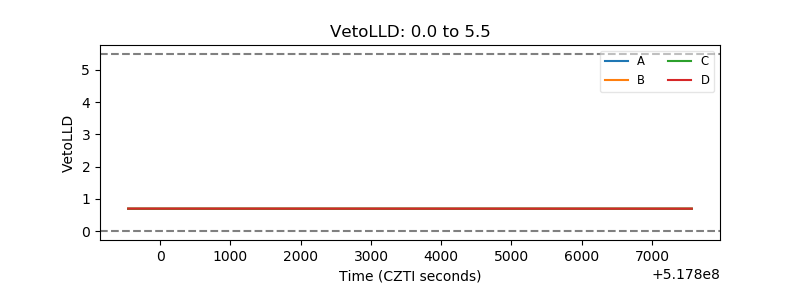 |
| Alpha Counter | 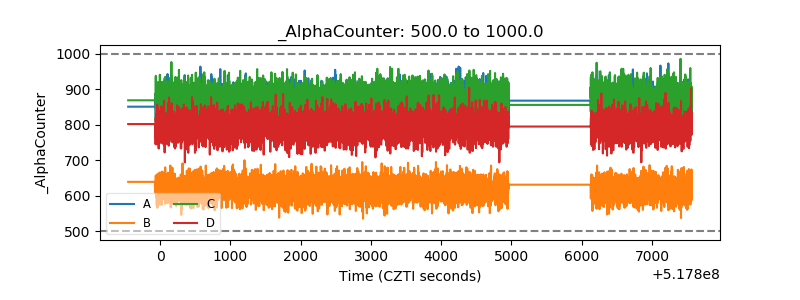 |
| _CPM_Rate | 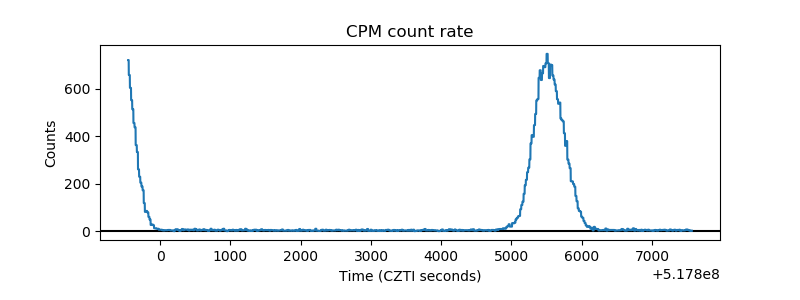 |
| CZT Counter | 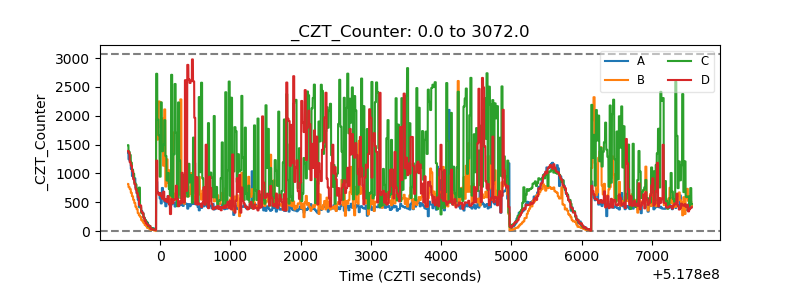 |
| +2.5 Volts monitor |  |
| +5 Volts monitor | 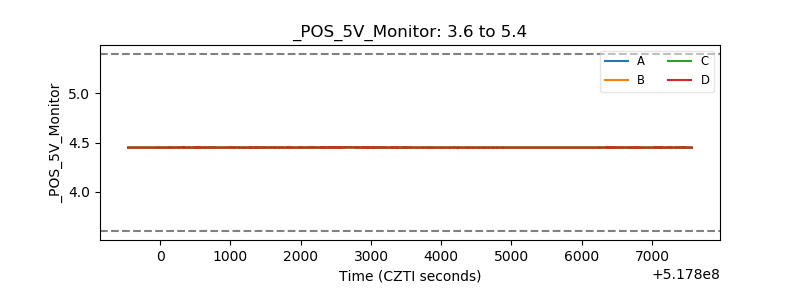 |
| _ROLL_ROT | 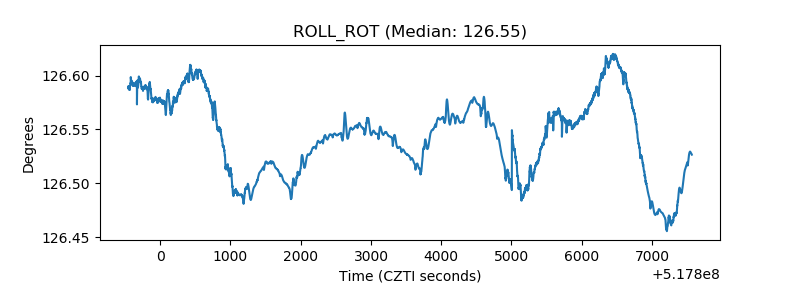 |
| _Roll_DEC | 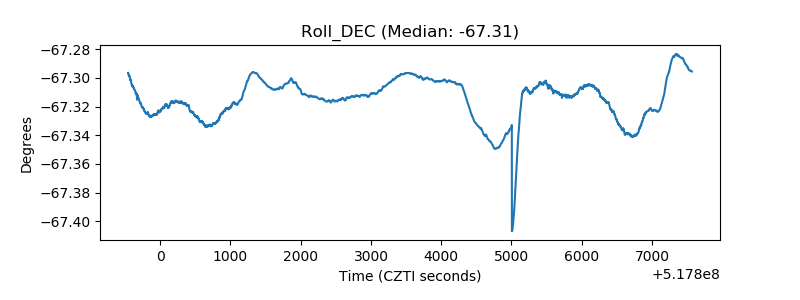 |
| _Roll_RA | 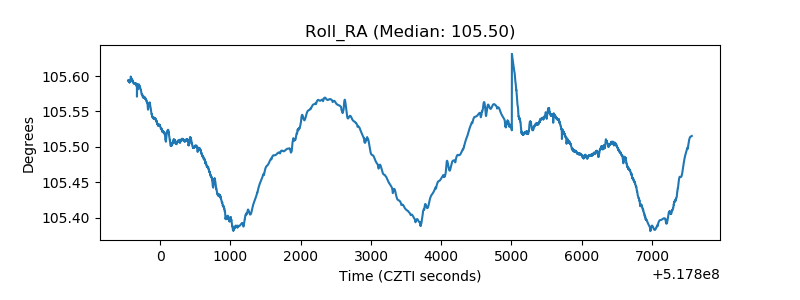 |
| Veto Counter | 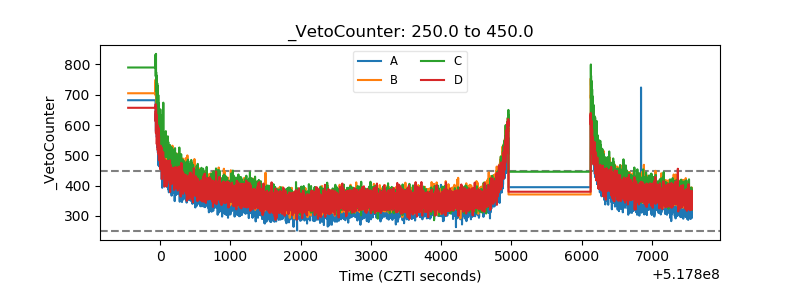 |