| Param | Original file | Final file |
|---|---|---|
| Filename | modeM0/AS1A14_125T09_9000006578_57729cztM0_level2.fits | modeM0/AS1A14_125T09_9000006578_57729cztM0_level2_quad_clean.evt |
| Size (bytes) | 529,122,240 | 98,844,480 |
| Size | 504.6 MB | 94.3 MB |
| Events in quadrant A | 3,016,455 | 671,808 |
| Events in quadrant B | 3,557,685 | 718,437 |
| Events in quadrant C | 8,784,251 | 538,273 |
| Events in quadrant D | 3,710,161 | 599,480 |
| Mode M9 | |||
|---|---|---|---|
| Quadrant | BADHDUFLAG | Total packets | Discarded packets |
| A | 0 | 21 | 0 |
| B | 0 | 22 | 0 |
| C | 0 | 22 | 0 |
| D | 0 | 22 | 0 |
| Mode SS | |||
|---|---|---|---|
| Quadrant | BADHDUFLAG | Total packets | Discarded packets |
| A | 0 | 136 | 0 |
| B | 0 | 136 | 0 |
| C | 0 | 136 | 0 |
| D | 0 | 134 | 0 |
| Mode M0 | |||
|---|---|---|---|
| Quadrant | BADHDUFLAG | Total packets | Discarded packets |
| A | 0 | 13823 | 2 |
| B | 0 | 15023 | 2 |
| C | 0 | 30700 | 2 |
| D | 0 | 15669 | 2 |
| Quadrant | Total seconds | Saturated seconds | Saturation percentage |
|---|---|---|---|
| A | 6670 | 60 | 0.899550% |
| B | 6670 | 160 | 2.398801% |
| C | 6670 | 1470 | 22.038981% |
| D | 6669 | 84 | 1.259559% |
Noise dominated data is calculated using 1-second bins in cleaned event files. If a bin has >2000 counts, and if more than 50% of those come from <1% of pixels, then it is considered to be noise-dominated and hence unusable.
| Quadrant | # 1 sec bins | Bins with >0 counts | Bins with >2000 counts | High rate bins dominated by noise | Noise dominated (total time) | Noise dominated (detector-on time) | Marked lightcurve |
|---|---|---|---|---|---|---|---|
| A | 7815 | 6671 | 11 | 11 | 0.14% | 0.16% | 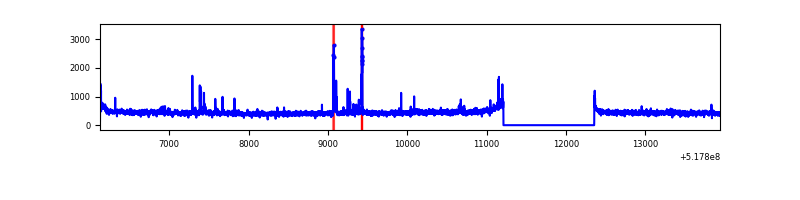 |
| B | 7815 | 6671 | 34 | 34 | 0.44% | 0.51% | 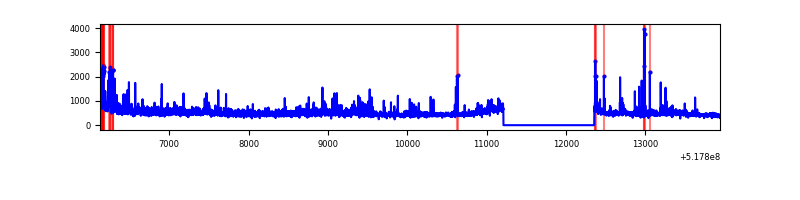 |
| C | 7815 | 6670 | 1322 | 1322 | 16.92% | 19.82% | 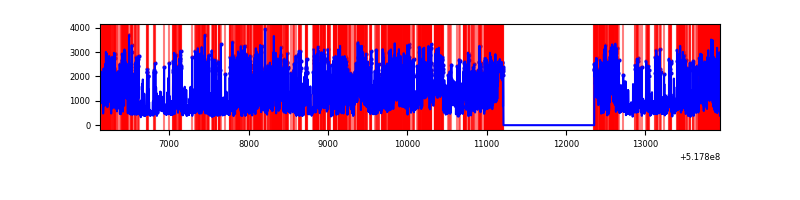 |
| D | 7814 | 6670 | 50 | 50 | 0.64% | 0.75% | 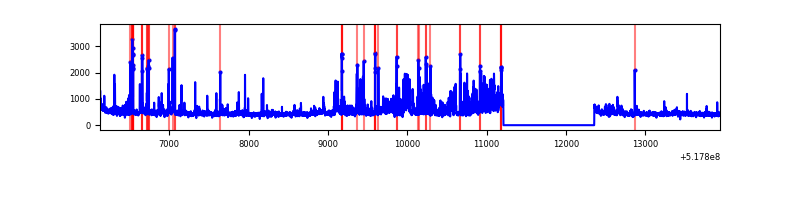 |
Top three noisy pixels from each quadrant. If the there are fewer than three noisy pixels in the level2.evt file, extra rows are filled as -1
| Pixel properties | Quadrant properties | ||||||
|---|---|---|---|---|---|---|---|
| Quadrant | DetID | PixID | Counts | Sigma | Mean | Median | Sigma |
| A | 7 | 223 | 112498 | 621.84 | 738 | 720 | 179.8 |
| A | 3 | 128 | 31607 | 171.83 | 738 | 720 | 179.8 |
| A | 3 | 137 | 8661 | 44.18 | 738 | 720 | 179.8 |
| B | 4 | 80 | 255188 | 1668.33 | 725 | 699 | 152.5 |
| B | 10 | 16 | 183579 | 1198.89 | 725 | 699 | 152.5 |
| B | 0 | 171 | 76037 | 493.88 | 725 | 699 | 152.5 |
| C | 12 | 254 | 3378344 | 18718.3 | 663 | 656 | 180.4 |
| C | 15 | 224 | 1946317 | 10782.37 | 663 | 656 | 180.4 |
| C | 9 | 38 | 628217 | 3477.79 | 663 | 656 | 180.4 |
| D | 3 | 224 | 456471 | 2286.45 | 716 | 683 | 199.3 |
| D | 8 | 160 | 125026 | 623.76 | 716 | 683 | 199.3 |
| D | 3 | 12 | 106853 | 532.6 | 716 | 683 | 199.3 |
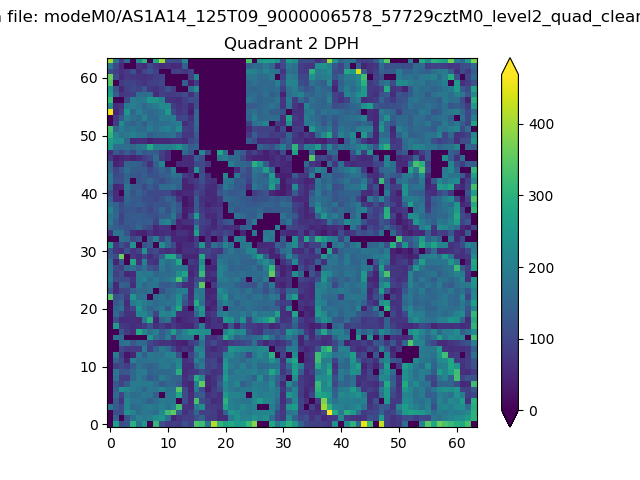
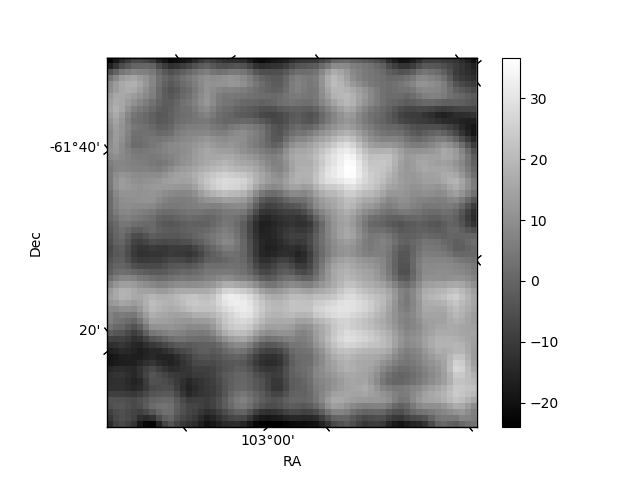
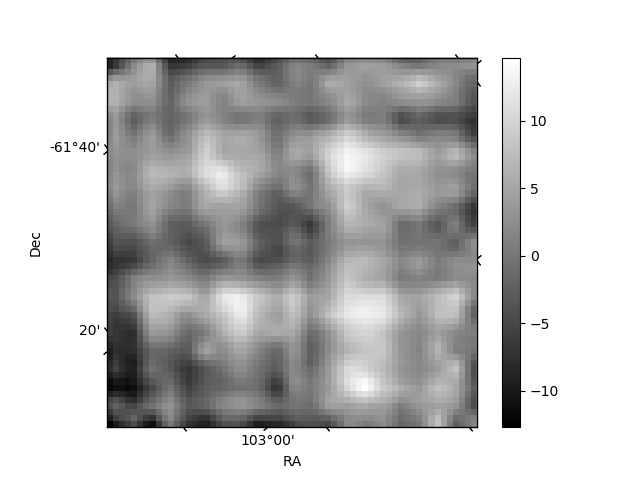
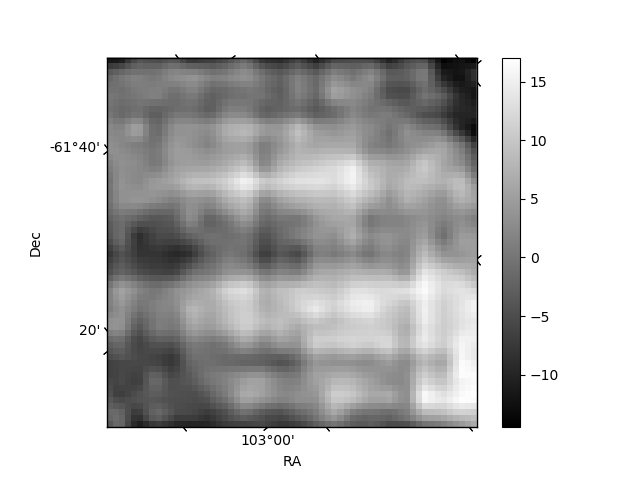
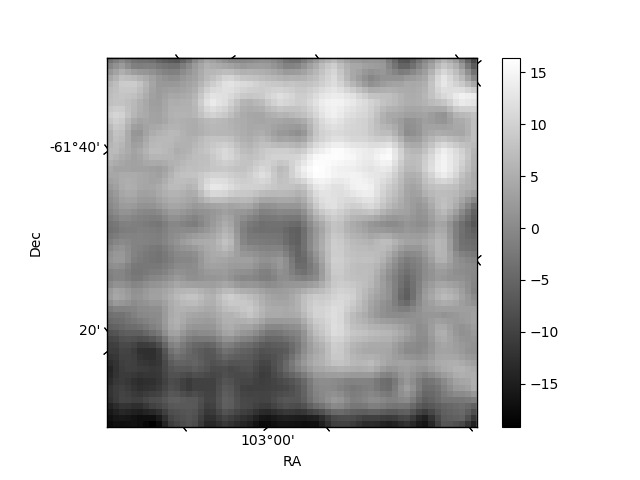
Histogram calculated using DETX and DETY for each event in the final _common_clean file
| Quadrant A | 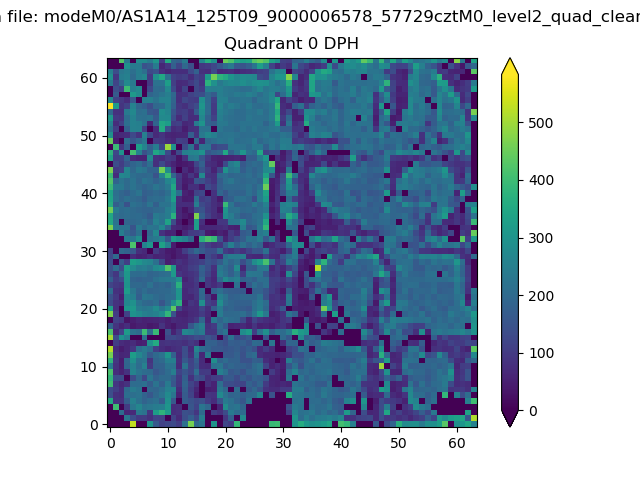 |
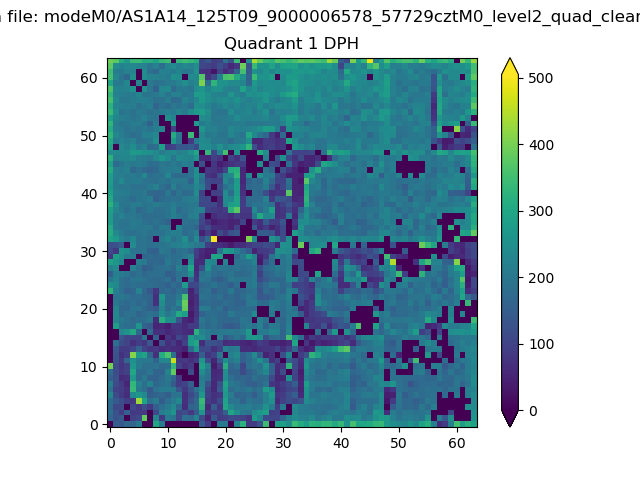 |
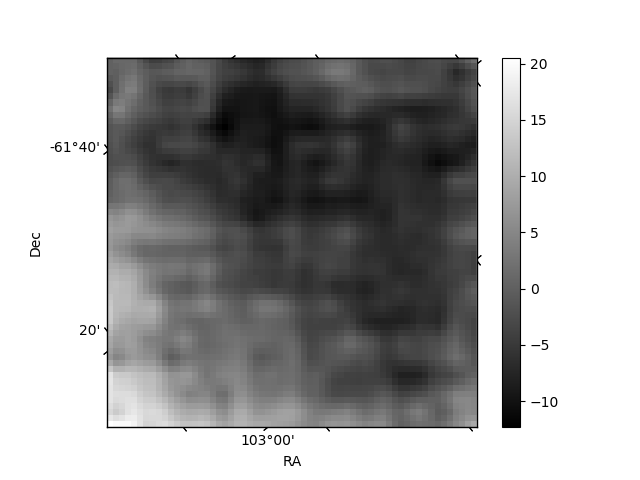
Quadrant B |
|---|---|---|---|
| Quadrant D | 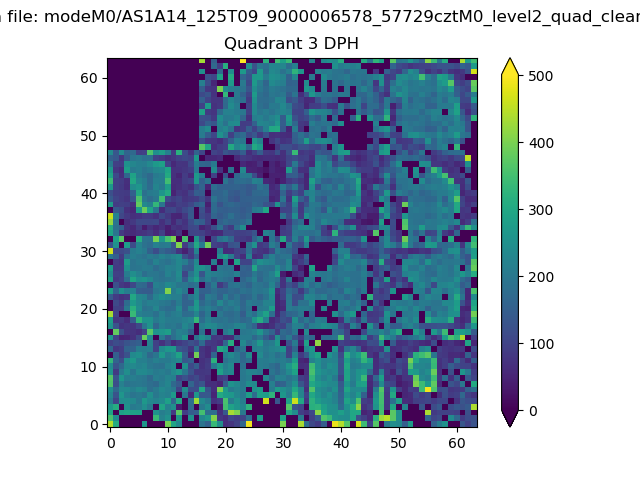 |
 |
Quadrant C |
| Plot type | Count rate plots | Images |
|---|---|---|
| Comparison with Poisson distribution Blue bars denote a histogram of data divided into 1 sec bins. Red curve is a Poisson curve with rate = median count rate of data. |
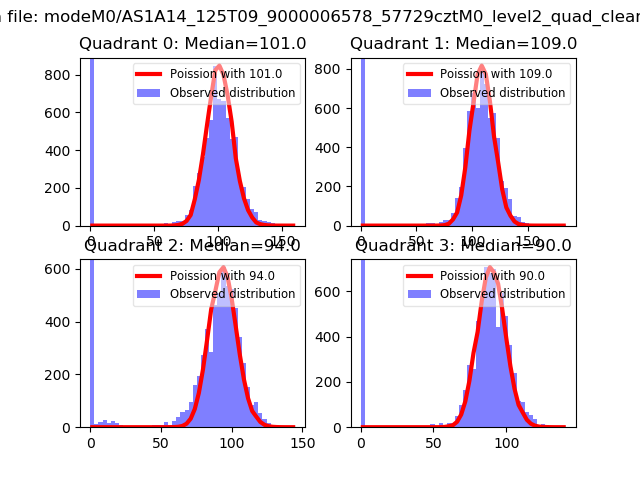 |
 |
| Quadrant-wise count rates Data is divided into 100 sec bins |
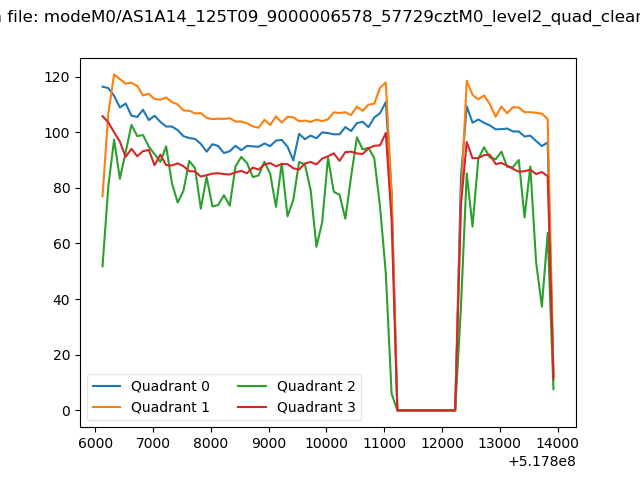 |
|
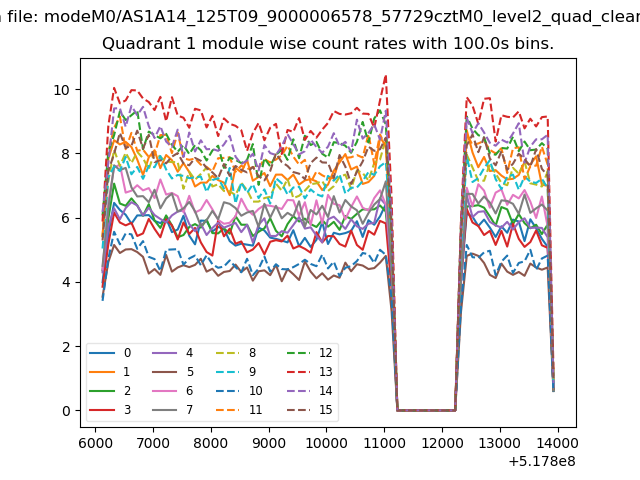
| Module-wise count rates for Quadrant A Data is divided into 100 sec bins |
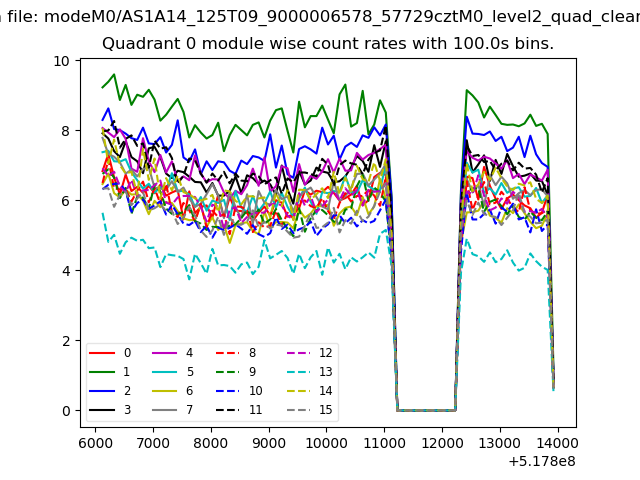 |
 |
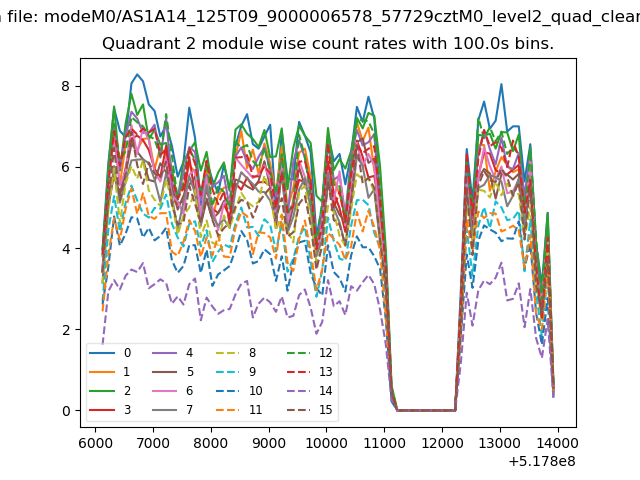
| Module-wise count rates for Quadrant B Data is divided into 100 sec bins |
 |
 |
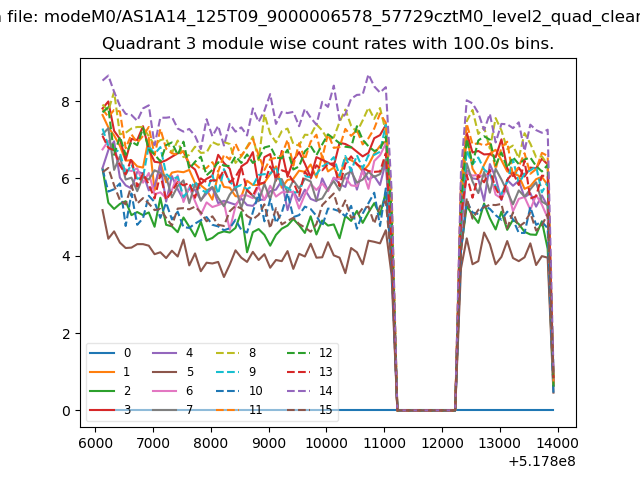
| Module-wise count rates for Quadrant C Data is divided into 100 sec bins |
 |
 |
| Module-wise count rates for Quadrant D Data is divided into 100 sec bins |
 |
 |
| Parameter | Plot |
|---|---|
| CZT HV Monitor | 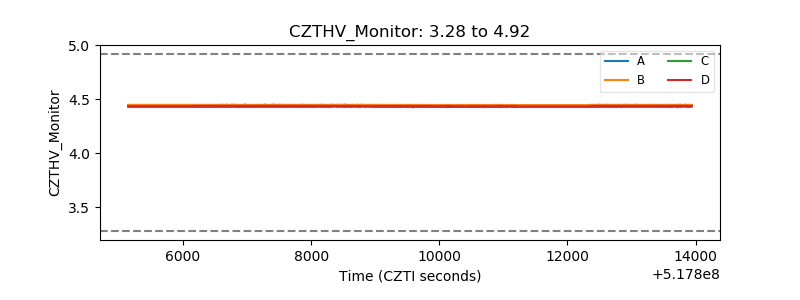 |
| D_VDD | 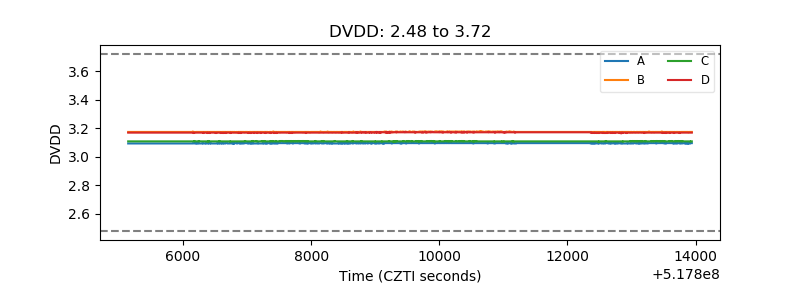 |
| Temperature 1 | 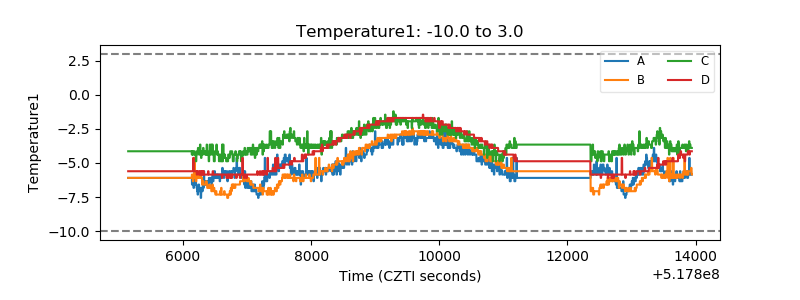 |
| Veto HV Monitor | 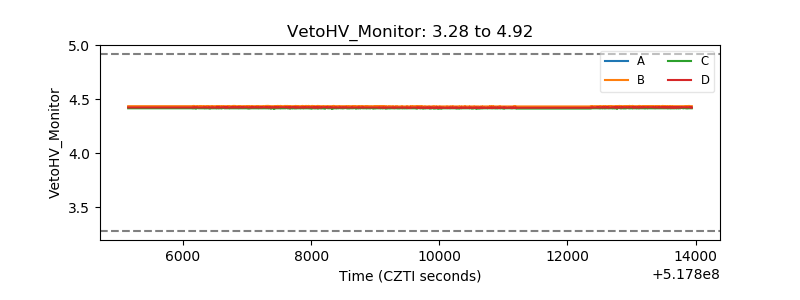 |
| Veto LLD | 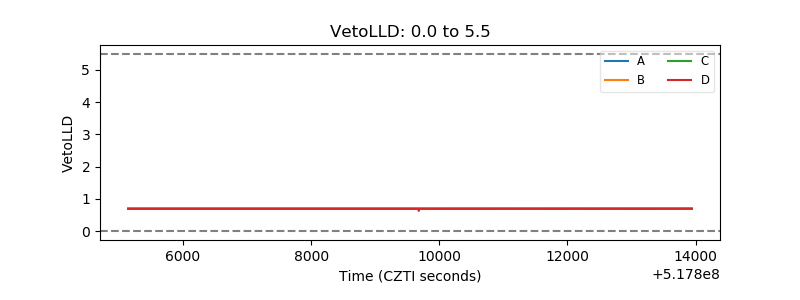 |
| Alpha Counter |  |
| _CPM_Rate | 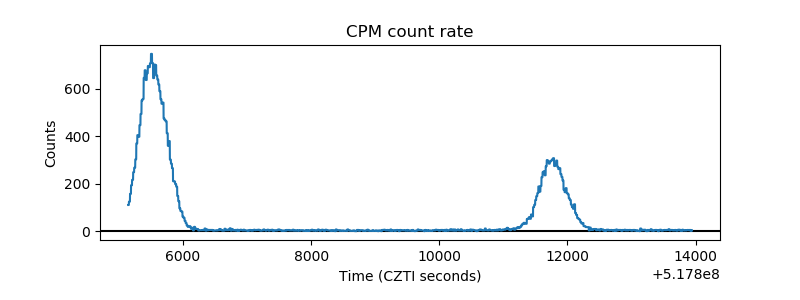 |
| CZT Counter | 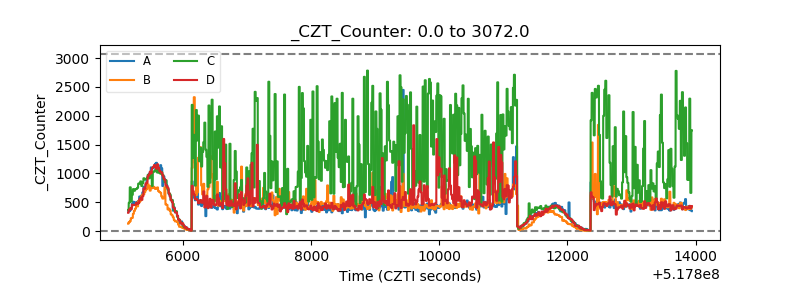 |
| +2.5 Volts monitor |  |
| +5 Volts monitor | 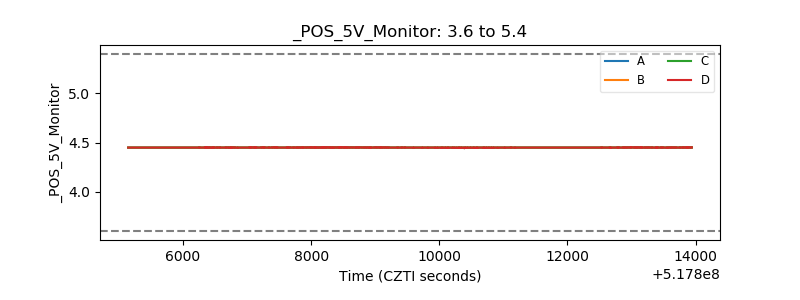 |
| _ROLL_ROT | 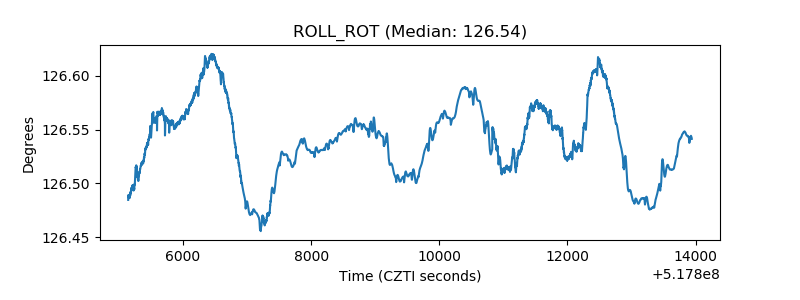 |
| _Roll_DEC | 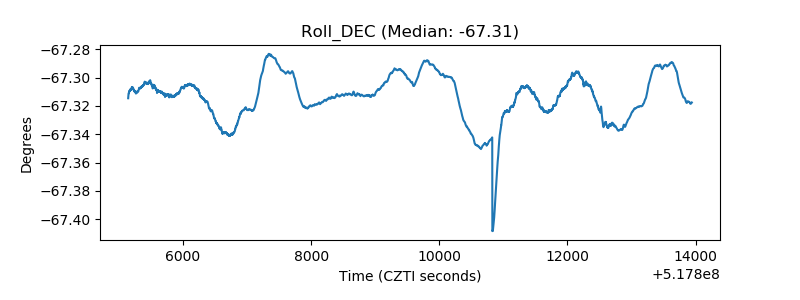 |
| _Roll_RA | 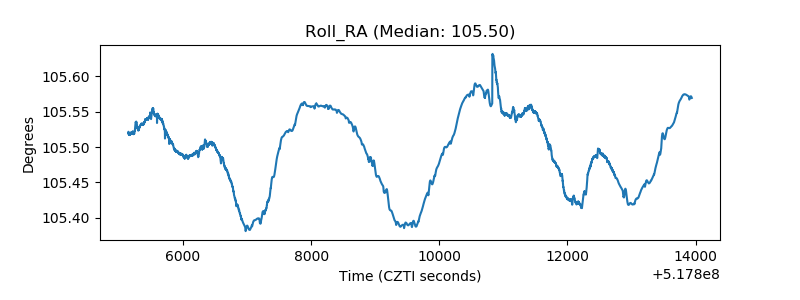 |
| Veto Counter | 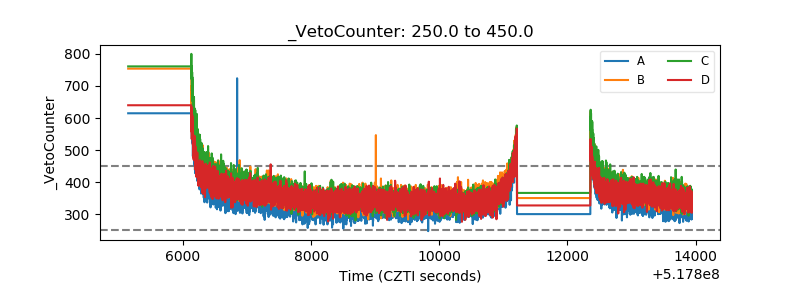 |