| Param | Original file | Final file |
|---|---|---|
| Filename | modeM0/AS1A14_083T16_9000006580_57732cztM0_level2.fits | modeM0/AS1A14_083T16_9000006580_57732cztM0_level2_quad_clean.evt |
| Size (bytes) | 675,316,800 | 100,730,880 |
| Size | 644.0 MB | 96.1 MB |
| Events in quadrant A | 3,992,697 | 702,750 |
| Events in quadrant B | 5,089,845 | 694,405 |
| Events in quadrant C | 11,240,370 | 500,191 |
| Events in quadrant D | 4,100,177 | 636,329 |
| Mode SS | |||
|---|---|---|---|
| Quadrant | BADHDUFLAG | Total packets | Discarded packets |
| A | 0 | 148 | 0 |
| B | 0 | 148 | 0 |
| C | 0 | 148 | 0 |
| D | 0 | 148 | 0 |
| Mode M0 | |||
|---|---|---|---|
| Quadrant | BADHDUFLAG | Total packets | Discarded packets |
| A | 0 | 16458 | 0 |
| B | 0 | 20318 | 0 |
| C | 0 | 38546 | 0 |
| D | 0 | 17214 | 0 |
| Quadrant | Total seconds | Saturated seconds | Saturation percentage |
|---|---|---|---|
| A | 7416 | 16 | 0.215750% |
| B | 7416 | 573 | 7.726537% |
| C | 7416 | 2466 | 33.252427% |
| D | 7416 | 79 | 1.065264% |
Noise dominated data is calculated using 1-second bins in cleaned event files. If a bin has >2000 counts, and if more than 50% of those come from <1% of pixels, then it is considered to be noise-dominated and hence unusable.
| Quadrant | # 1 sec bins | Bins with >0 counts | Bins with >2000 counts | High rate bins dominated by noise | Noise dominated (total time) | Noise dominated (detector-on time) | Marked lightcurve |
|---|---|---|---|---|---|---|---|
| A | 7416 | 7416 | 6 | 6 | 0.08% | 0.08% | 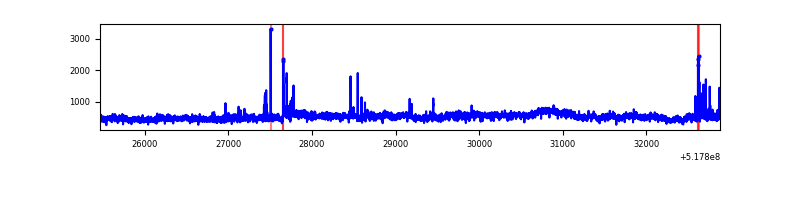 |
| B | 7416 | 7416 | 465 | 465 | 6.27% | 6.27% | 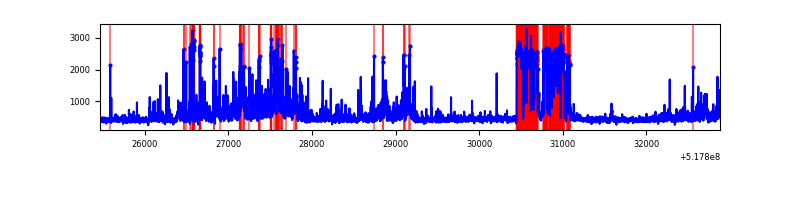 |
| C | 7415 | 7415 | 2168 | 2168 | 29.24% | 29.24% | 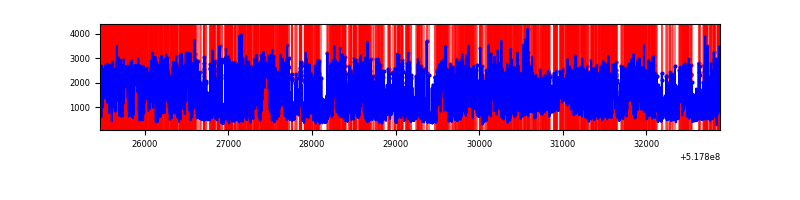 |
| D | 7416 | 7416 | 68 | 68 | 0.92% | 0.92% | 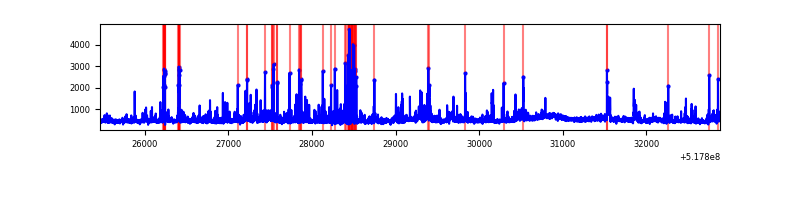 |
Top three noisy pixels from each quadrant. If the there are fewer than three noisy pixels in the level2.evt file, extra rows are filled as -1
| Pixel properties | Quadrant properties | ||||||
|---|---|---|---|---|---|---|---|
| Quadrant | DetID | PixID | Counts | Sigma | Mean | Median | Sigma |
| A | 3 | 128 | 821358 | 4189.51 | 786 | 766 | 195.9 |
| A | 3 | 17 | 101059 | 512.04 | 786 | 766 | 195.9 |
| A | 3 | 245 | 19714 | 96.74 | 786 | 766 | 195.9 |
| B | 0 | 171 | 1232515 | 7888.99 | 735 | 707 | 156.1 |
| B | 8 | 128 | 406857 | 2601.15 | 735 | 707 | 156.1 |
| B | 4 | 142 | 137440 | 875.69 | 735 | 707 | 156.1 |
| C | 12 | 254 | 4048071 | 21813.49 | 677 | 669 | 185.5 |
| C | 15 | 224 | 3243359 | 17476.49 | 677 | 669 | 185.5 |
| C | 9 | 38 | 789395 | 4250.84 | 677 | 669 | 185.5 |
| D | 3 | 12 | 211607 | 973.88 | 766 | 729 | 216.5 |
| D | 9 | 49 | 189960 | 873.91 | 766 | 729 | 216.5 |
| D | 2 | 249 | 173716 | 798.89 | 766 | 729 | 216.5 |
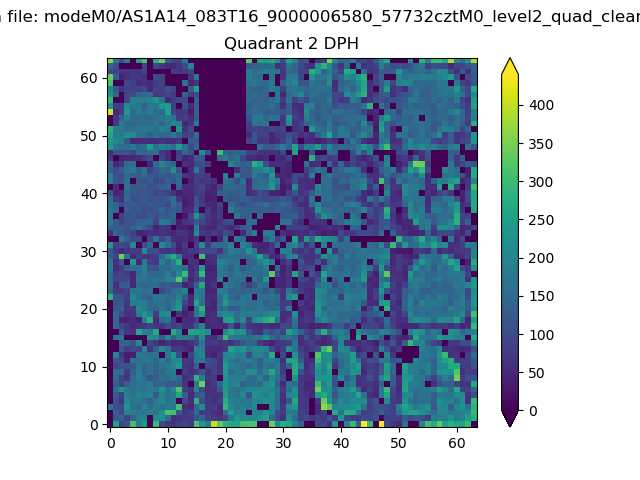
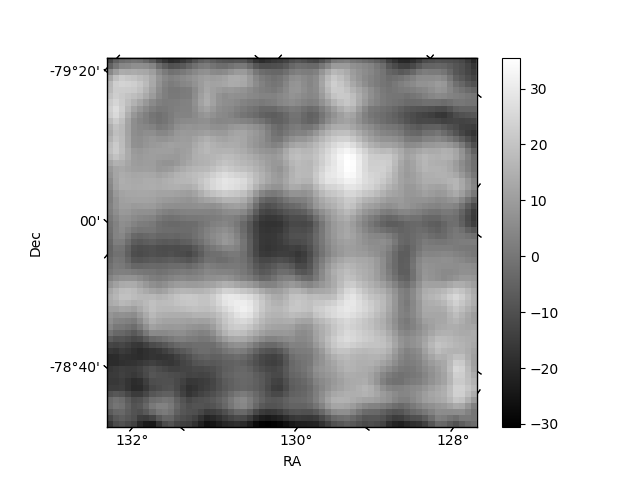
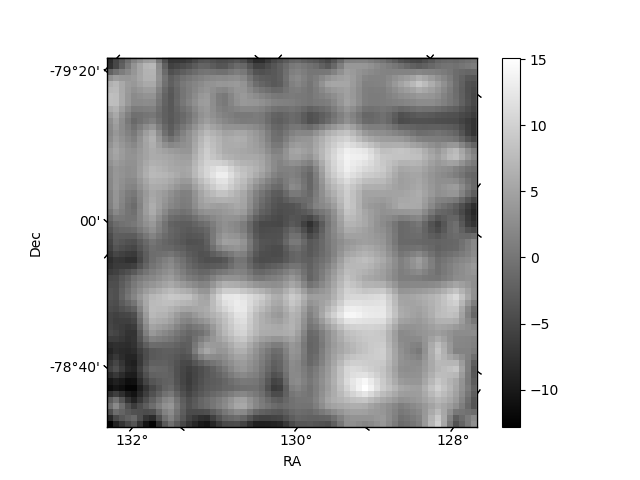
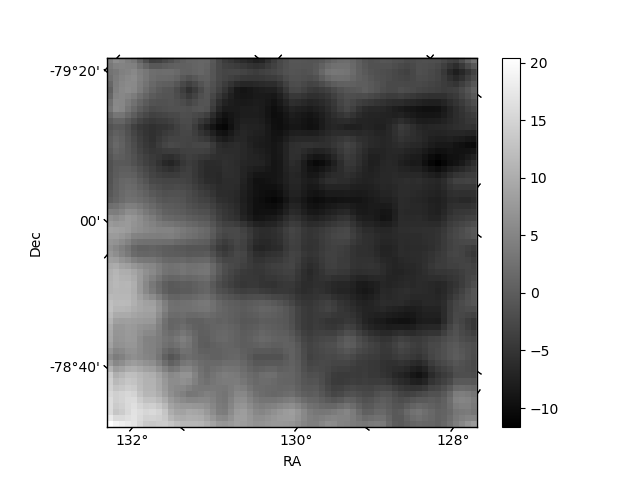
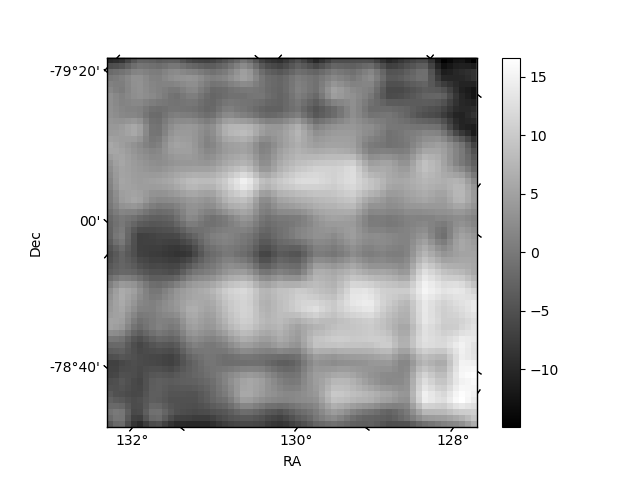
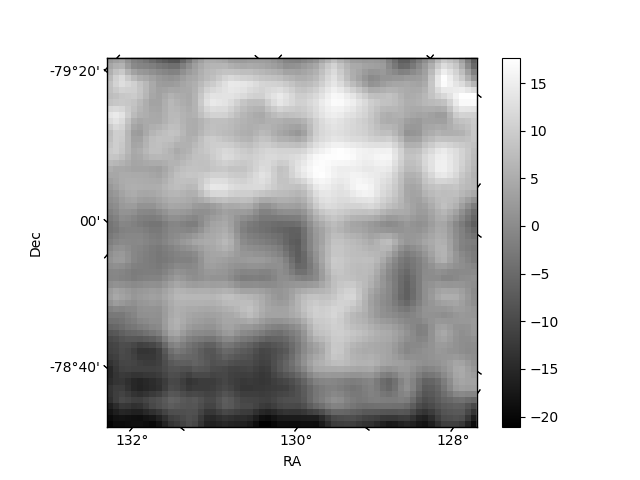
Histogram calculated using DETX and DETY for each event in the final _common_clean file
| Quadrant A | 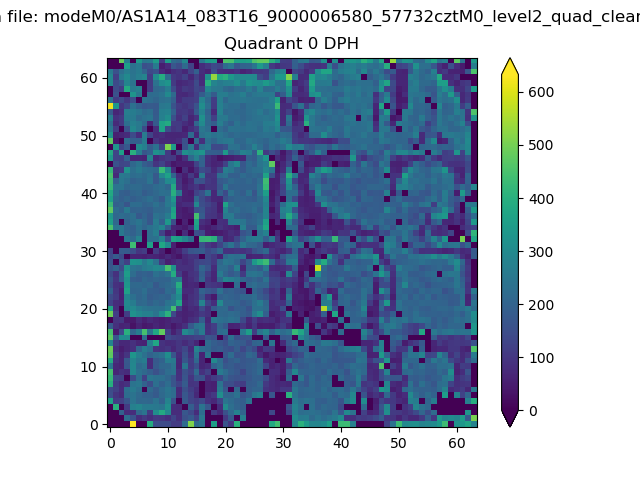 |
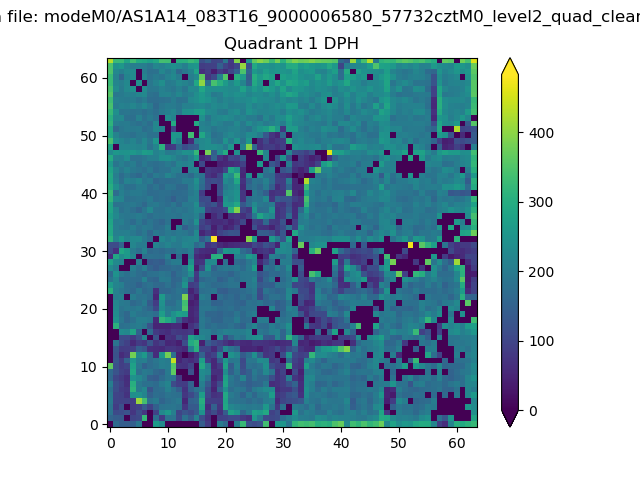 |
Quadrant B |
|---|---|---|---|
| Quadrant D | 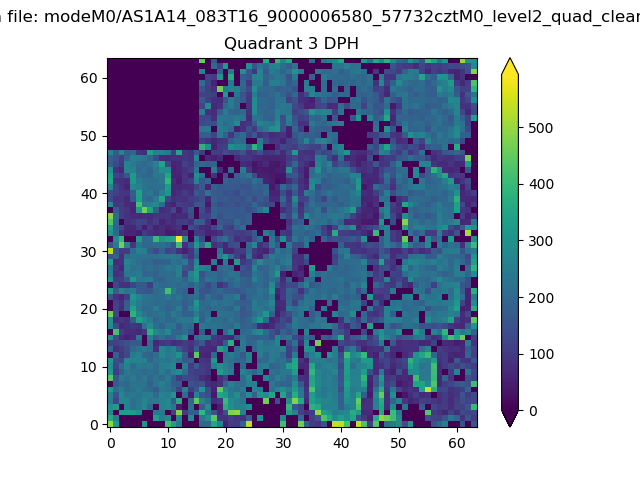 |
 |
Quadrant C |
| Plot type | Count rate plots | Images |
|---|---|---|
| Comparison with Poisson distribution Blue bars denote a histogram of data divided into 1 sec bins. Red curve is a Poisson curve with rate = median count rate of data. |
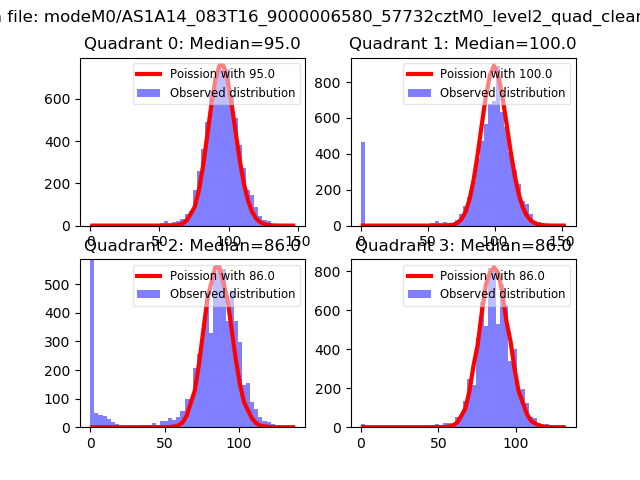 |
 |
| Quadrant-wise count rates Data is divided into 100 sec bins |
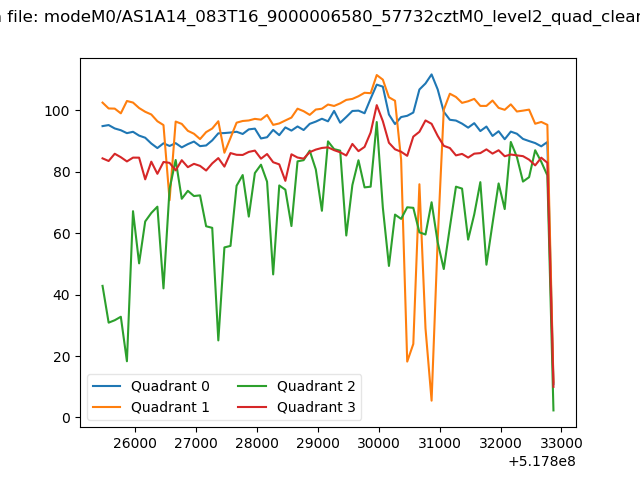 |
|
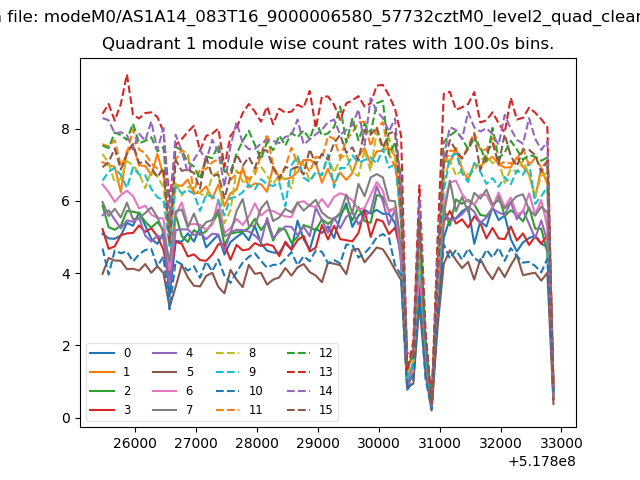
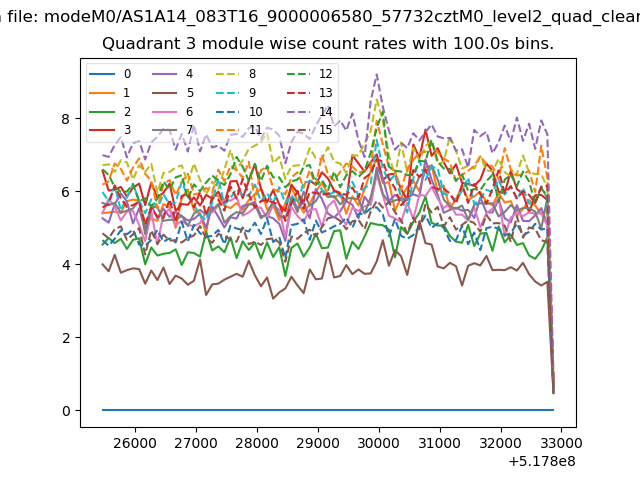
| Module-wise count rates for Quadrant A Data is divided into 100 sec bins |
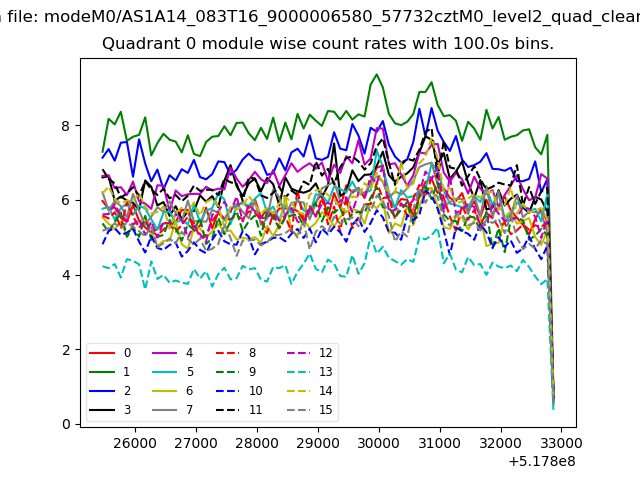 |
 |
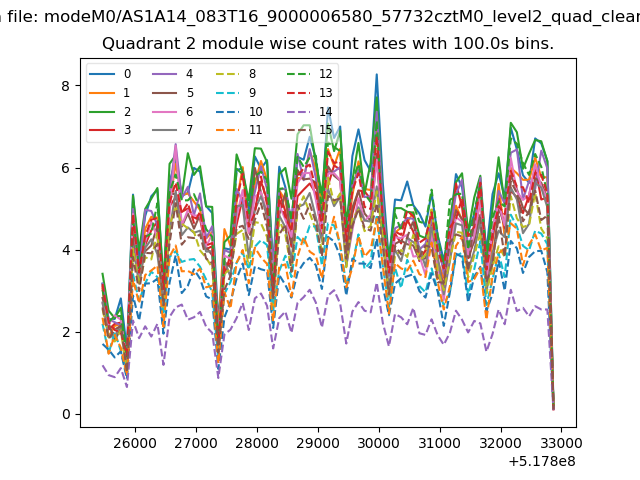
| Module-wise count rates for Quadrant B Data is divided into 100 sec bins |
 |
 |
| Module-wise count rates for Quadrant C Data is divided into 100 sec bins |
 |
 |
| Module-wise count rates for Quadrant D Data is divided into 100 sec bins |
 |
 |
| Parameter | Plot |
|---|---|
| CZT HV Monitor | 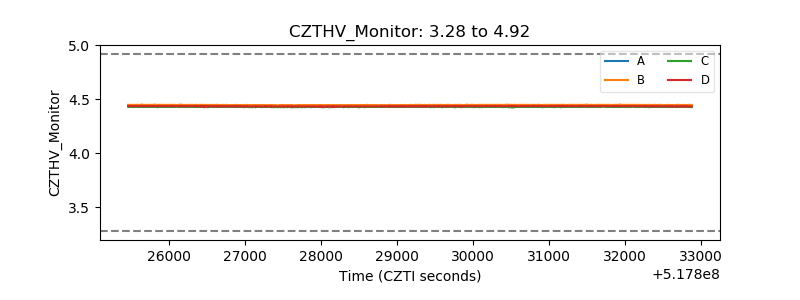 |
| D_VDD | 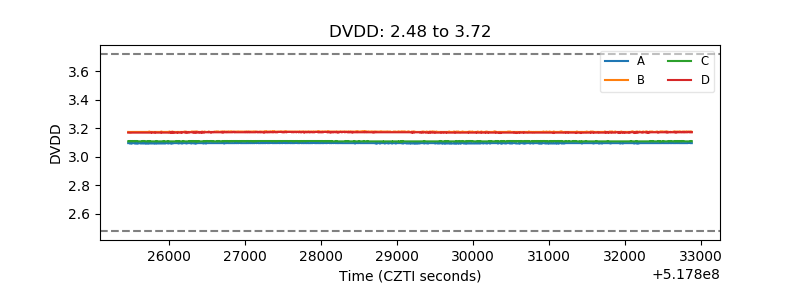 |
| Temperature 1 | 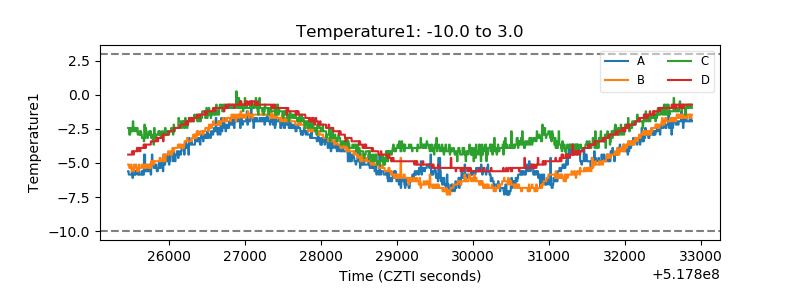 |
| Veto HV Monitor |  |
| Veto LLD | 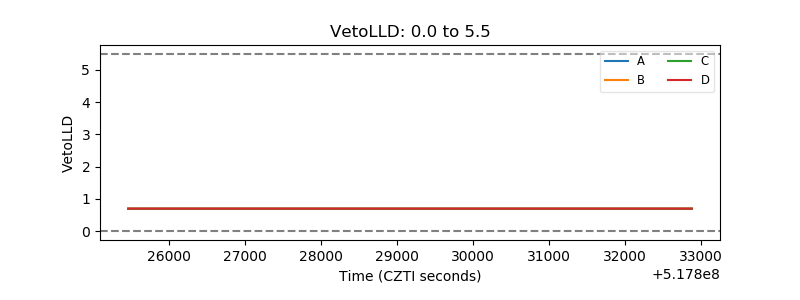 |
| Alpha Counter | 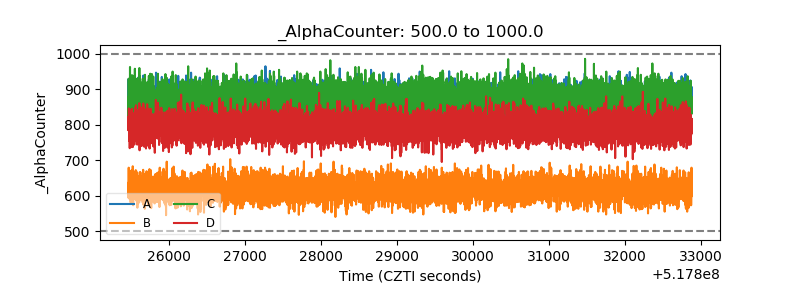 |
| _CPM_Rate | 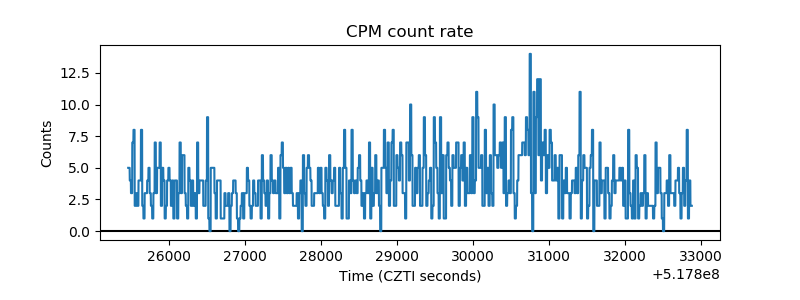 |
| CZT Counter | 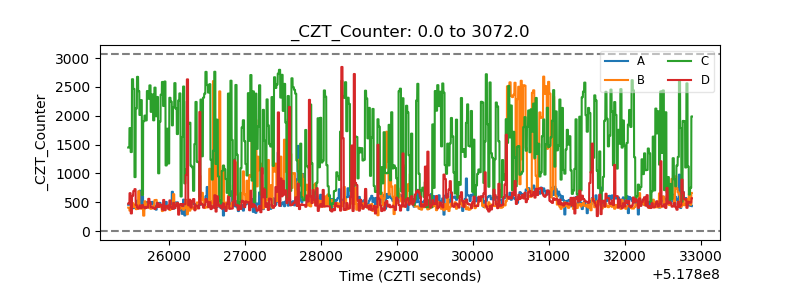 |
| +2.5 Volts monitor | 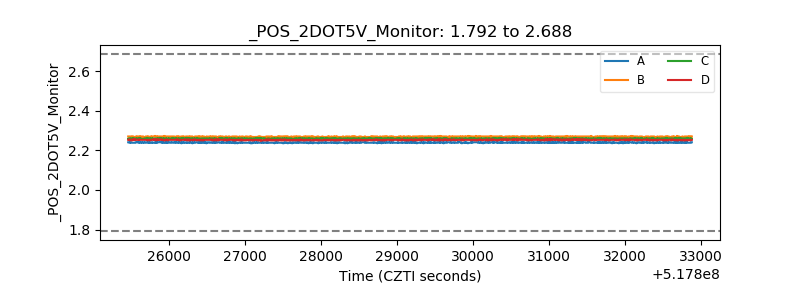 |
| +5 Volts monitor |  |
| _ROLL_ROT | 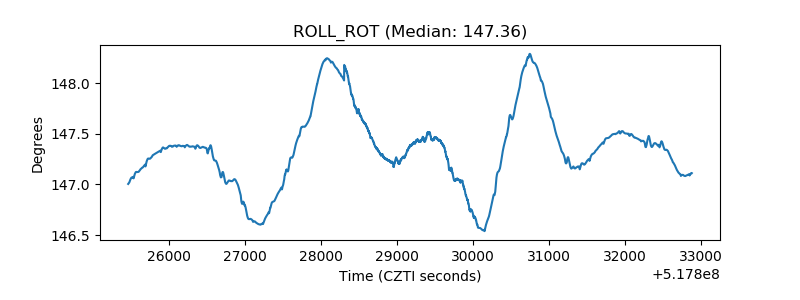 |
| _Roll_DEC | 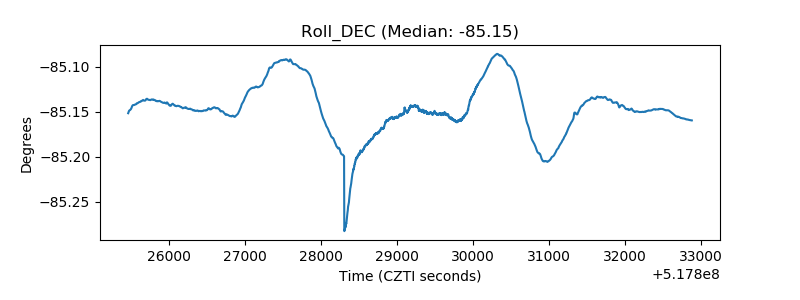 |
| _Roll_RA | 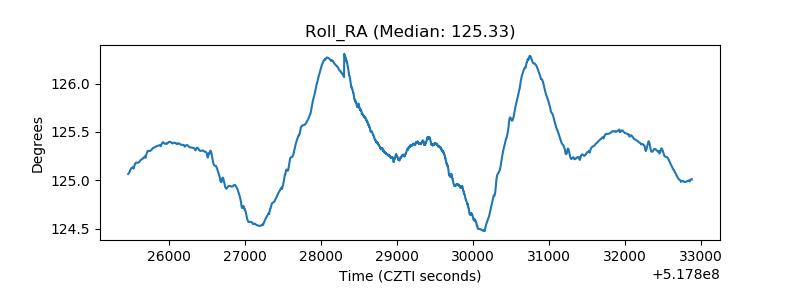 |
| Veto Counter | 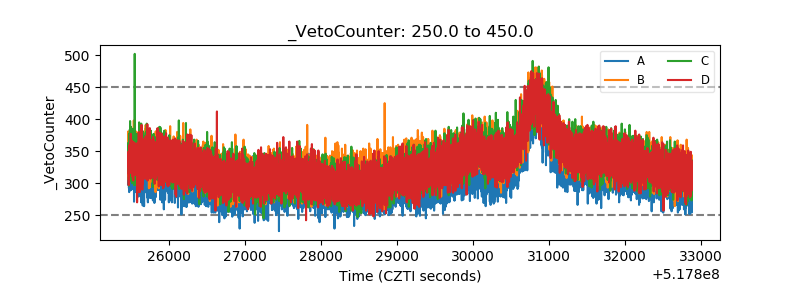 |