| Param | Original file | Final file |
|---|---|---|
| Filename | modeM0/AS1A14_083T16_9000006580_57733cztM0_level2.fits | modeM0/AS1A14_083T16_9000006580_57733cztM0_level2_quad_clean.evt |
| Size (bytes) | 546,713,280 | 103,256,640 |
| Size | 521.4 MB | 98.5 MB |
| Events in quadrant A | 3,848,541 | 685,564 |
| Events in quadrant B | 3,962,872 | 728,211 |
| Events in quadrant C | 7,832,051 | 589,814 |
| Events in quadrant D | 4,032,587 | 618,549 |
| Mode SS | |||
|---|---|---|---|
| Quadrant | BADHDUFLAG | Total packets | Discarded packets |
| A | 0 | 146 | 0 |
| B | 0 | 146 | 0 |
| C | 0 | 146 | 0 |
| D | 0 | 146 | 0 |
| Mode M0 | |||
|---|---|---|---|
| Quadrant | BADHDUFLAG | Total packets | Discarded packets |
| A | 0 | 15774 | 0 |
| B | 0 | 16793 | 0 |
| C | 0 | 28320 | 0 |
| D | 0 | 16654 | 0 |
| Quadrant | Total seconds | Saturated seconds | Saturation percentage |
|---|---|---|---|
| A | 7236 | 16 | 0.221117% |
| B | 7237 | 117 | 1.616692% |
| C | 7237 | 1116 | 15.420754% |
| D | 7236 | 72 | 0.995025% |
Noise dominated data is calculated using 1-second bins in cleaned event files. If a bin has >2000 counts, and if more than 50% of those come from <1% of pixels, then it is considered to be noise-dominated and hence unusable.
| Quadrant | # 1 sec bins | Bins with >0 counts | Bins with >2000 counts | High rate bins dominated by noise | Noise dominated (total time) | Noise dominated (detector-on time) | Marked lightcurve |
|---|---|---|---|---|---|---|---|
| A | 7236 | 7236 | 3 | 3 | 0.04% | 0.04% | 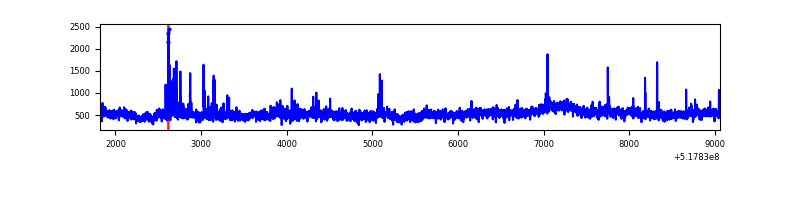 |
| B | 7237 | 7237 | 78 | 78 | 1.08% | 1.08% | 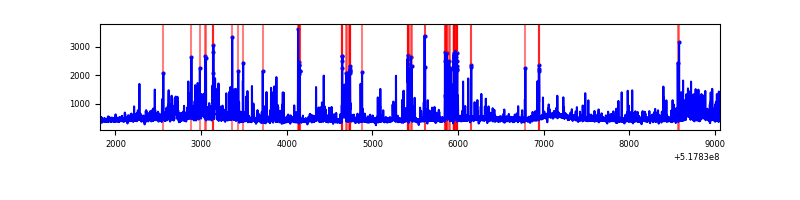 |
| C | 7237 | 7237 | 1051 | 1051 | 14.52% | 14.52% | 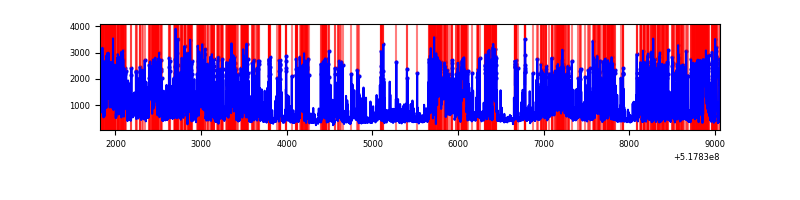 |
| D | 7236 | 7236 | 61 | 61 | 0.84% | 0.84% | 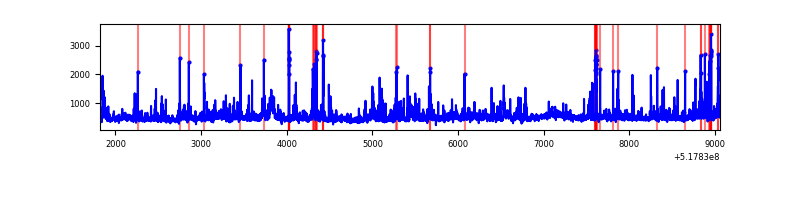 |
Top three noisy pixels from each quadrant. If the there are fewer than three noisy pixels in the level2.evt file, extra rows are filled as -1
| Pixel properties | Quadrant properties | ||||||
|---|---|---|---|---|---|---|---|
| Quadrant | DetID | PixID | Counts | Sigma | Mean | Median | Sigma |
| A | 3 | 128 | 726904 | 3766.44 | 772 | 754 | 192.8 |
| A | 3 | 17 | 78430 | 402.89 | 772 | 754 | 192.8 |
| A | 7 | 29 | 22464 | 112.61 | 772 | 754 | 192.8 |
| B | 4 | 142 | 212178 | 1317.37 | 756 | 728 | 160.5 |
| B | 10 | 247 | 132706 | 822.25 | 756 | 728 | 160.5 |
| B | 0 | 171 | 130661 | 809.51 | 756 | 728 | 160.5 |
| C | 15 | 224 | 3164789 | 16330.17 | 708 | 700 | 193.8 |
| C | 12 | 254 | 811492 | 4184.57 | 708 | 700 | 193.8 |
| C | 12 | 2 | 787632 | 4061.43 | 708 | 700 | 193.8 |
| D | 3 | 224 | 344547 | 1631.07 | 748 | 715 | 210.8 |
| D | 9 | 49 | 237958 | 1125.44 | 748 | 715 | 210.8 |
| D | 2 | 249 | 122076 | 575.71 | 748 | 715 | 210.8 |
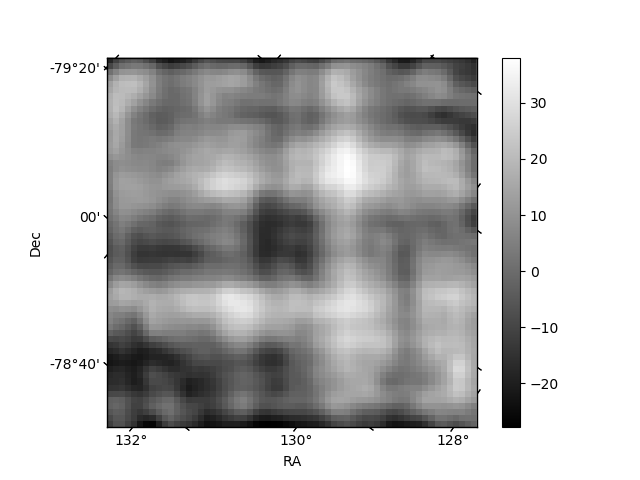
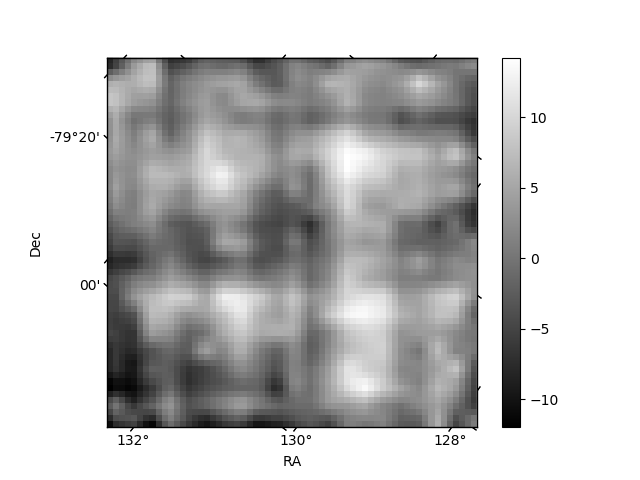
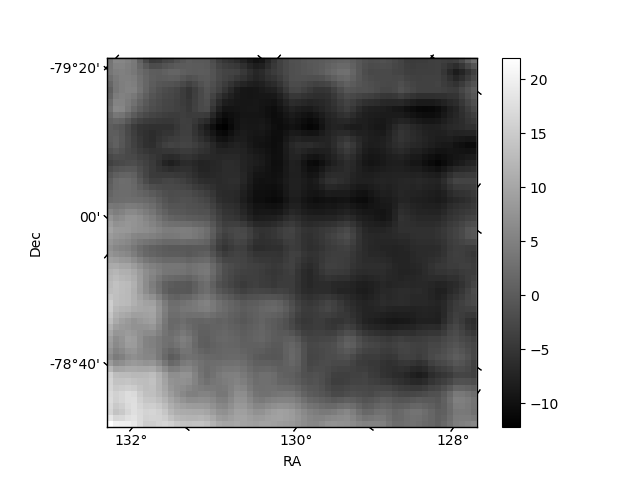
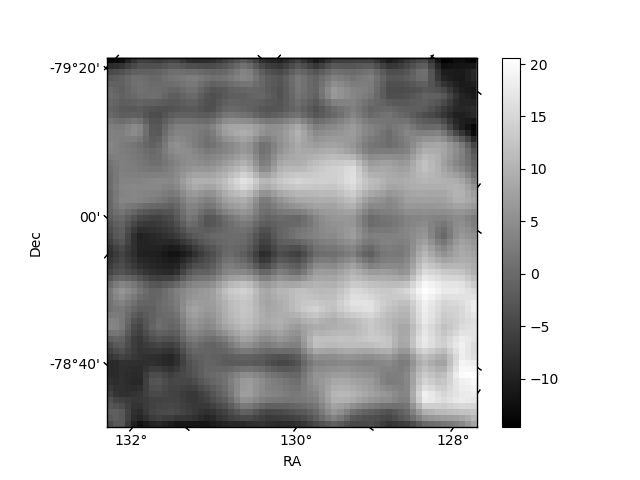
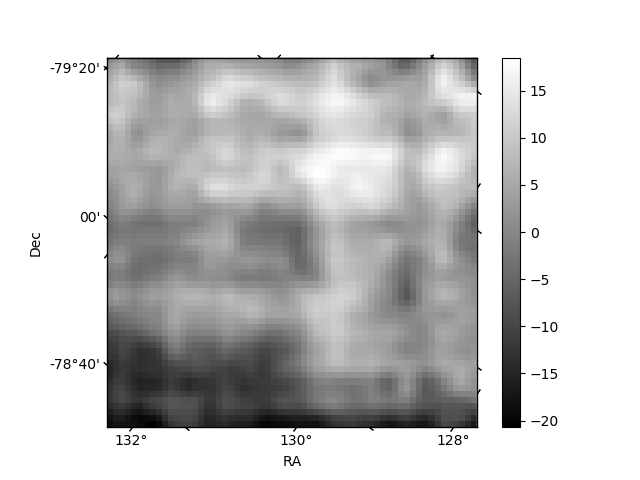
Histogram calculated using DETX and DETY for each event in the final _common_clean file
| Quadrant A | 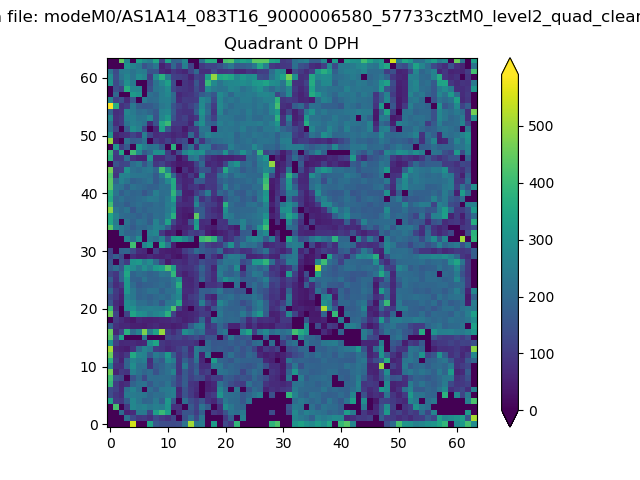 |
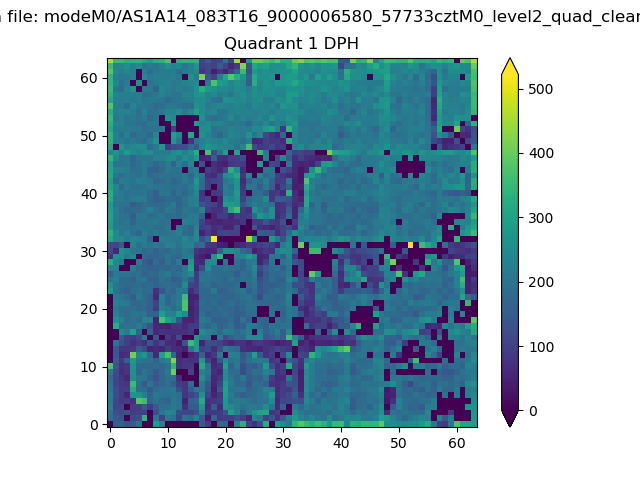 |
Quadrant B |
|---|---|---|---|
| Quadrant D | 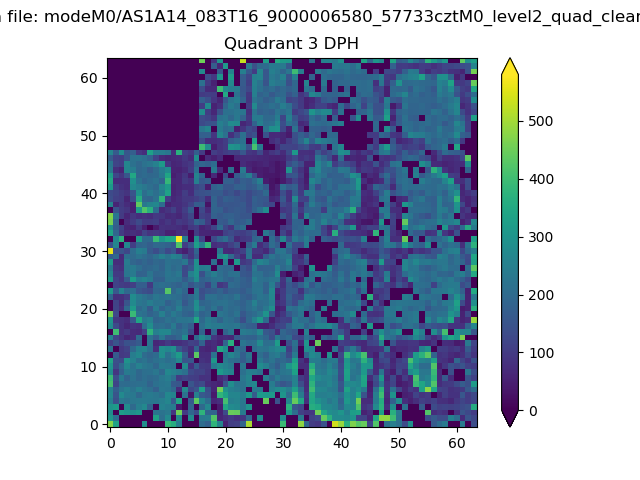 |
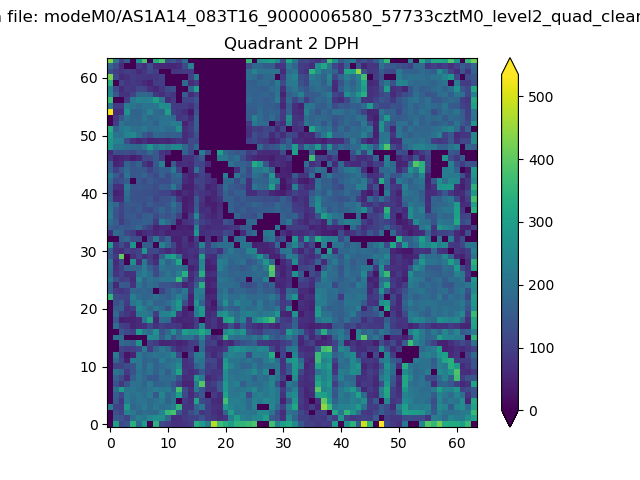 |
Quadrant C |
| Plot type | Count rate plots | Images |
|---|---|---|
| Comparison with Poisson distribution Blue bars denote a histogram of data divided into 1 sec bins. Red curve is a Poisson curve with rate = median count rate of data. |
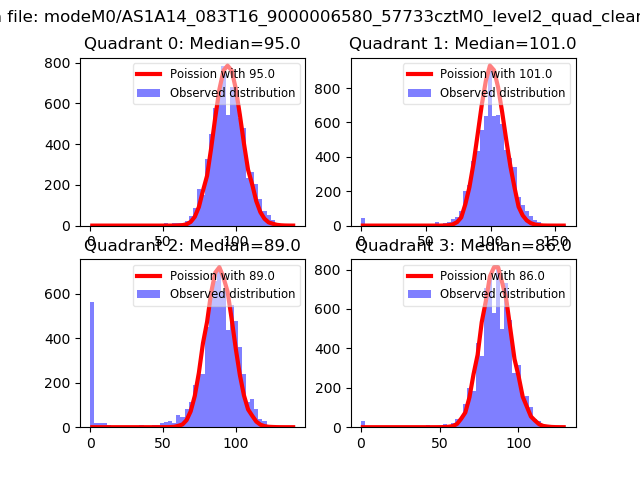 |
 |
| Quadrant-wise count rates Data is divided into 100 sec bins |
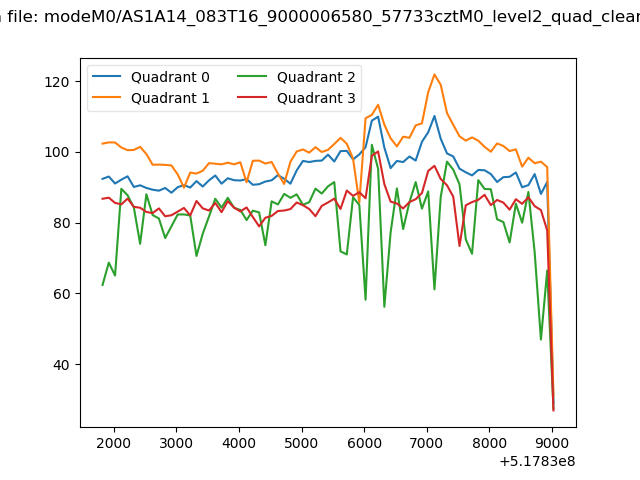 |
|
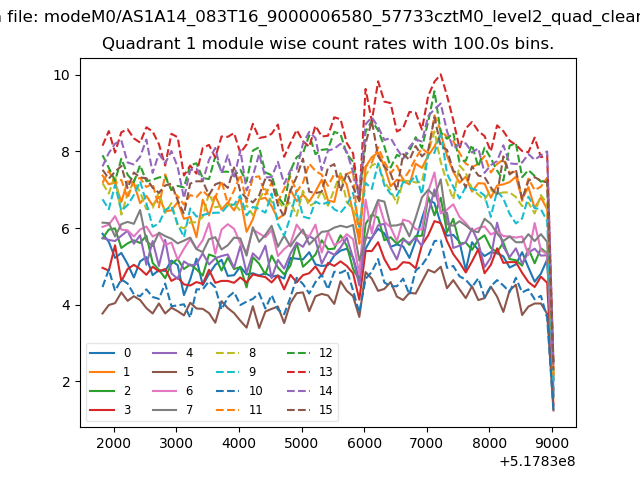
| Module-wise count rates for Quadrant A Data is divided into 100 sec bins |
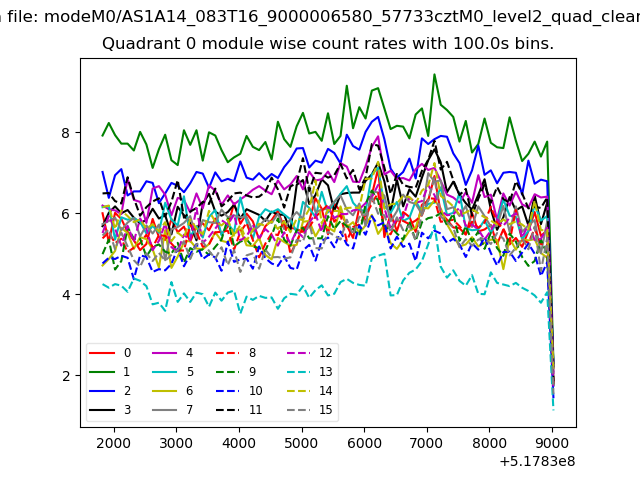 |
 |
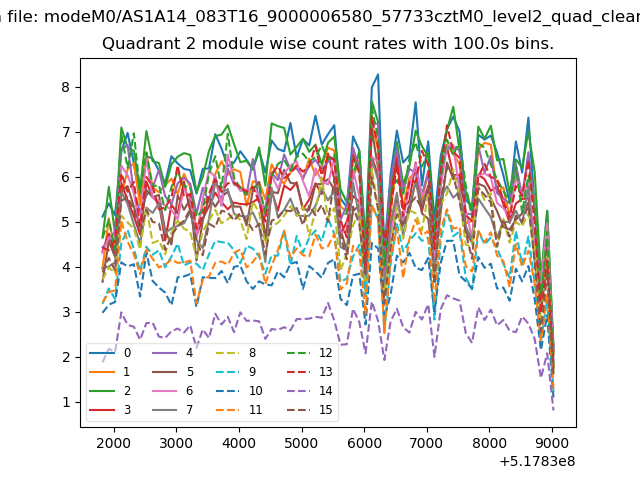
| Module-wise count rates for Quadrant B Data is divided into 100 sec bins |
 |
 |
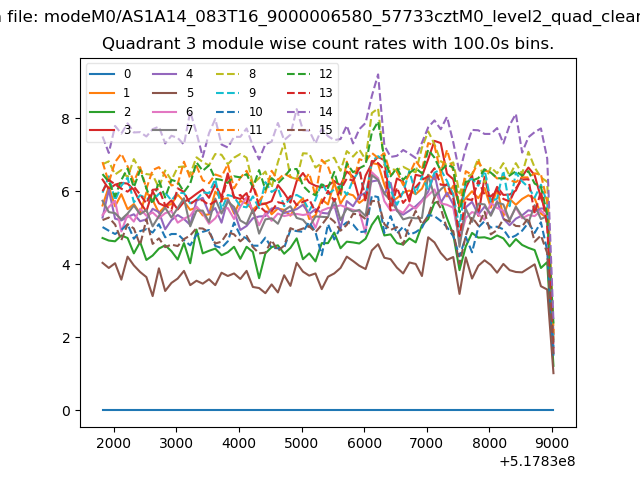
| Module-wise count rates for Quadrant C Data is divided into 100 sec bins |
 |
 |
| Module-wise count rates for Quadrant D Data is divided into 100 sec bins |
 |
 |
| Parameter | Plot |
|---|---|
| CZT HV Monitor |  |
| D_VDD | 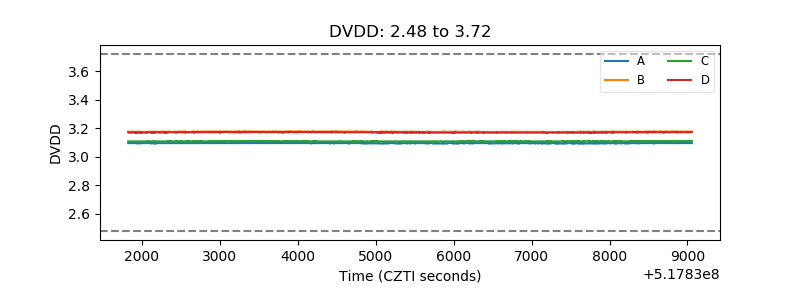 |
| Temperature 1 | 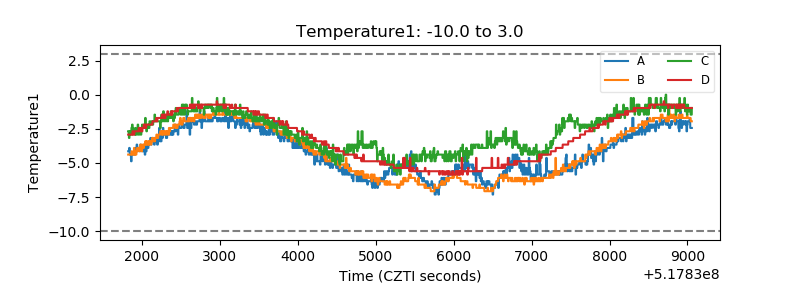 |
| Veto HV Monitor | 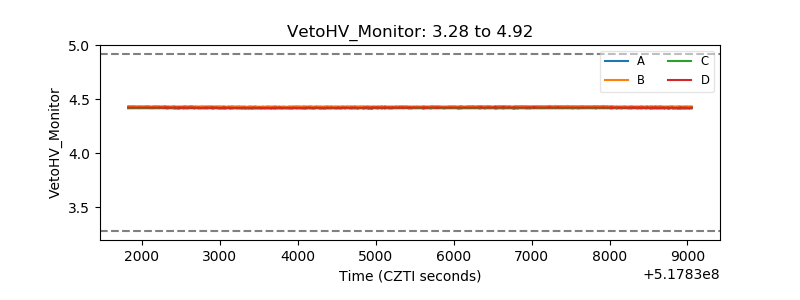 |
| Veto LLD | 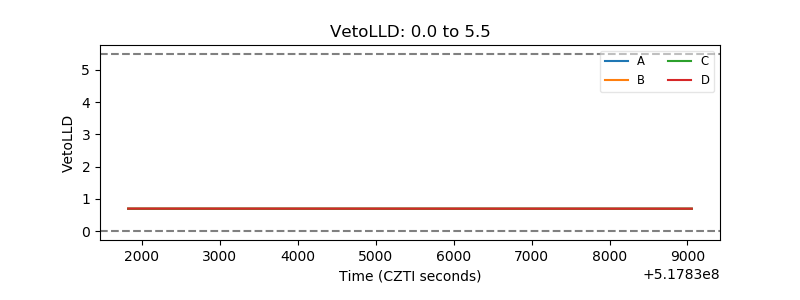 |
| Alpha Counter | 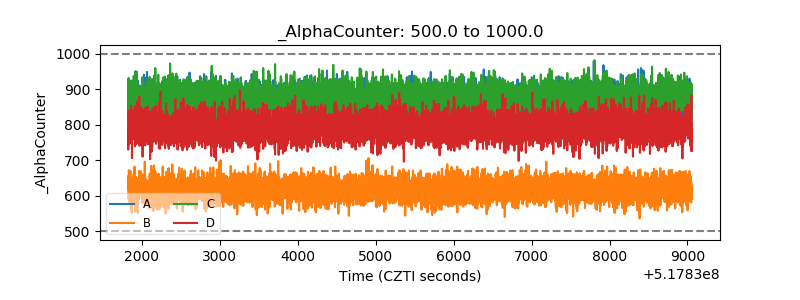 |
| _CPM_Rate | 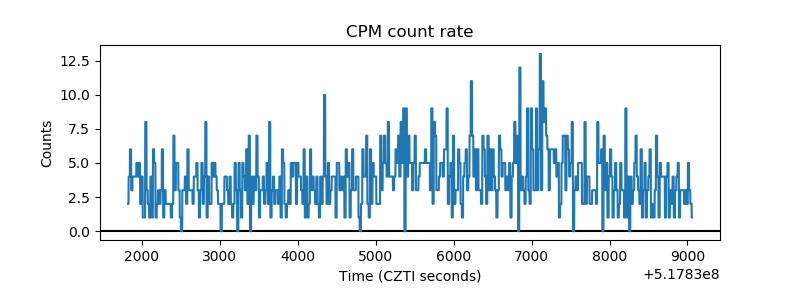 |
| CZT Counter | 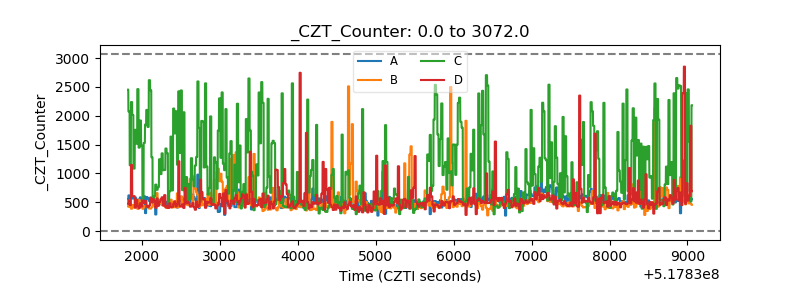 |
| +2.5 Volts monitor | 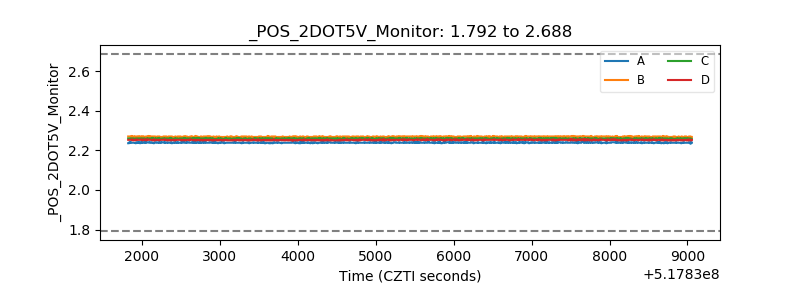 |
| +5 Volts monitor |  |
| _ROLL_ROT | 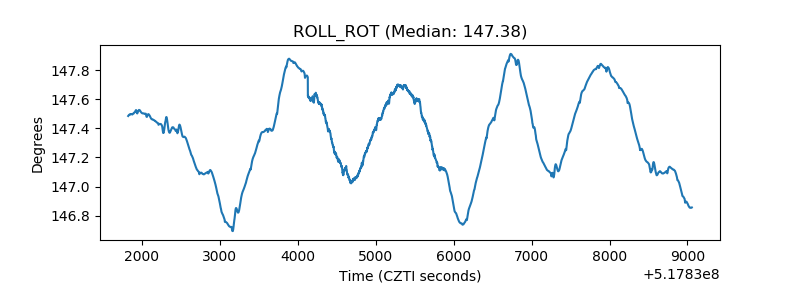 |
| _Roll_DEC | 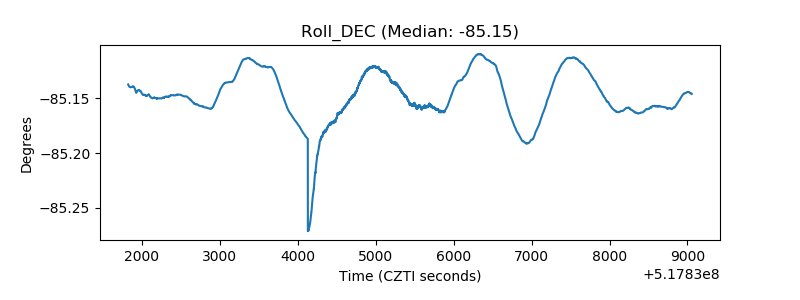 |
| _Roll_RA | 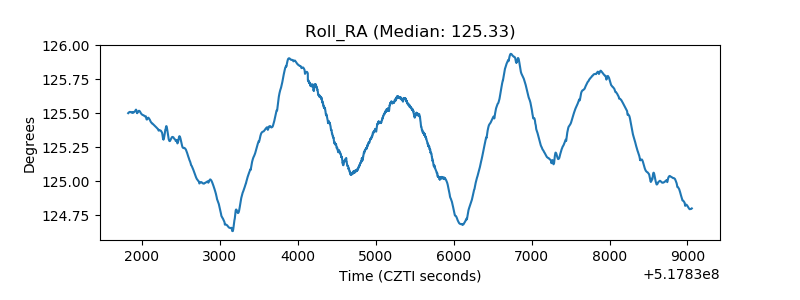 |
| Veto Counter | 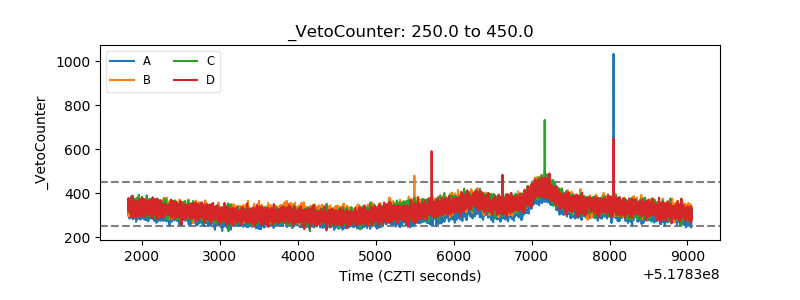 |