| Param | Original file | Final file |
|---|---|---|
| Filename | modeM0/AS1A14_083T16_9000006580_57736cztM0_level2.fits | modeM0/AS1A14_083T16_9000006580_57736cztM0_level2_quad_clean.evt |
| Size (bytes) | 1,397,465,280 | 262,647,360 |
| Size | 1.3 GB | 250.5 MB |
| Events in quadrant A | 9,374,076 | 1,755,994 |
| Events in quadrant B | 10,017,666 | 1,852,352 |
| Events in quadrant C | 19,814,720 | 1,460,929 |
| Events in quadrant D | 11,053,172 | 1,573,451 |
| Mode SS | |||
|---|---|---|---|
| Quadrant | BADHDUFLAG | Total packets | Discarded packets |
| A | 0 | 384 | 0 |
| B | 0 | 384 | 0 |
| C | 0 | 384 | 0 |
| D | 0 | 384 | 0 |
| Mode M0 | |||
|---|---|---|---|
| Quadrant | BADHDUFLAG | Total packets | Discarded packets |
| A | 0 | 41196 | 2 |
| B | 0 | 43378 | 2 |
| C | 0 | 72132 | 2 |
| D | 0 | 46050 | 2 |
| Mode M9 | |||
|---|---|---|---|
| Quadrant | BADHDUFLAG | Total packets | Discarded packets |
| A | 0 | 10 | 0 |
| B | 0 | 10 | 0 |
| C | 0 | 10 | 0 |
| D | 0 | 10 | 0 |
| Quadrant | Total seconds | Saturated seconds | Saturation percentage |
|---|---|---|---|
| A | 18996 | 330 | 1.737208% |
| B | 18997 | 592 | 3.116282% |
| C | 18997 | 3336 | 17.560667% |
| D | 18997 | 582 | 3.063642% |
Noise dominated data is calculated using 1-second bins in cleaned event files. If a bin has >2000 counts, and if more than 50% of those come from <1% of pixels, then it is considered to be noise-dominated and hence unusable.
| Quadrant | # 1 sec bins | Bins with >0 counts | Bins with >2000 counts | High rate bins dominated by noise | Noise dominated (total time) | Noise dominated (detector-on time) | Marked lightcurve |
|---|---|---|---|---|---|---|---|
| A | 20006 | 18996 | 115 | 115 | 0.57% | 0.61% | 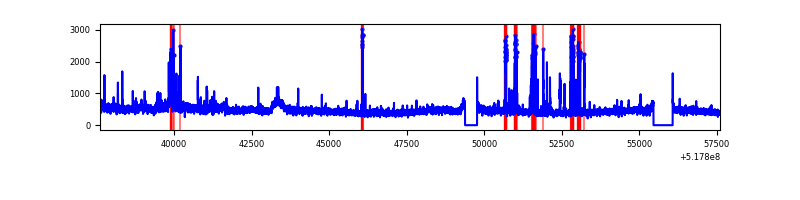 |
| B | 20007 | 18997 | 221 | 221 | 1.10% | 1.16% | 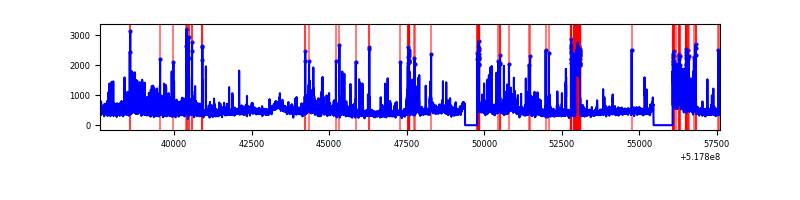 |
| C | 20007 | 18997 | 3050 | 3050 | 15.24% | 16.06% | 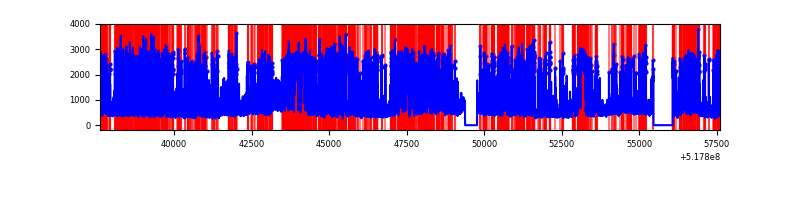 |
| D | 20007 | 18998 | 430 | 430 | 2.15% | 2.26% | 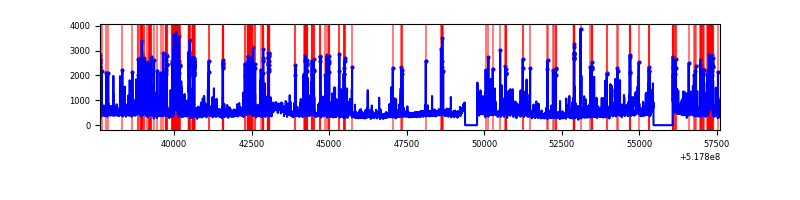 |
Top three noisy pixels from each quadrant. If the there are fewer than three noisy pixels in the level2.evt file, extra rows are filled as -1
| Pixel properties | Quadrant properties | ||||||
|---|---|---|---|---|---|---|---|
| Quadrant | DetID | PixID | Counts | Sigma | Mean | Median | Sigma |
| A | 3 | 128 | 701004 | 1377.96 | 2050 | 1996 | 507.3 |
| A | 0 | 12 | 408288 | 800.93 | 2050 | 1996 | 507.3 |
| A | 12 | 3 | 159178 | 309.85 | 2050 | 1996 | 507.3 |
| B | 4 | 142 | 491146 | 1142.35 | 2009 | 1930 | 428.3 |
| B | 4 | 80 | 304062 | 705.5 | 2009 | 1930 | 428.3 |
| B | 5 | 185 | 228352 | 528.71 | 2009 | 1930 | 428.3 |
| C | 15 | 224 | 9937046 | 20076.67 | 1836 | 1817 | 494.9 |
| C | 12 | 2 | 1129429 | 2278.63 | 1836 | 1817 | 494.9 |
| C | 12 | 254 | 886291 | 1787.31 | 1836 | 1817 | 494.9 |
| D | 3 | 224 | 910558 | 1646.33 | 1968 | 1876 | 551.9 |
| D | 2 | 249 | 516061 | 931.59 | 1968 | 1876 | 551.9 |
| D | 2 | 153 | 489080 | 882.71 | 1968 | 1876 | 551.9 |
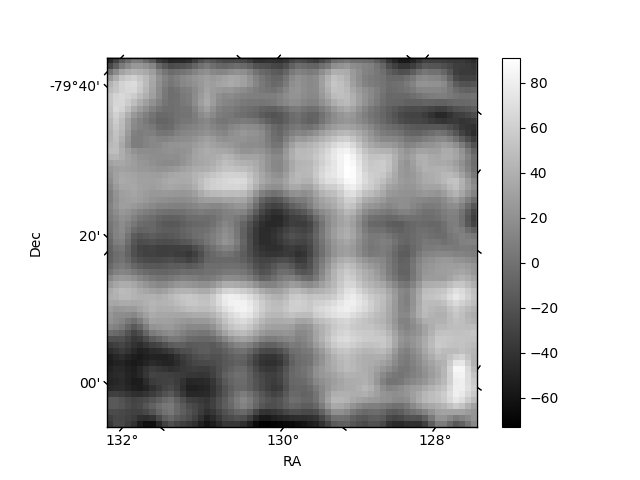
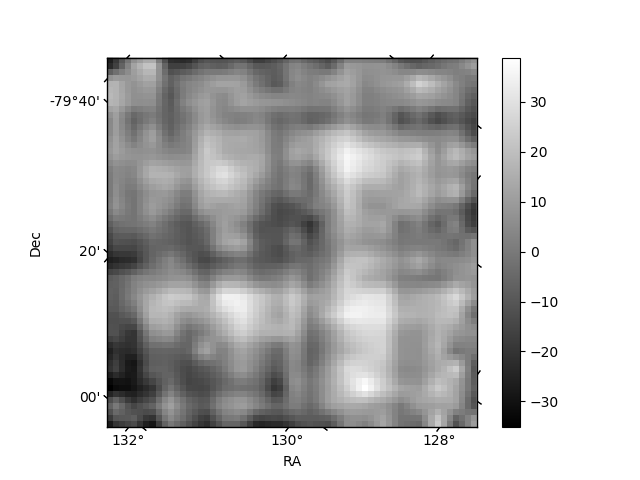
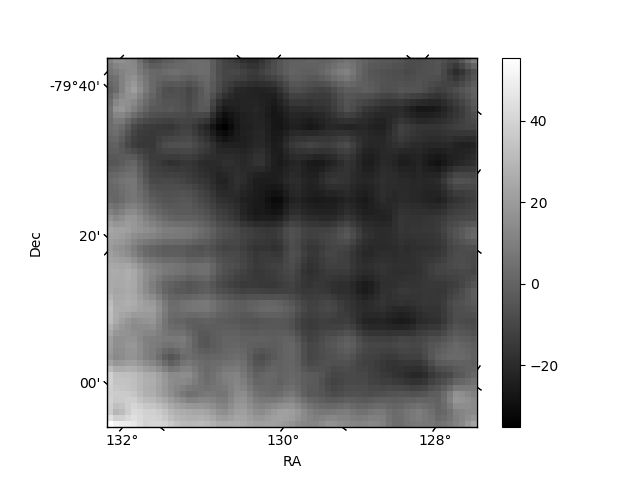
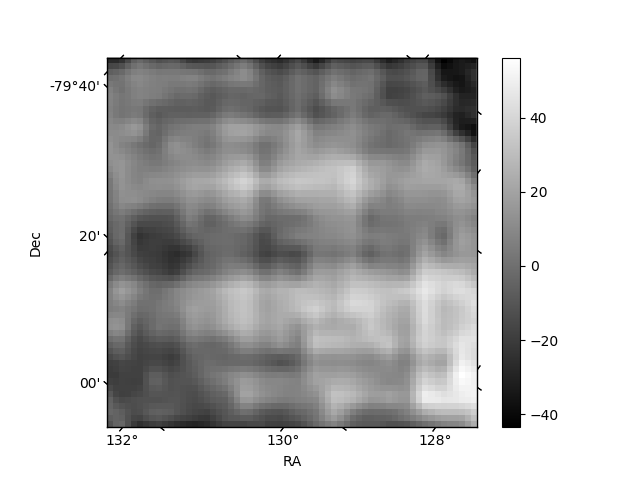
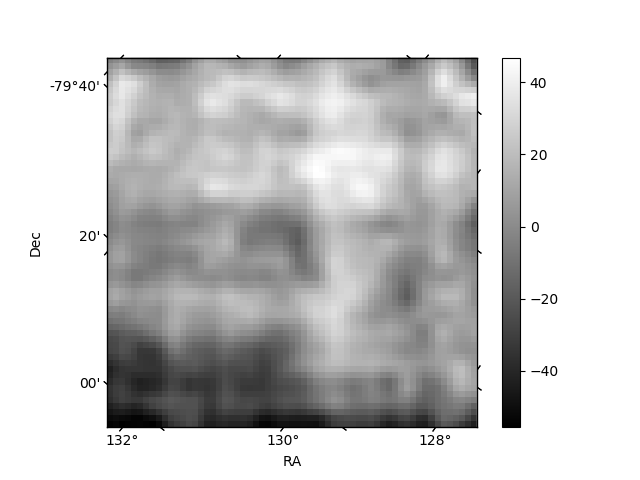
Histogram calculated using DETX and DETY for each event in the final _common_clean file
| Quadrant A | 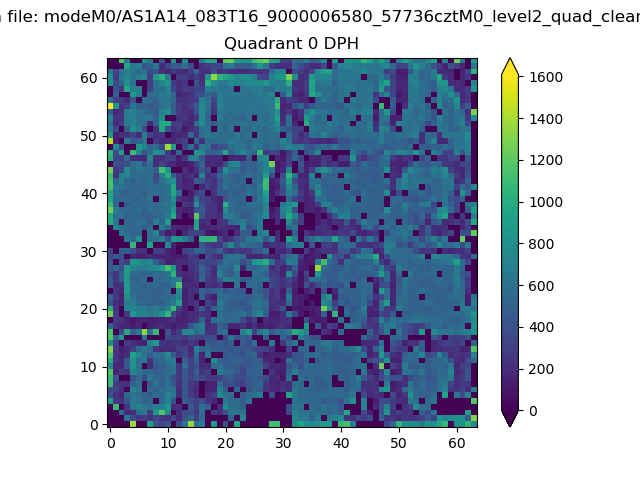 |
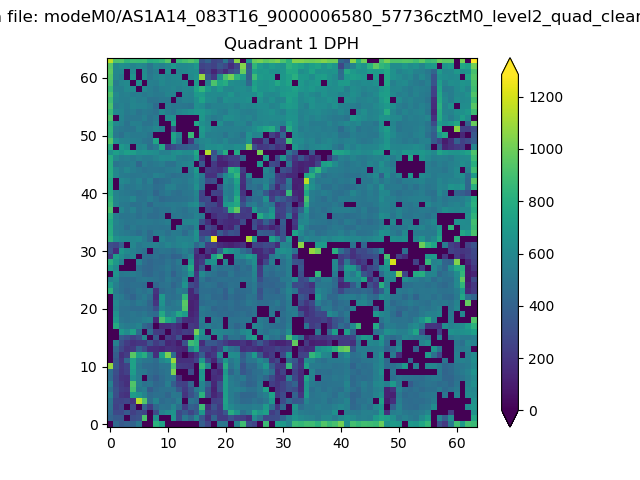 |
Quadrant B |
|---|---|---|---|
| Quadrant D | 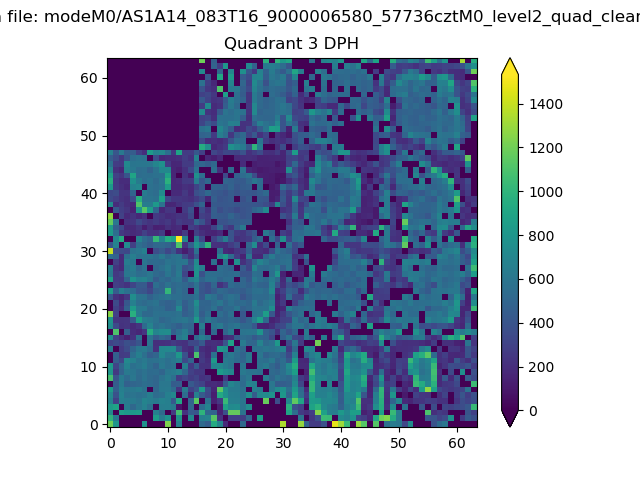 |
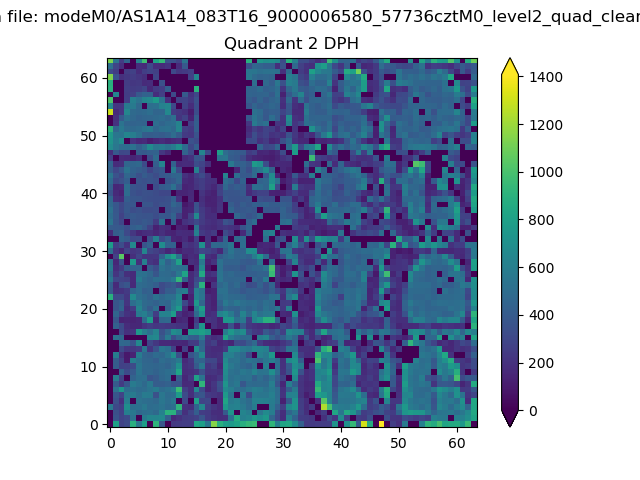 |
Quadrant C |
| Plot type | Count rate plots | Images |
|---|---|---|
| Comparison with Poisson distribution Blue bars denote a histogram of data divided into 1 sec bins. Red curve is a Poisson curve with rate = median count rate of data. |
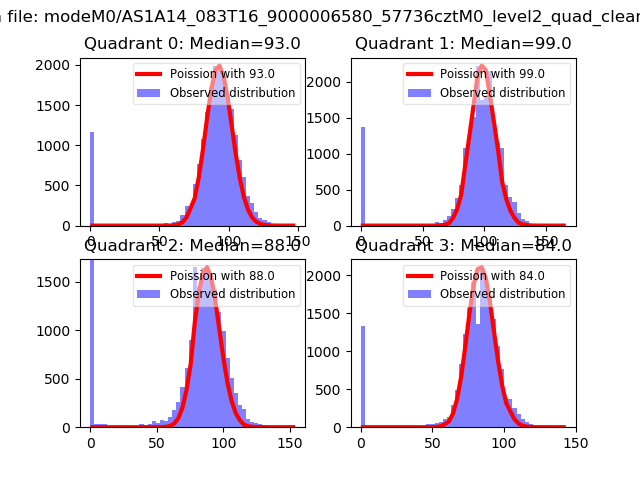 |
 |
| Quadrant-wise count rates Data is divided into 100 sec bins |
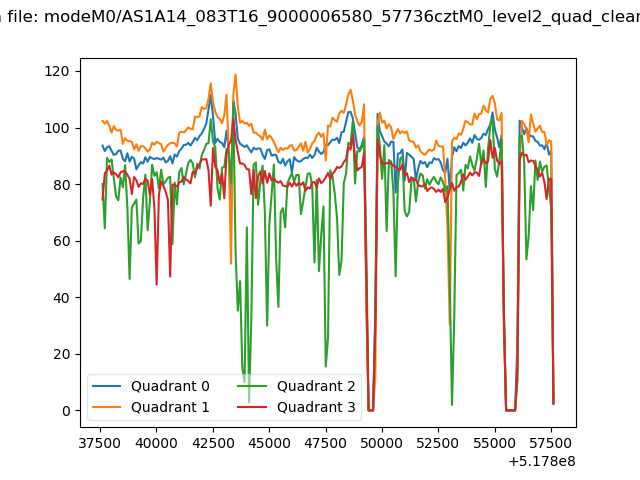 |
|
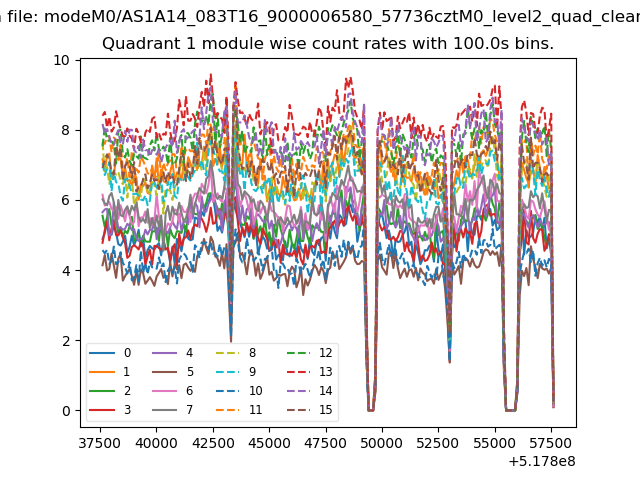
| Module-wise count rates for Quadrant A Data is divided into 100 sec bins |
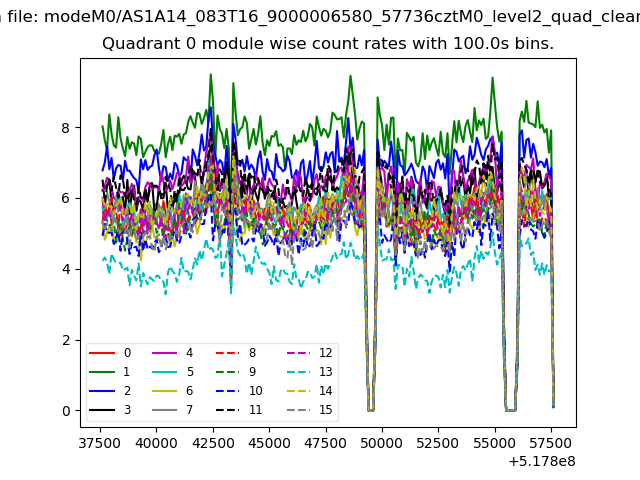 |
 |
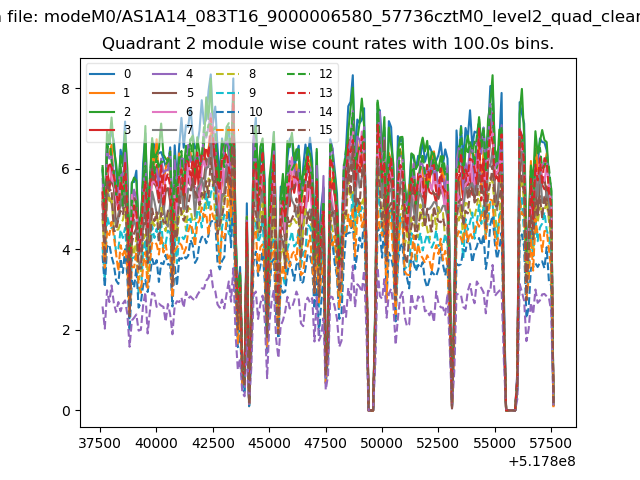
| Module-wise count rates for Quadrant B Data is divided into 100 sec bins |
 |
 |
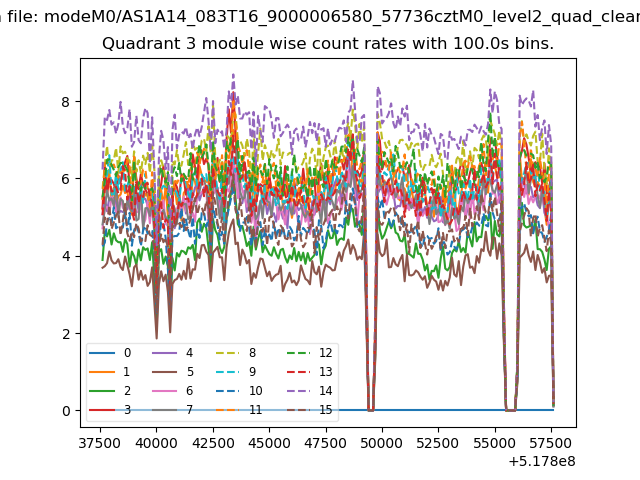
| Module-wise count rates for Quadrant C Data is divided into 100 sec bins |
 |
 |
| Module-wise count rates for Quadrant D Data is divided into 100 sec bins |
 |
 |
| Parameter | Plot |
|---|---|
| CZT HV Monitor | 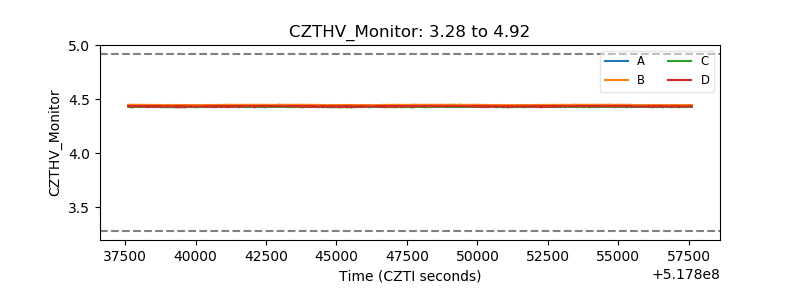 |
| D_VDD | 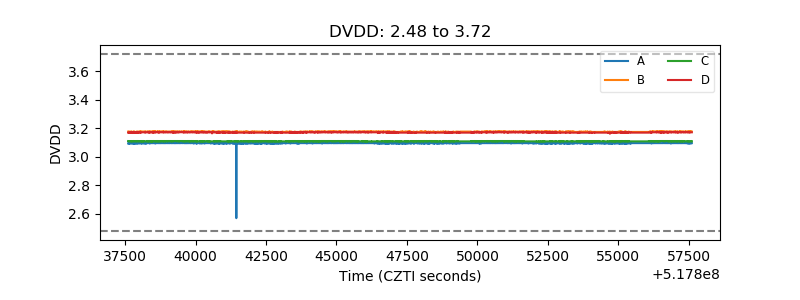 |
| Temperature 1 | 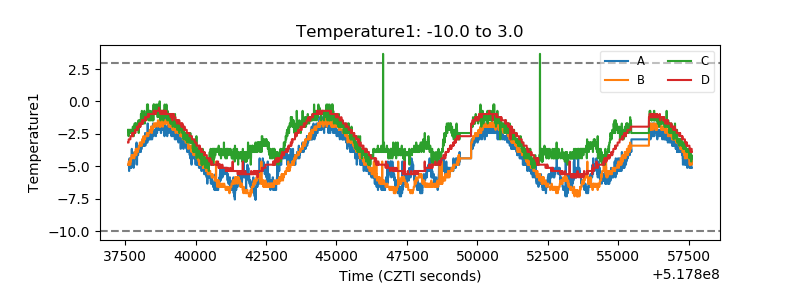 |
| Veto HV Monitor | 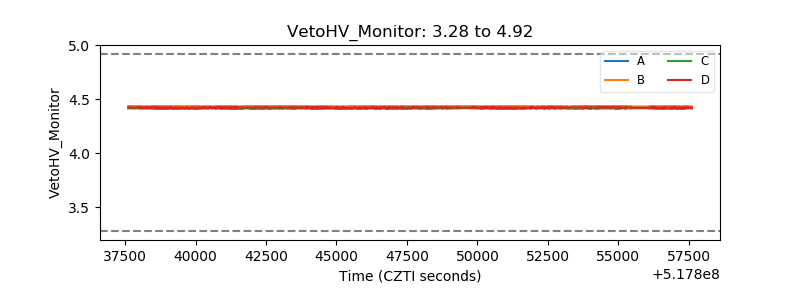 |
| Veto LLD | 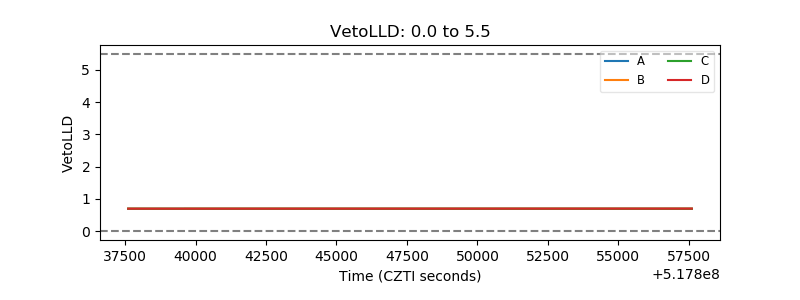 |
| Alpha Counter | 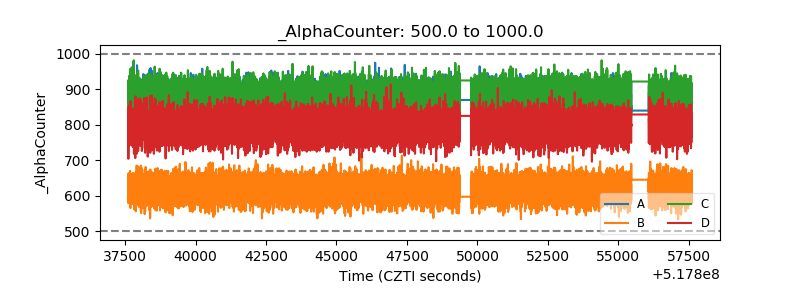 |
| _CPM_Rate | 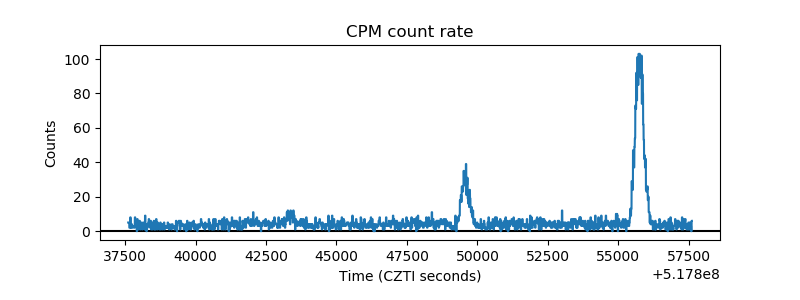 |
| CZT Counter | 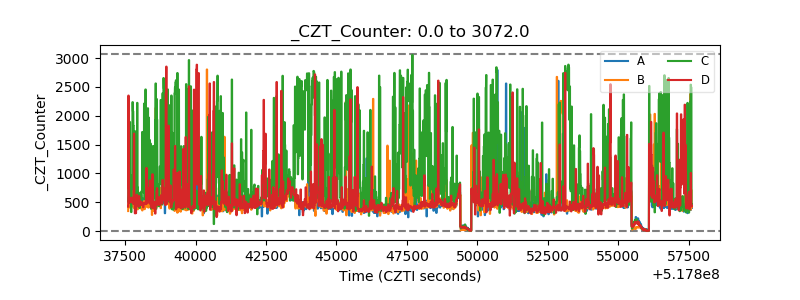 |
| +2.5 Volts monitor | 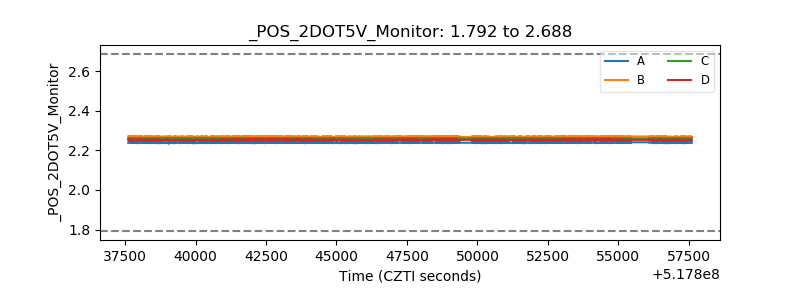 |
| +5 Volts monitor |  |
| _ROLL_ROT | 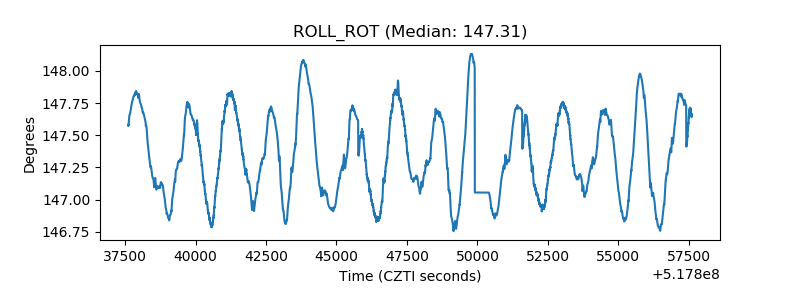 |
| _Roll_DEC | 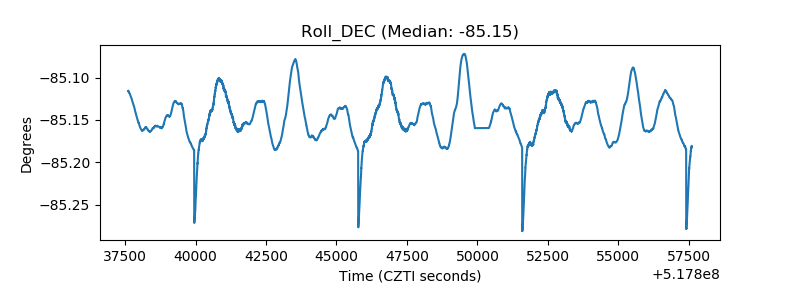 |
| _Roll_RA | 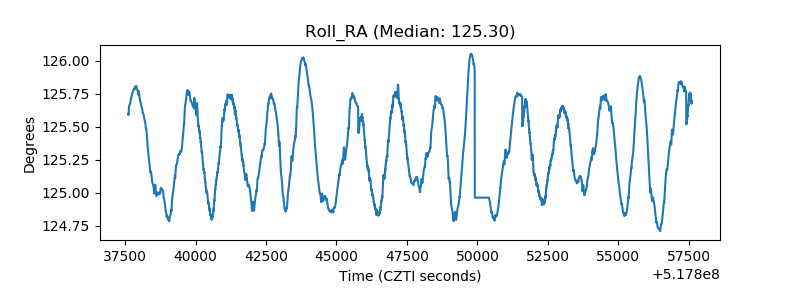 |
| Veto Counter | 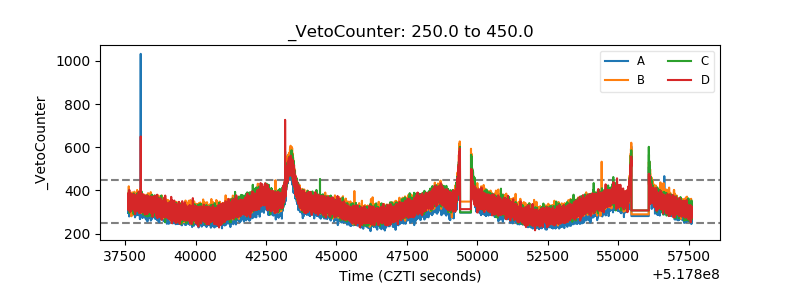 |