| Param | Original file | Final file |
|---|---|---|
| Filename | modeM0/AS1A14_083T16_9000006580_57737cztM0_level2.fits | modeM0/AS1A14_083T16_9000006580_57737cztM0_level2_quad_clean.evt |
| Size (bytes) | 496,834,560 | 100,523,520 |
| Size | 473.8 MB | 95.9 MB |
| Events in quadrant A | 3,681,538 | 674,078 |
| Events in quadrant B | 3,830,966 | 701,358 |
| Events in quadrant C | 6,261,148 | 576,974 |
| Events in quadrant D | 4,070,911 | 601,331 |
| Mode SS | |||
|---|---|---|---|
| Quadrant | BADHDUFLAG | Total packets | Discarded packets |
| A | 0 | 142 | 0 |
| B | 0 | 142 | 0 |
| C | 0 | 142 | 0 |
| D | 0 | 142 | 0 |
| Mode M0 | |||
|---|---|---|---|
| Quadrant | BADHDUFLAG | Total packets | Discarded packets |
| A | 0 | 16206 | 3 |
| B | 0 | 16542 | 2 |
| C | 0 | 23542 | 2 |
| D | 0 | 16970 | 2 |
| Mode M9 | |||
|---|---|---|---|
| Quadrant | BADHDUFLAG | Total packets | Discarded packets |
| A | 0 | 12 | 0 |
| B | 0 | 13 | 0 |
| C | 0 | 13 | 0 |
| D | 0 | 13 | 0 |
| Quadrant | Total seconds | Saturated seconds | Saturation percentage |
|---|---|---|---|
| A | 7035 | 109 | 1.549396% |
| B | 7035 | 203 | 2.885572% |
| C | 7035 | 850 | 12.082445% |
| D | 7035 | 159 | 2.260128% |
Noise dominated data is calculated using 1-second bins in cleaned event files. If a bin has >2000 counts, and if more than 50% of those come from <1% of pixels, then it is considered to be noise-dominated and hence unusable.
| Quadrant | # 1 sec bins | Bins with >0 counts | Bins with >2000 counts | High rate bins dominated by noise | Noise dominated (total time) | Noise dominated (detector-on time) | Marked lightcurve |
|---|---|---|---|---|---|---|---|
| A | 7830 | 7035 | 70 | 70 | 0.89% | 1.00% | 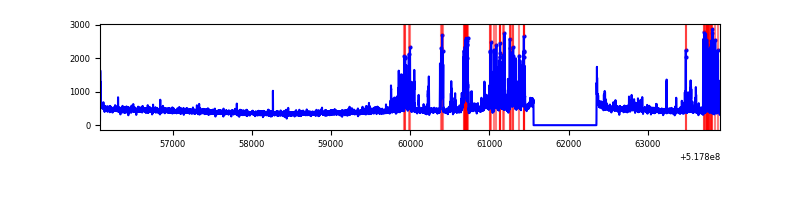 |
| B | 7830 | 7035 | 63 | 63 | 0.80% | 0.90% | 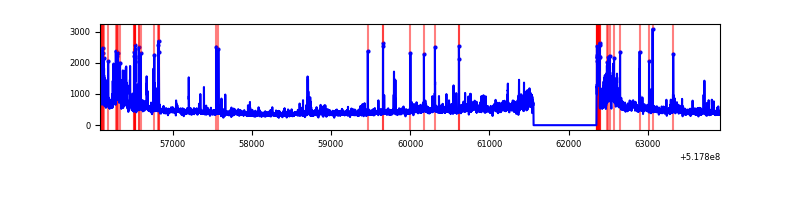 |
| C | 7830 | 7035 | 768 | 768 | 9.81% | 10.92% | 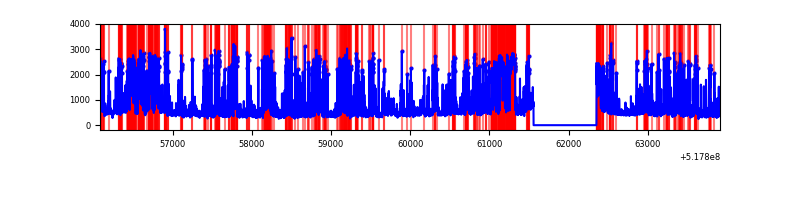 |
| D | 7830 | 7035 | 146 | 146 | 1.86% | 2.08% | 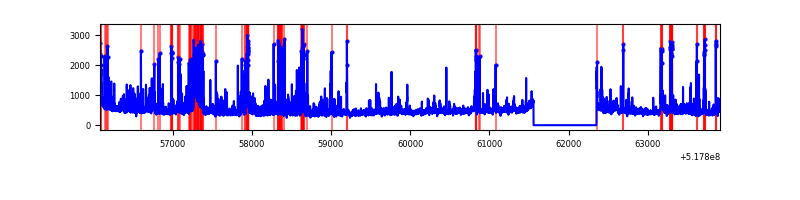 |
Top three noisy pixels from each quadrant. If the there are fewer than three noisy pixels in the level2.evt file, extra rows are filled as -1
| Pixel properties | Quadrant properties | ||||||
|---|---|---|---|---|---|---|---|
| Quadrant | DetID | PixID | Counts | Sigma | Mean | Median | Sigma |
| A | 7 | 160 | 371352 | 1977.25 | 756 | 736 | 187.4 |
| A | 0 | 12 | 320328 | 1705.04 | 756 | 736 | 187.4 |
| A | 3 | 128 | 39474 | 206.67 | 756 | 736 | 187.4 |
| B | 10 | 16 | 290459 | 1835.57 | 738 | 711 | 157.9 |
| B | 5 | 185 | 187636 | 1184.18 | 738 | 711 | 157.9 |
| B | 4 | 80 | 158447 | 999.27 | 738 | 711 | 157.9 |
| C | 15 | 224 | 3107235 | 16608.23 | 686 | 676 | 187.0 |
| C | 9 | 38 | 246158 | 1312.39 | 686 | 676 | 187.0 |
| C | 12 | 2 | 78862 | 417.99 | 686 | 676 | 187.0 |
| D | 2 | 249 | 317596 | 1550.57 | 721 | 687 | 204.4 |
| D | 3 | 224 | 209599 | 1022.17 | 721 | 687 | 204.4 |
| D | 9 | 49 | 199335 | 971.95 | 721 | 687 | 204.4 |
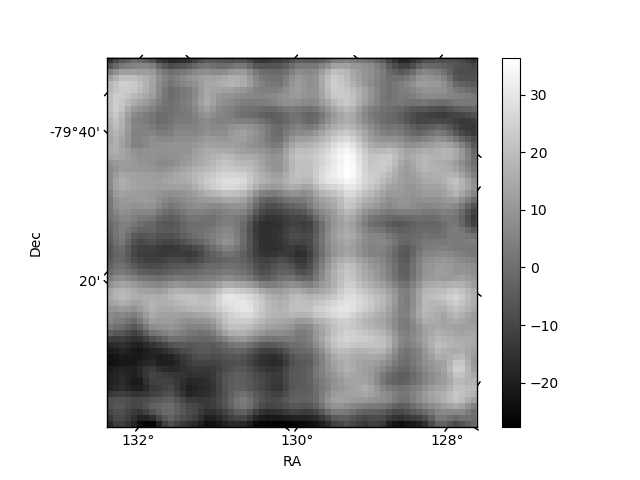
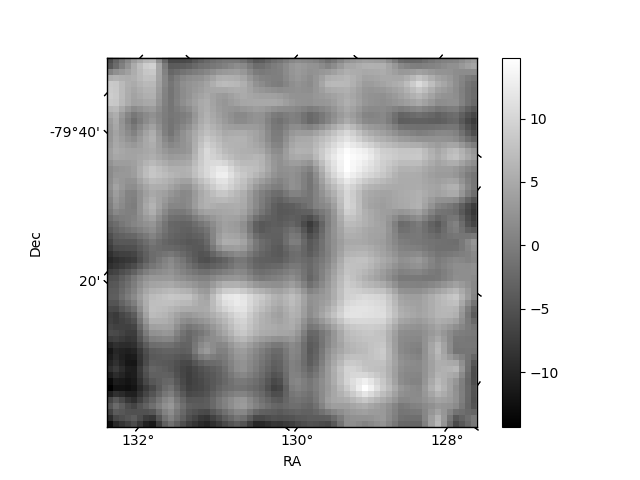
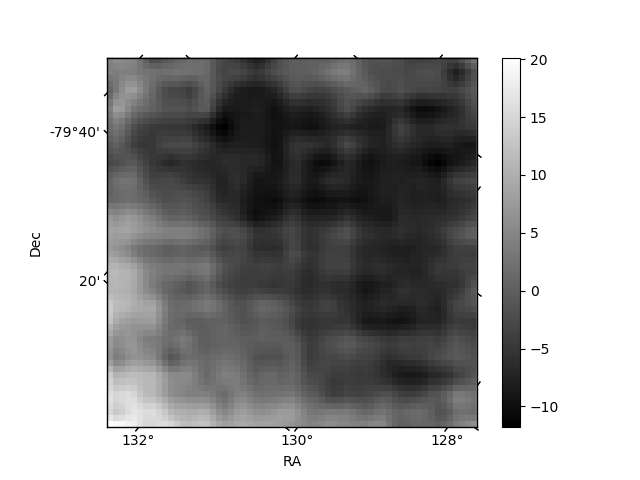
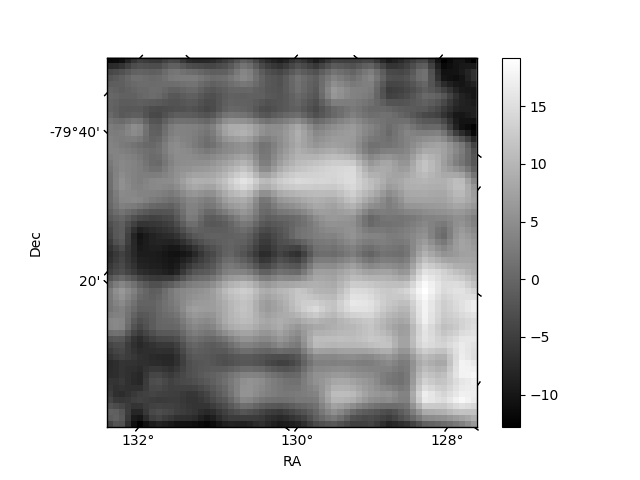
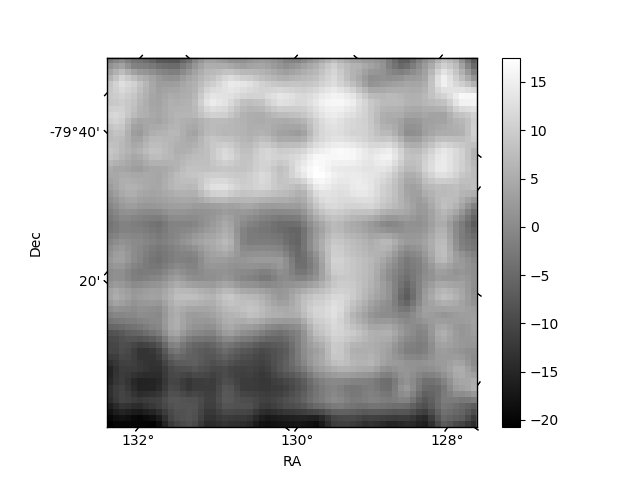
Histogram calculated using DETX and DETY for each event in the final _common_clean file
| Quadrant A | 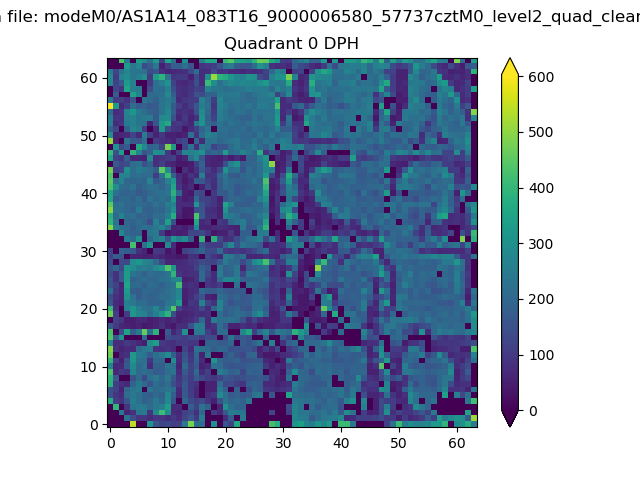 |
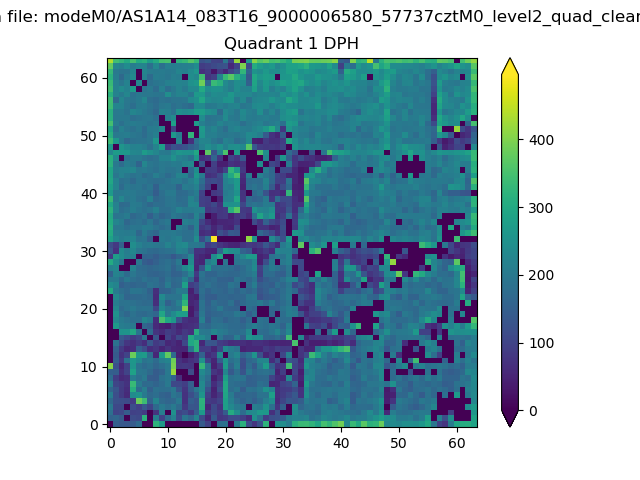 |
Quadrant B |
|---|---|---|---|
| Quadrant D | 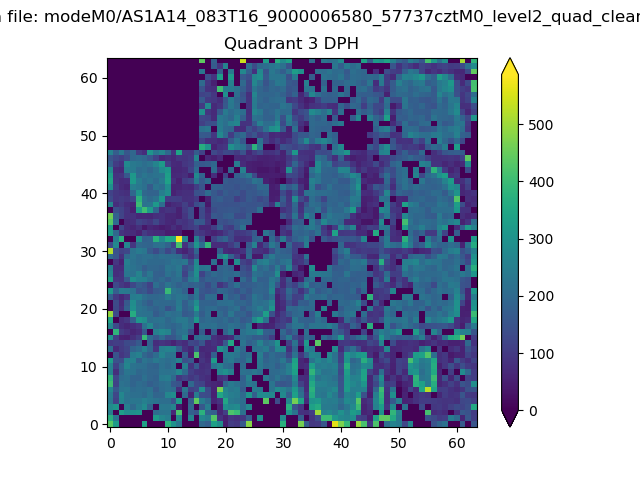 |
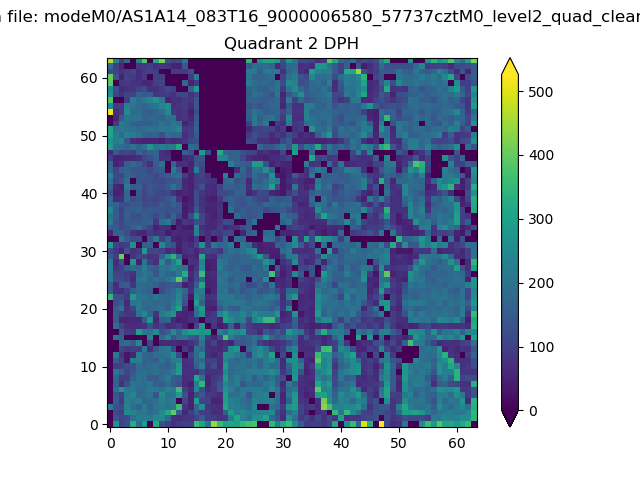 |
Quadrant C |
| Plot type | Count rate plots | Images |
|---|---|---|
| Comparison with Poisson distribution Blue bars denote a histogram of data divided into 1 sec bins. Red curve is a Poisson curve with rate = median count rate of data. |
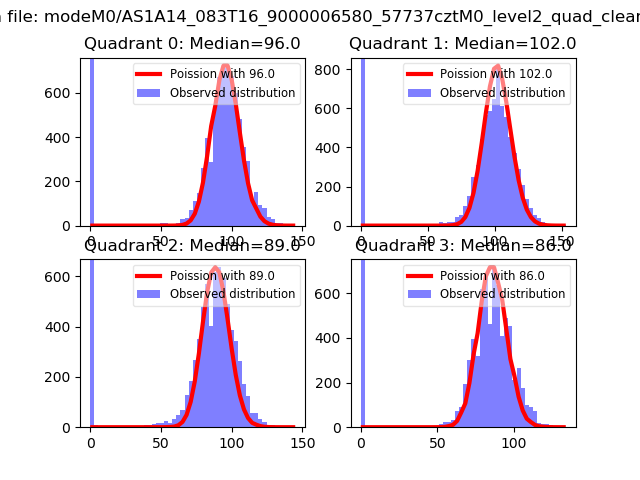 |
 |
| Quadrant-wise count rates Data is divided into 100 sec bins |
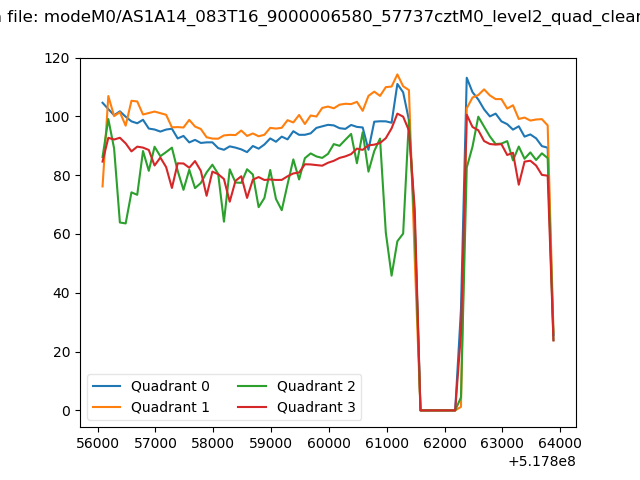 |
|
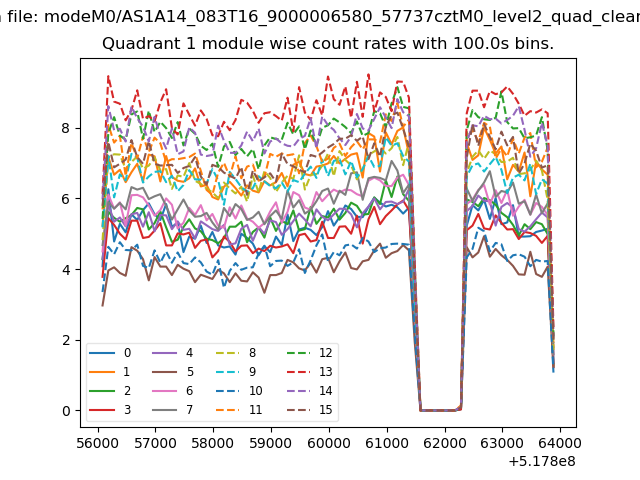
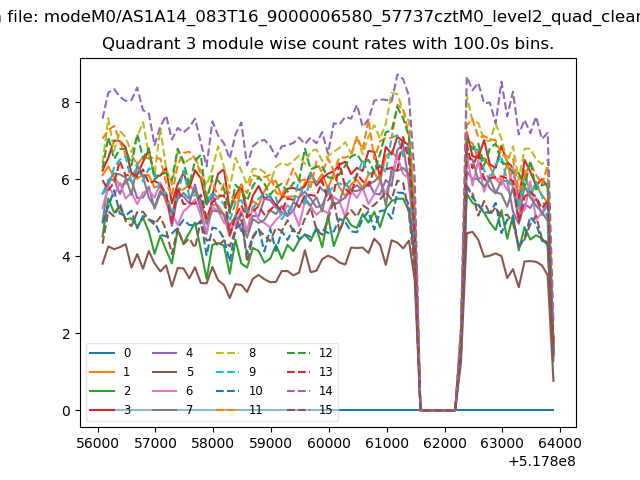
| Module-wise count rates for Quadrant A Data is divided into 100 sec bins |
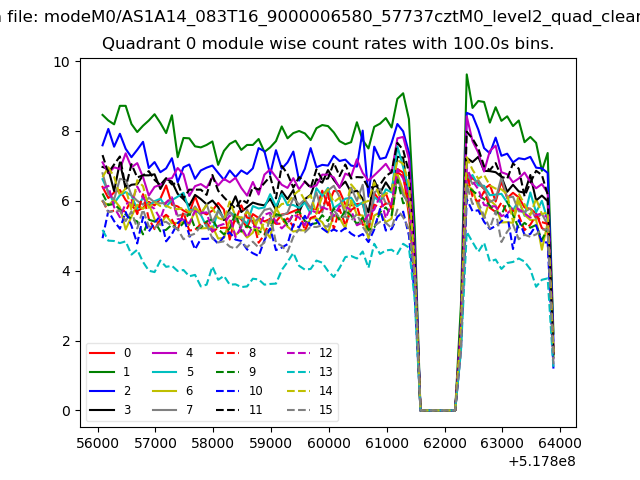 |
 |
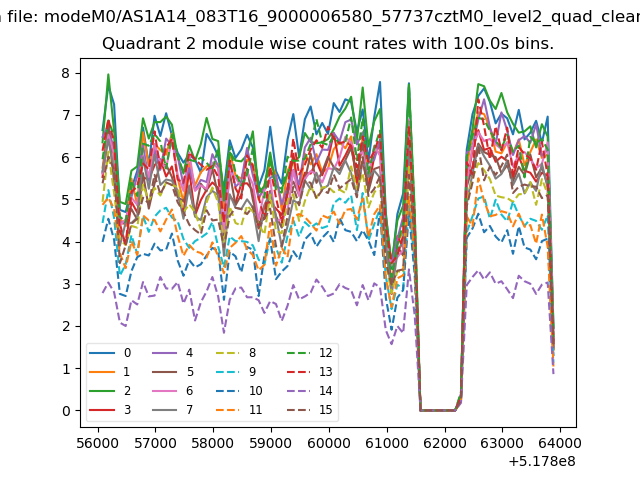
| Module-wise count rates for Quadrant B Data is divided into 100 sec bins |
 |
 |
| Module-wise count rates for Quadrant C Data is divided into 100 sec bins |
 |
 |
| Module-wise count rates for Quadrant D Data is divided into 100 sec bins |
 |
 |
| Parameter | Plot |
|---|---|
| CZT HV Monitor | 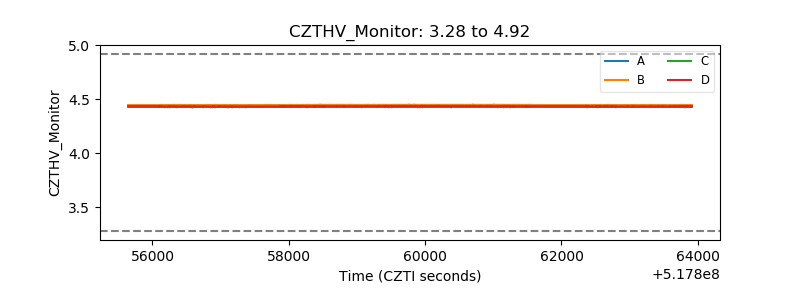 |
| D_VDD | 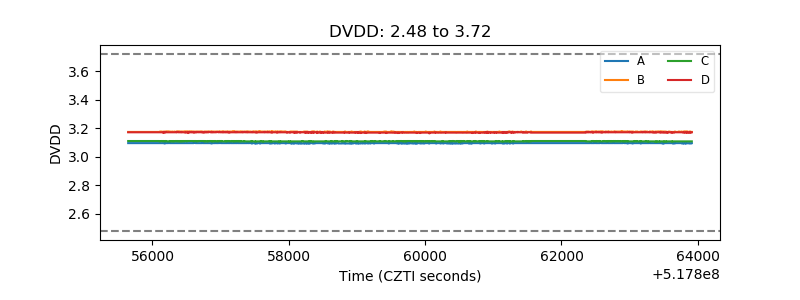 |
| Temperature 1 | 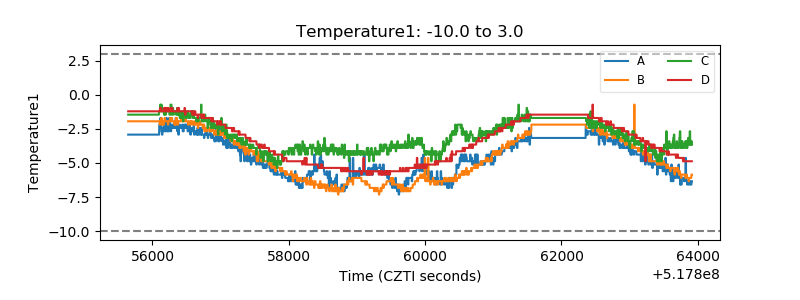 |
| Veto HV Monitor | 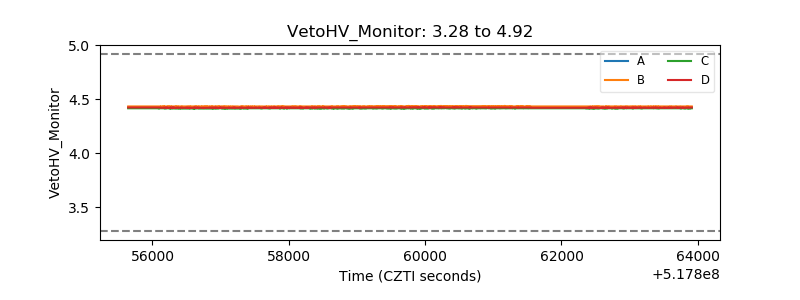 |
| Veto LLD | 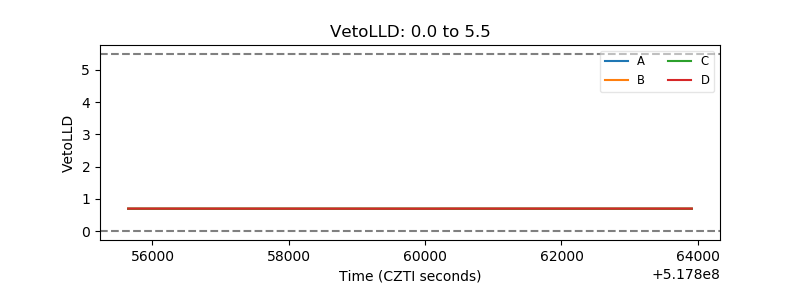 |
| Alpha Counter | 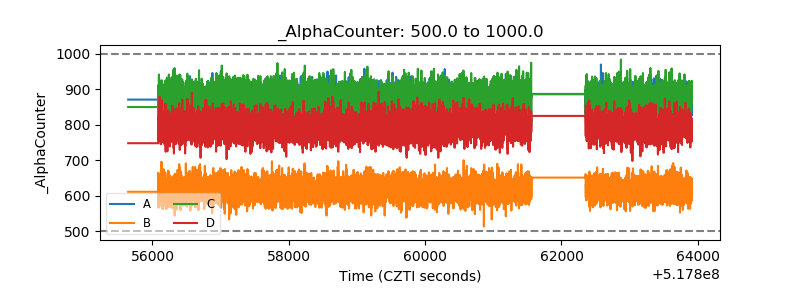 |
| _CPM_Rate | 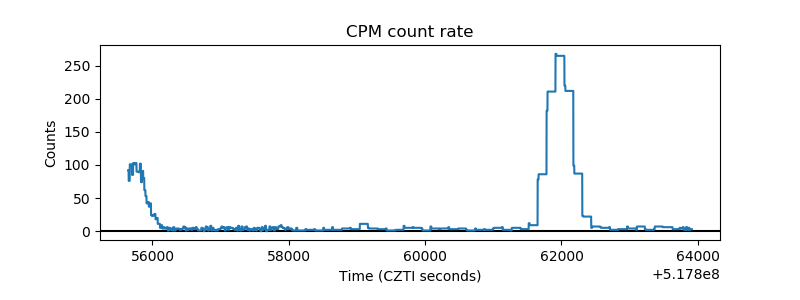 |
| CZT Counter | 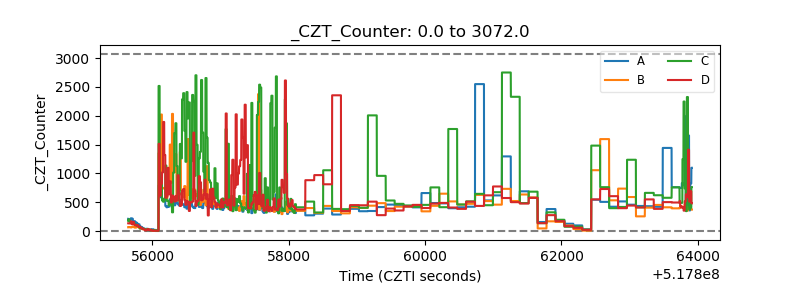 |
| +2.5 Volts monitor | 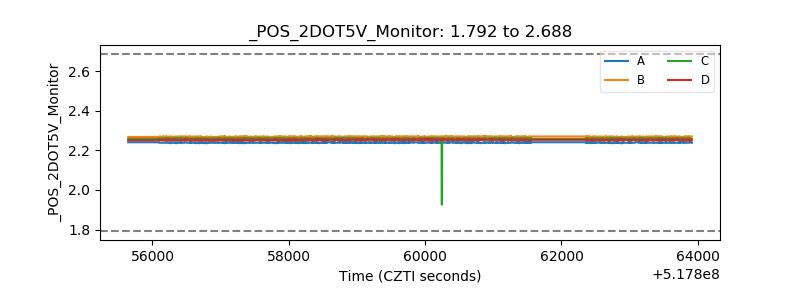 |
| +5 Volts monitor |  |
| _ROLL_ROT | 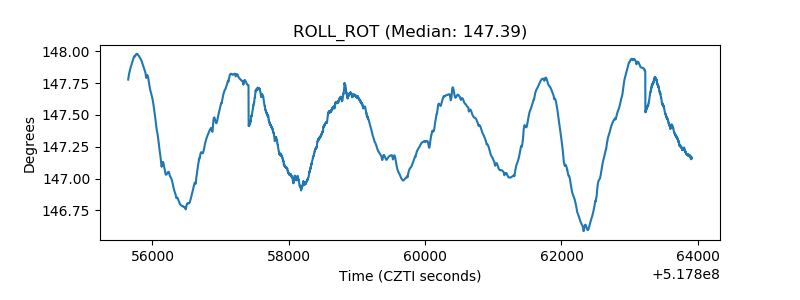 |
| _Roll_DEC | 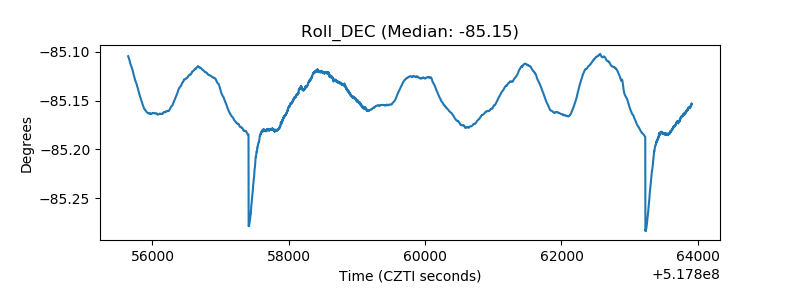 |
| _Roll_RA | 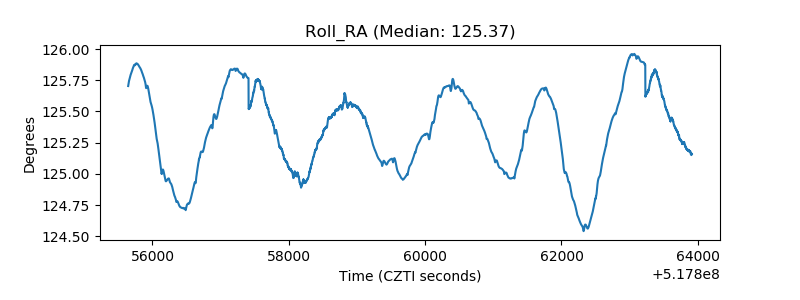 |
| Veto Counter | 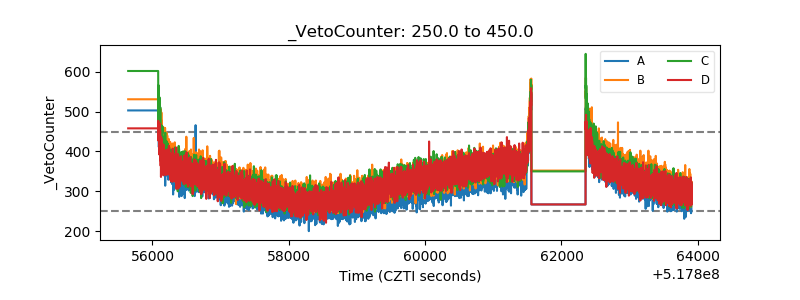 |