| Param | Original file | Final file |
|---|---|---|
| Filename | modeM0/AS1A14_083T16_9000006580_57739cztM0_level2.fits | modeM0/AS1A14_083T16_9000006580_57739cztM0_level2_quad_clean.evt |
| Size (bytes) | 460,238,400 | 96,255,360 |
| Size | 438.9 MB | 91.8 MB |
| Events in quadrant A | 3,282,803 | 644,154 |
| Events in quadrant B | 4,722,451 | 659,668 |
| Events in quadrant C | 4,882,473 | 579,688 |
| Events in quadrant D | 3,637,207 | 571,589 |
| Mode SS | |||
|---|---|---|---|
| Quadrant | BADHDUFLAG | Total packets | Discarded packets |
| A | 0 | 134 | 0 |
| B | 0 | 134 | 0 |
| C | 0 | 134 | 0 |
| D | 0 | 134 | 0 |
| Mode M0 | |||
|---|---|---|---|
| Quadrant | BADHDUFLAG | Total packets | Discarded packets |
| A | 0 | 14479 | 8 |
| B | 0 | 18737 | 2 |
| C | 0 | 19092 | 2 |
| D | 0 | 15625 | 5 |
| Mode M9 | |||
|---|---|---|---|
| Quadrant | BADHDUFLAG | Total packets | Discarded packets |
| A | 0 | 13 | 0 |
| B | 0 | 13 | 0 |
| C | 0 | 13 | 0 |
| D | 0 | 14 | 0 |
| Quadrant | Total seconds | Saturated seconds | Saturation percentage |
|---|---|---|---|
| A | 6585 | 49 | 0.744115% |
| B | 6588 | 281 | 4.265331% |
| C | 6588 | 402 | 6.102004% |
| D | 6586 | 99 | 1.503189% |
Noise dominated data is calculated using 1-second bins in cleaned event files. If a bin has >2000 counts, and if more than 50% of those come from <1% of pixels, then it is considered to be noise-dominated and hence unusable.
| Quadrant | # 1 sec bins | Bins with >0 counts | Bins with >2000 counts | High rate bins dominated by noise | Noise dominated (total time) | Noise dominated (detector-on time) | Marked lightcurve |
|---|---|---|---|---|---|---|---|
| A | 7568 | 6588 | 40 | 40 | 0.53% | 0.61% | 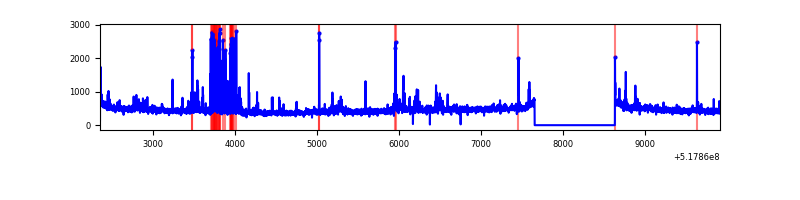 |
| B | 7568 | 6588 | 130 | 130 | 1.72% | 1.97% | 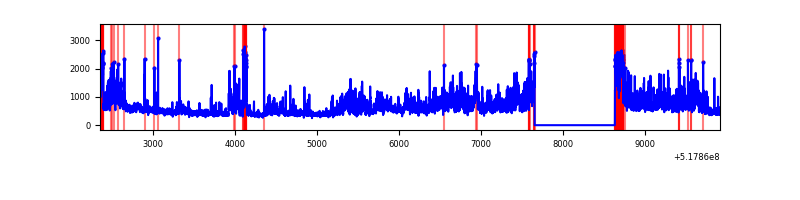 |
| C | 7568 | 6589 | 357 | 357 | 4.72% | 5.42% | 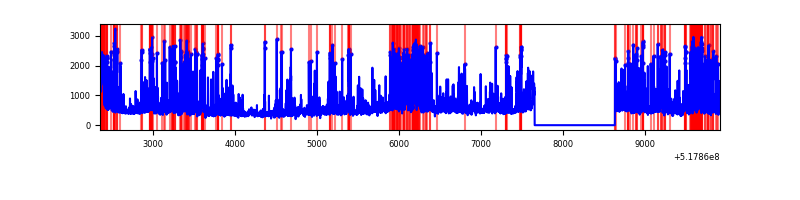 |
| D | 7567 | 6588 | 82 | 82 | 1.08% | 1.24% | 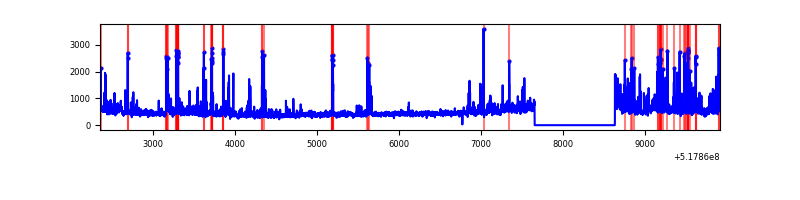 |
Top three noisy pixels from each quadrant. If the there are fewer than three noisy pixels in the level2.evt file, extra rows are filled as -1
| Pixel properties | Quadrant properties | ||||||
|---|---|---|---|---|---|---|---|
| Quadrant | DetID | PixID | Counts | Sigma | Mean | Median | Sigma |
| A | 7 | 160 | 266391 | 1518.67 | 707 | 689 | 175.0 |
| A | 0 | 12 | 213516 | 1216.45 | 707 | 689 | 175.0 |
| A | 3 | 128 | 32019 | 179.07 | 707 | 689 | 175.0 |
| B | 4 | 80 | 1120016 | 7569.37 | 686 | 659 | 147.9 |
| B | 10 | 16 | 404570 | 2731.35 | 686 | 659 | 147.9 |
| B | 5 | 185 | 124564 | 837.88 | 686 | 659 | 147.9 |
| C | 15 | 224 | 1872544 | 10256.15 | 665 | 658 | 182.5 |
| C | 9 | 38 | 114675 | 624.7 | 665 | 658 | 182.5 |
| C | 12 | 249 | 100672 | 547.98 | 665 | 658 | 182.5 |
| D | 9 | 49 | 323031 | 1678.13 | 675 | 643 | 192.1 |
| D | 2 | 31 | 211383 | 1096.96 | 675 | 643 | 192.1 |
| D | 2 | 249 | 133932 | 693.81 | 675 | 643 | 192.1 |
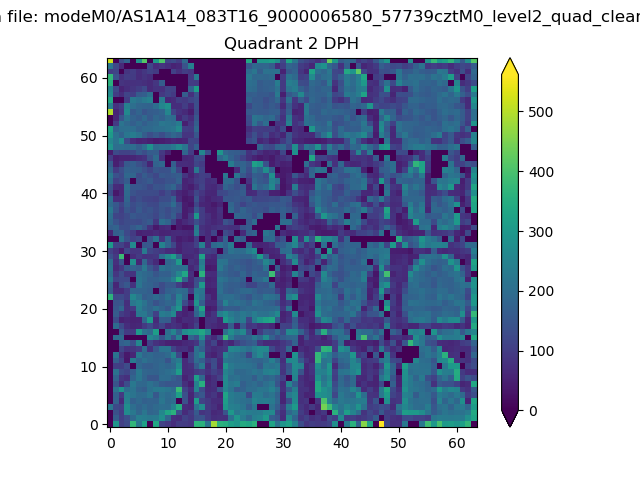
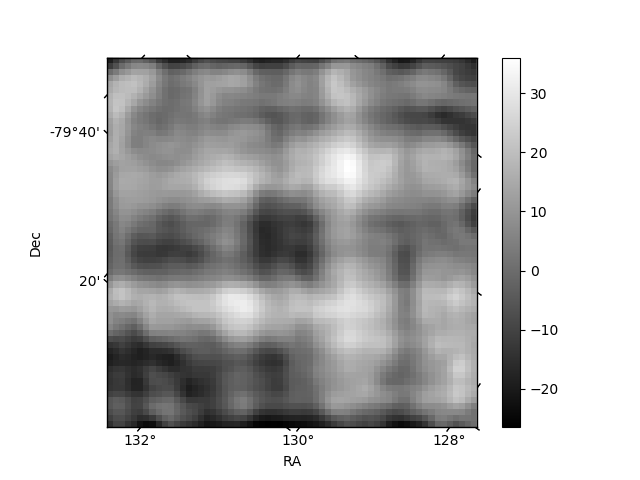
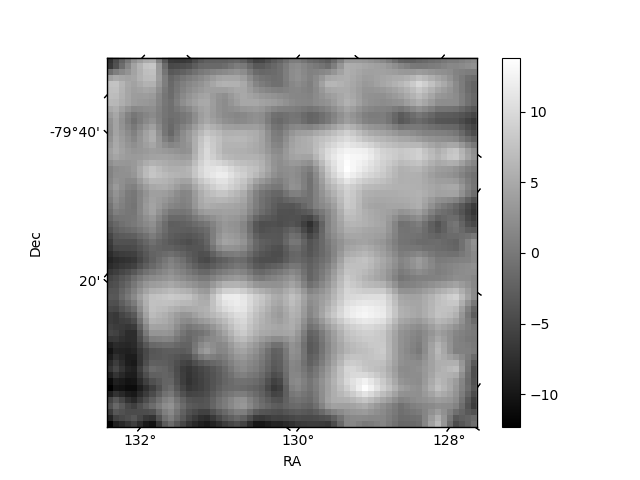
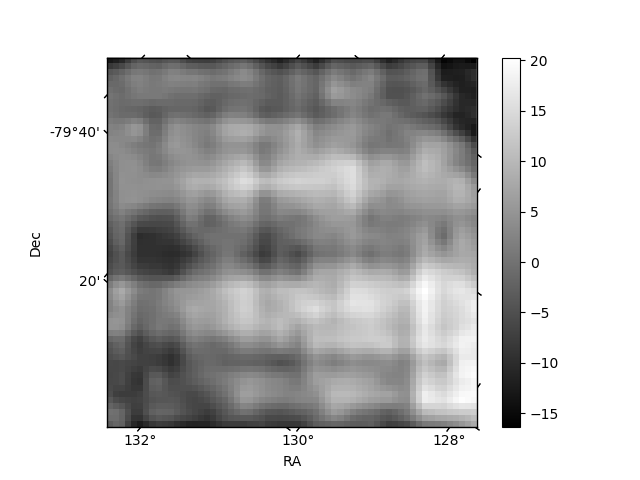
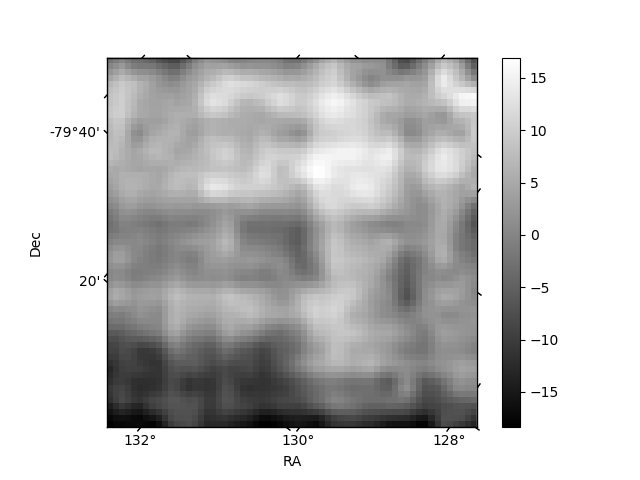
Histogram calculated using DETX and DETY for each event in the final _common_clean file
| Quadrant A | 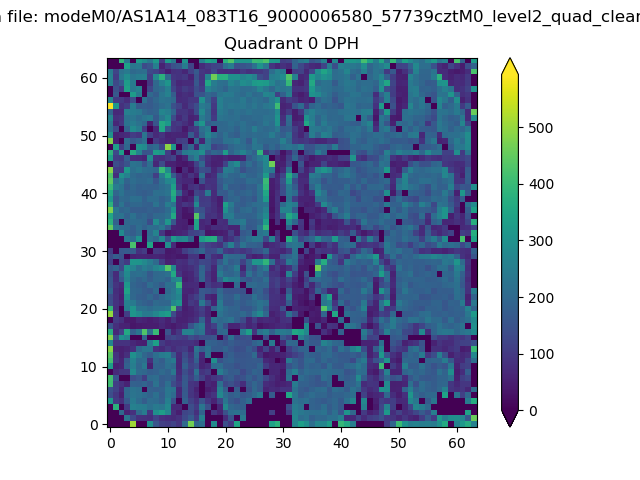 |
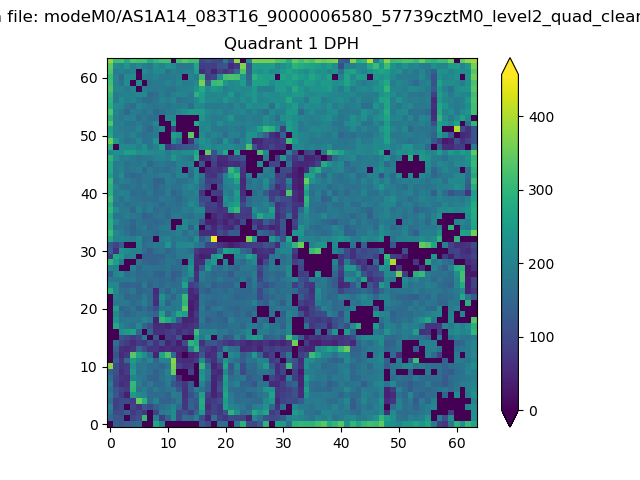 |
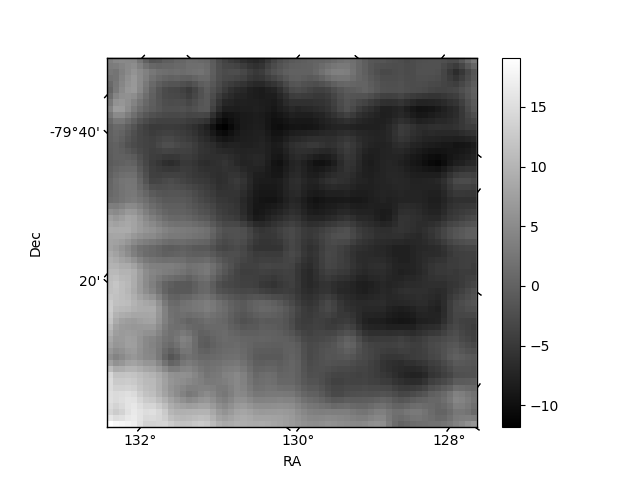
Quadrant B |
|---|---|---|---|
| Quadrant D | 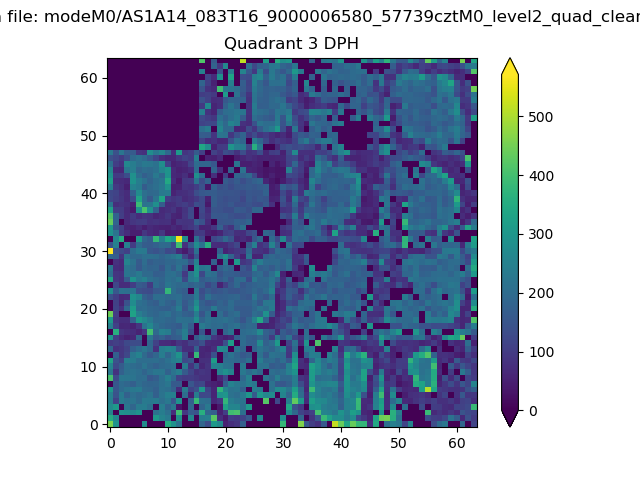 |
 |
Quadrant C |
| Plot type | Count rate plots | Images |
|---|---|---|
| Comparison with Poisson distribution Blue bars denote a histogram of data divided into 1 sec bins. Red curve is a Poisson curve with rate = median count rate of data. |
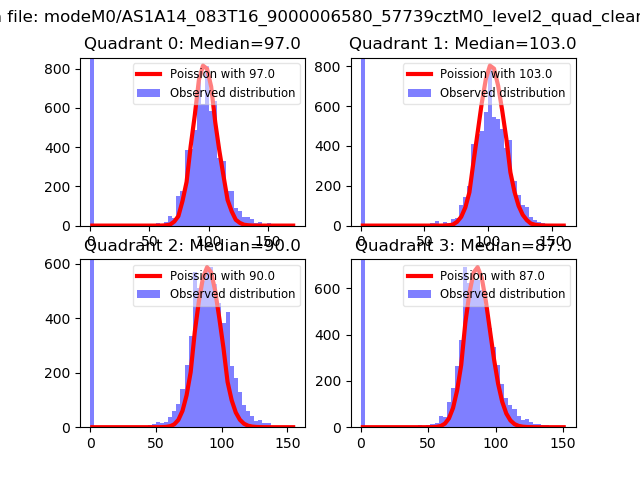 |
 |
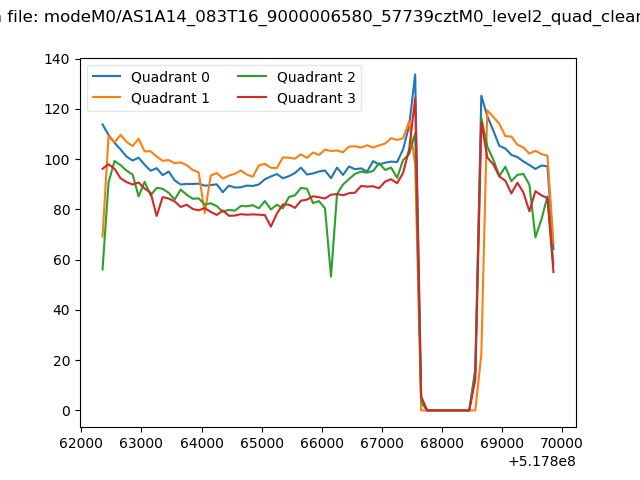
| Quadrant-wise count rates Data is divided into 100 sec bins |
 |
|
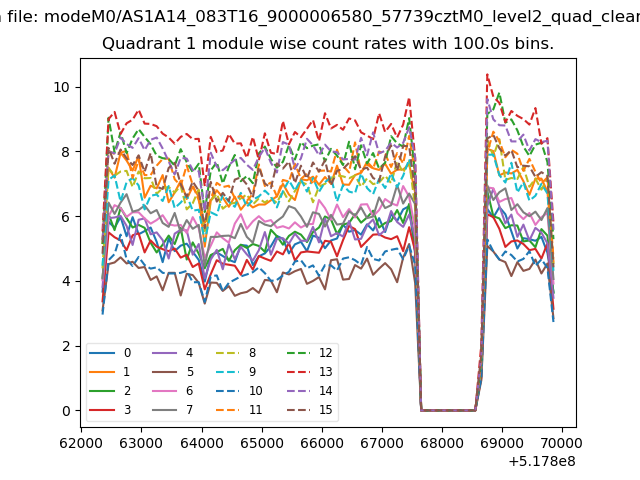
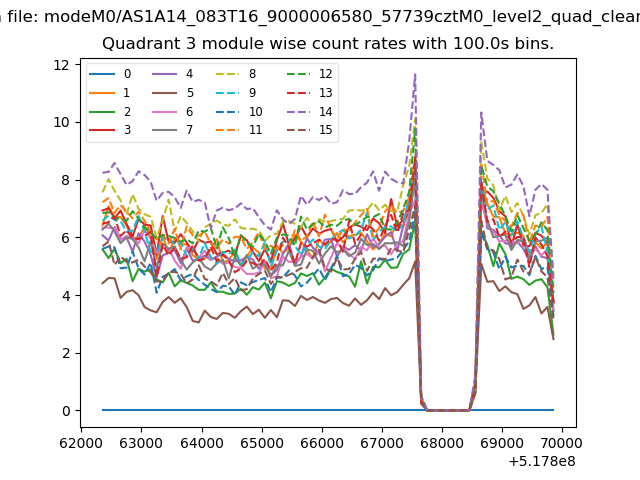
| Module-wise count rates for Quadrant A Data is divided into 100 sec bins |
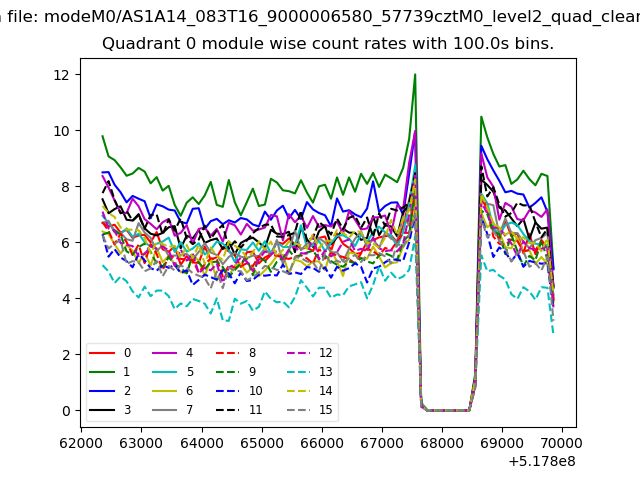 |
 |
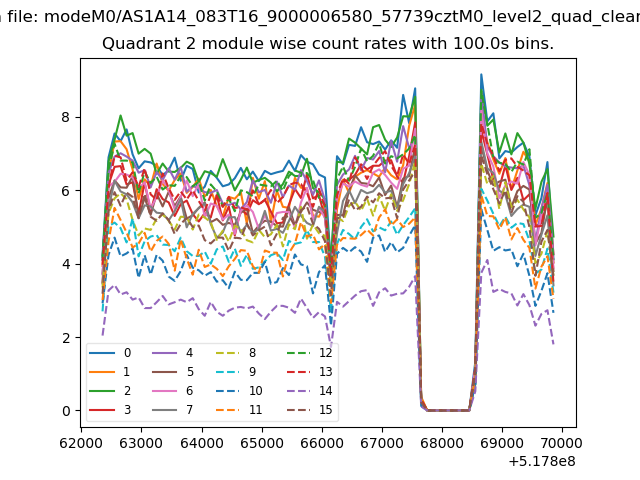
| Module-wise count rates for Quadrant B Data is divided into 100 sec bins |
 |
 |
| Module-wise count rates for Quadrant C Data is divided into 100 sec bins |
 |
 |
| Module-wise count rates for Quadrant D Data is divided into 100 sec bins |
 |
 |
| Parameter | Plot |
|---|---|
| CZT HV Monitor | 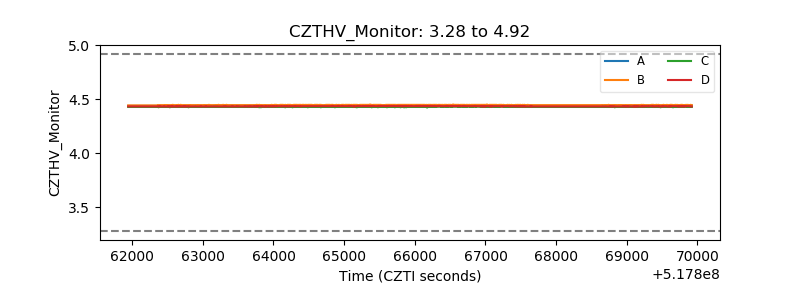 |
| D_VDD | 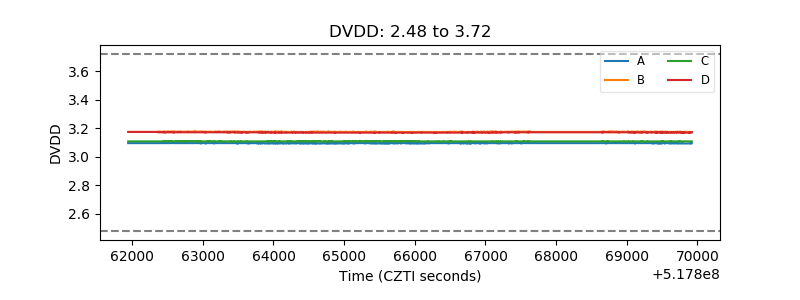 |
| Temperature 1 | 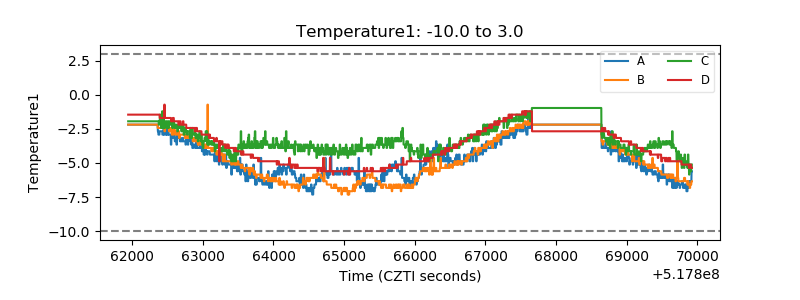 |
| Veto HV Monitor | 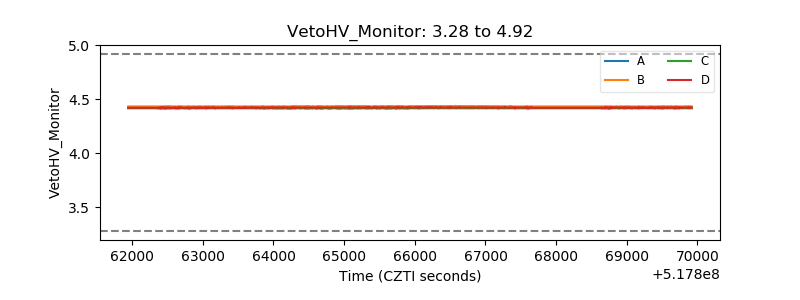 |
| Veto LLD | 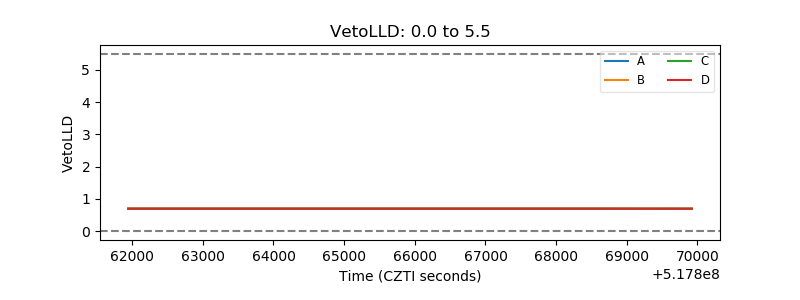 |
| Alpha Counter | 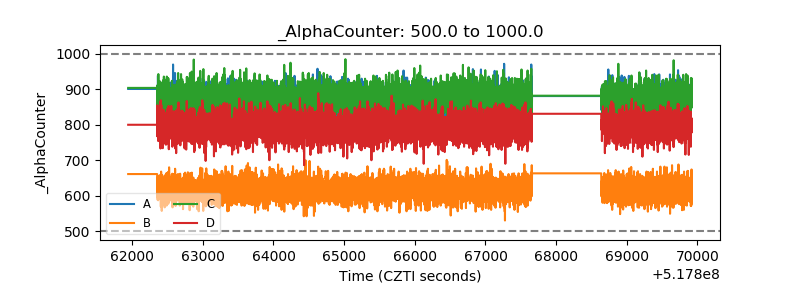 |
| _CPM_Rate | 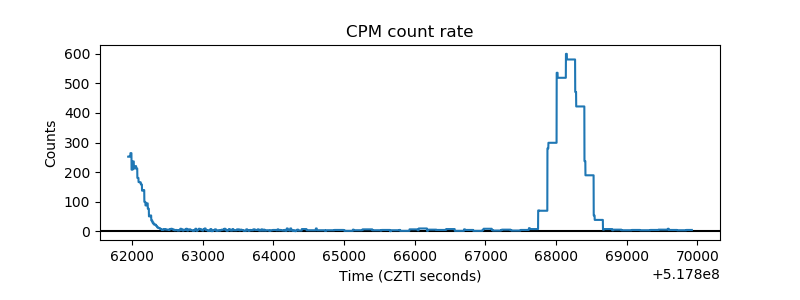 |
| CZT Counter | 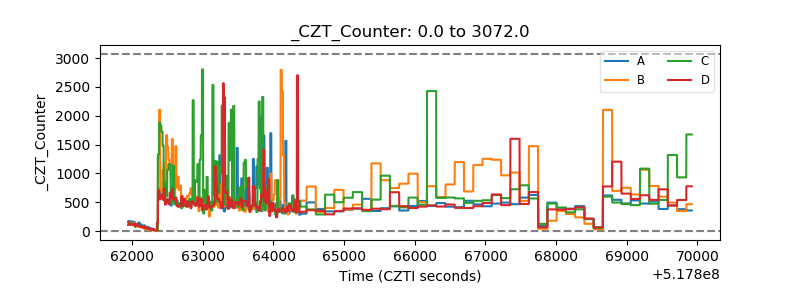 |
| +2.5 Volts monitor | 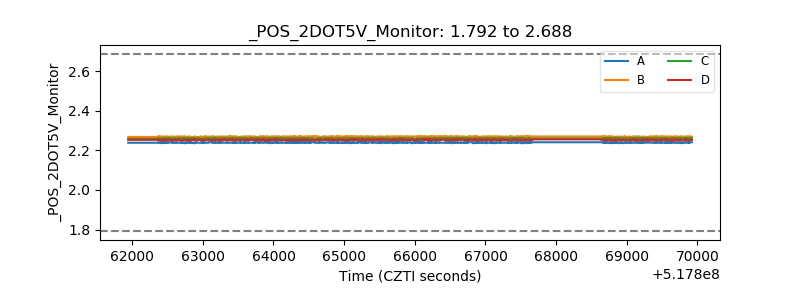 |
| +5 Volts monitor |  |
| _ROLL_ROT | 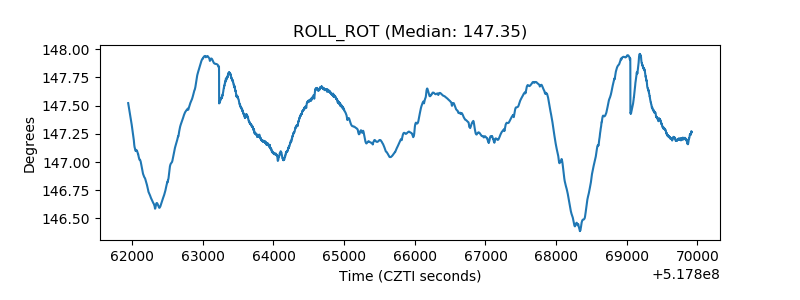 |
| _Roll_DEC | 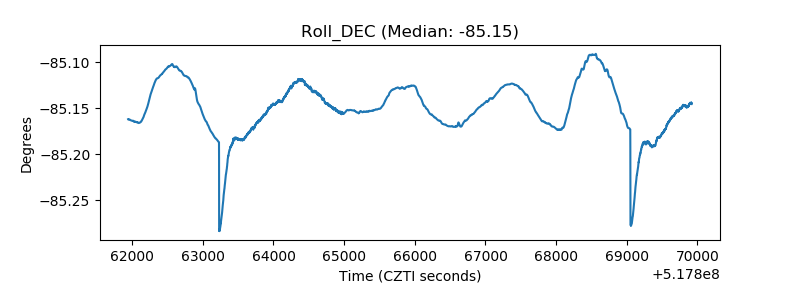 |
| _Roll_RA | 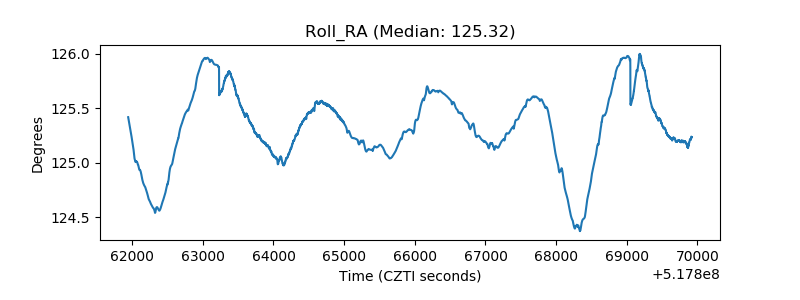 |
| Veto Counter | 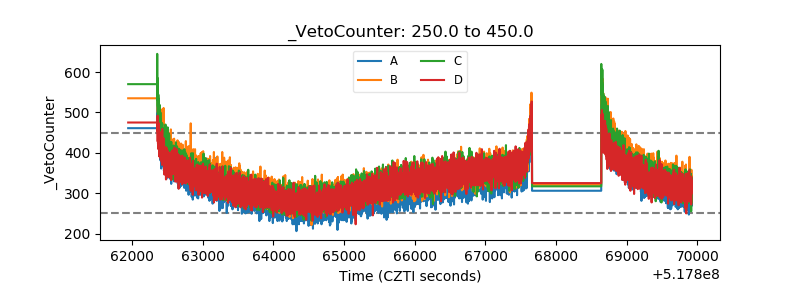 |