| Param | Original file | Final file |
|---|---|---|
| Filename | modeM0/AS1A14_083T16_9000006580_57740cztM0_level2.fits | modeM0/AS1A14_083T16_9000006580_57740cztM0_level2_quad_clean.evt |
| Size (bytes) | 508,187,520 | 95,552,640 |
| Size | 484.6 MB | 91.1 MB |
| Events in quadrant A | 3,258,228 | 648,502 |
| Events in quadrant B | 4,638,877 | 668,837 |
| Events in quadrant C | 6,567,394 | 540,131 |
| Events in quadrant D | 3,837,017 | 577,469 |
| Mode SS | |||
|---|---|---|---|
| Quadrant | BADHDUFLAG | Total packets | Discarded packets |
| A | 0 | 134 | 0 |
| B | 0 | 134 | 0 |
| C | 0 | 134 | 0 |
| D | 0 | 134 | 0 |
| Mode M0 | |||
|---|---|---|---|
| Quadrant | BADHDUFLAG | Total packets | Discarded packets |
| A | 0 | 14295 | 10 |
| B | 0 | 18385 | 18 |
| C | 0 | 24084 | 22 |
| D | 0 | 15966 | 2 |
| Mode M9 | |||
|---|---|---|---|
| Quadrant | BADHDUFLAG | Total packets | Discarded packets |
| A | 0 | 14 | 0 |
| B | 0 | 14 | 0 |
| C | 0 | 14 | 0 |
| D | 0 | 15 | 0 |
| Quadrant | Total seconds | Saturated seconds | Saturation percentage |
|---|---|---|---|
| A | 6569 | 52 | 0.791597% |
| B | 6568 | 274 | 4.171742% |
| C | 6569 | 1012 | 15.405693% |
| D | 6572 | 80 | 1.217285% |
Noise dominated data is calculated using 1-second bins in cleaned event files. If a bin has >2000 counts, and if more than 50% of those come from <1% of pixels, then it is considered to be noise-dominated and hence unusable.
| Quadrant | # 1 sec bins | Bins with >0 counts | Bins with >2000 counts | High rate bins dominated by noise | Noise dominated (total time) | Noise dominated (detector-on time) | Marked lightcurve |
|---|---|---|---|---|---|---|---|
| A | 7647 | 6573 | 9 | 9 | 0.12% | 0.14% | 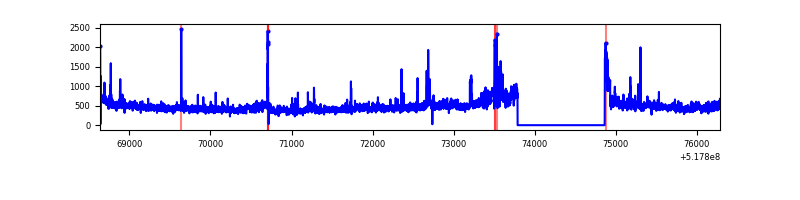 |
| B | 7647 | 6571 | 105 | 105 | 1.37% | 1.60% | 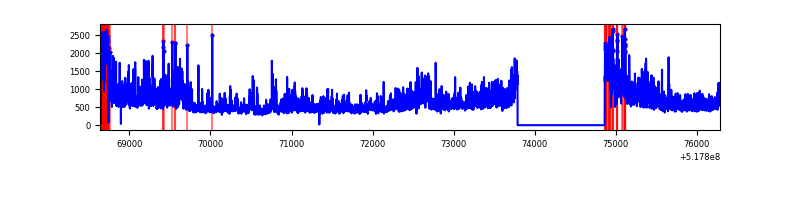 |
| C | 7647 | 6572 | 969 | 969 | 12.67% | 14.74% | 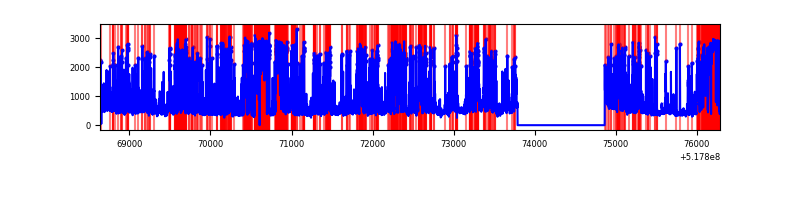 |
| D | 7647 | 6573 | 69 | 69 | 0.90% | 1.05% | 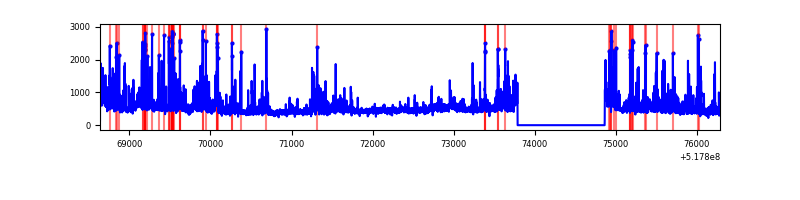 |
Top three noisy pixels from each quadrant. If the there are fewer than three noisy pixels in the level2.evt file, extra rows are filled as -1
| Pixel properties | Quadrant properties | ||||||
|---|---|---|---|---|---|---|---|
| Quadrant | DetID | PixID | Counts | Sigma | Mean | Median | Sigma |
| A | 7 | 160 | 418144 | 2394.17 | 703 | 684 | 174.4 |
| A | 3 | 128 | 55628 | 315.11 | 703 | 684 | 174.4 |
| A | 3 | 17 | 31483 | 176.63 | 703 | 684 | 174.4 |
| B | 4 | 80 | 1297669 | 8883.31 | 685 | 659 | 146.0 |
| B | 10 | 16 | 361773 | 2473.29 | 685 | 659 | 146.0 |
| B | 10 | 247 | 71979 | 488.48 | 685 | 659 | 146.0 |
| C | 15 | 224 | 3798376 | 21743.26 | 636 | 631 | 174.7 |
| C | 12 | 249 | 75740 | 430.02 | 636 | 631 | 174.7 |
| C | 14 | 254 | 62784 | 355.84 | 636 | 631 | 174.7 |
| D | 9 | 49 | 291335 | 1495.13 | 676 | 643 | 194.4 |
| D | 2 | 31 | 251027 | 1287.81 | 676 | 643 | 194.4 |
| D | 3 | 224 | 232480 | 1192.42 | 676 | 643 | 194.4 |
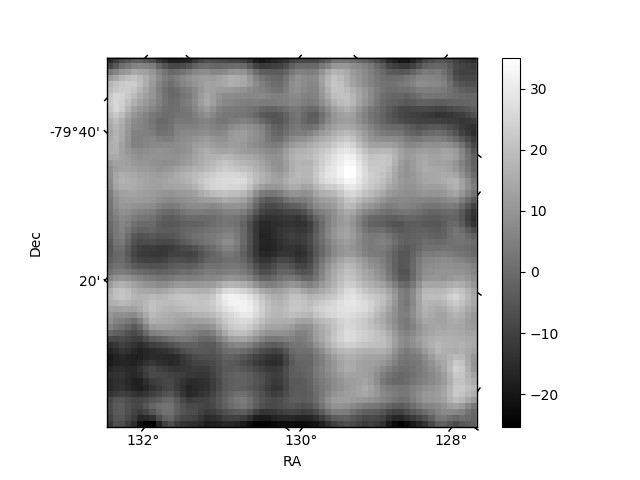
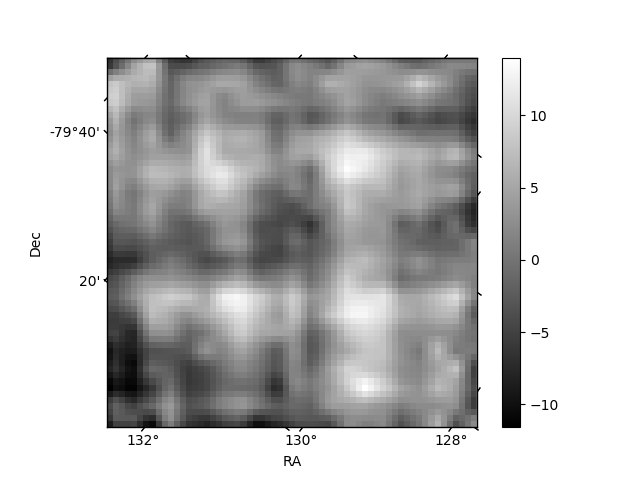
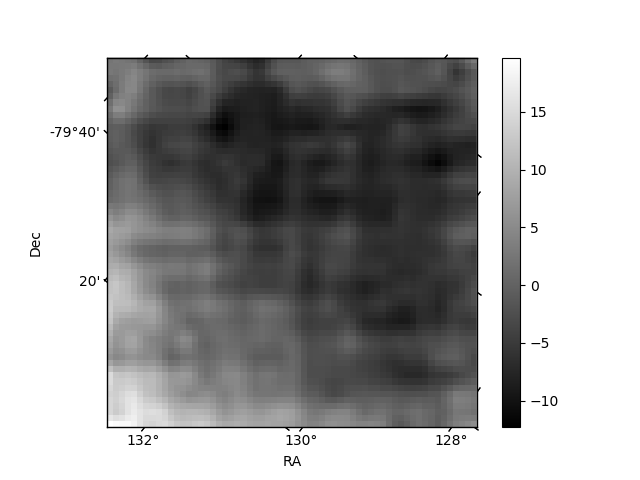
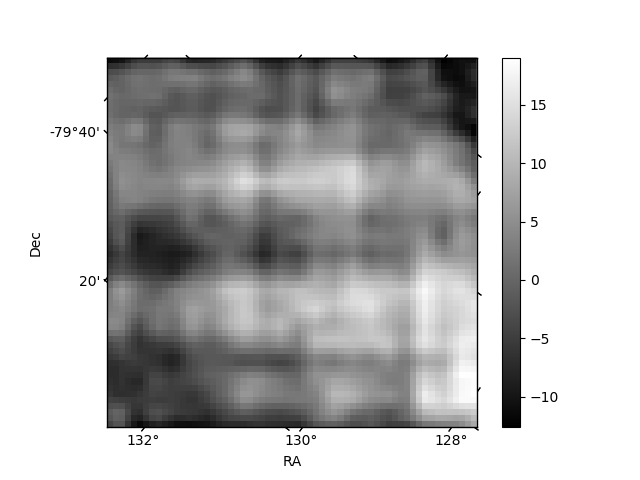
Histogram calculated using DETX and DETY for each event in the final _common_clean file
| Quadrant A | 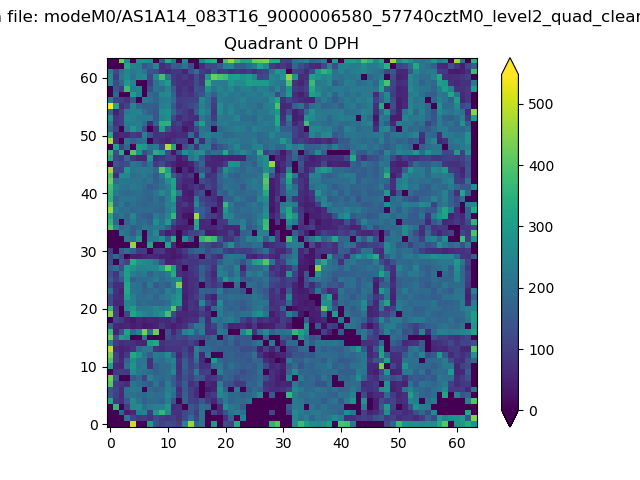 |
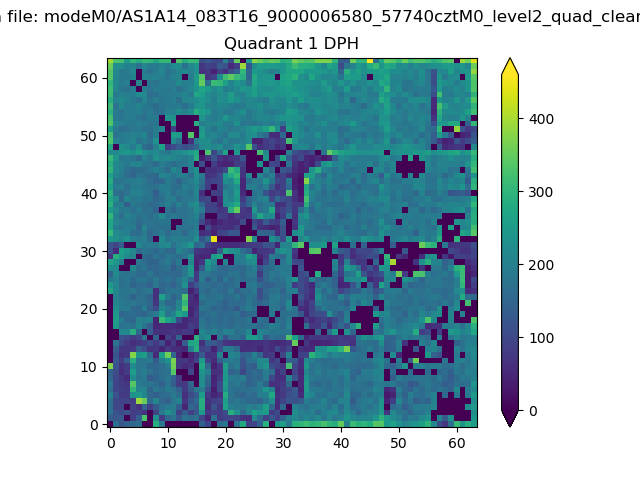 |
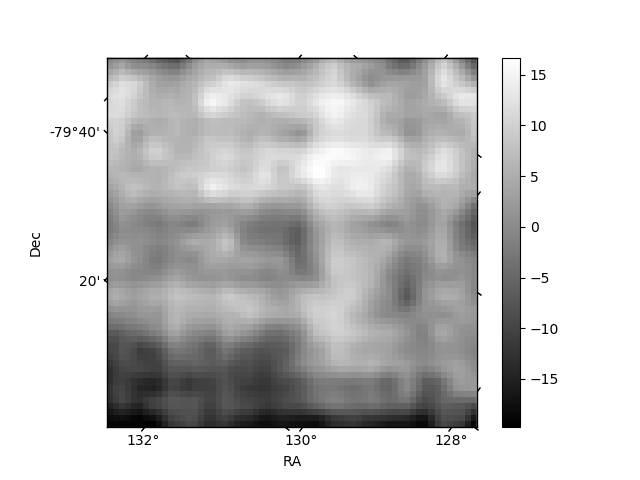
Quadrant B |
|---|---|---|---|
| Quadrant D | 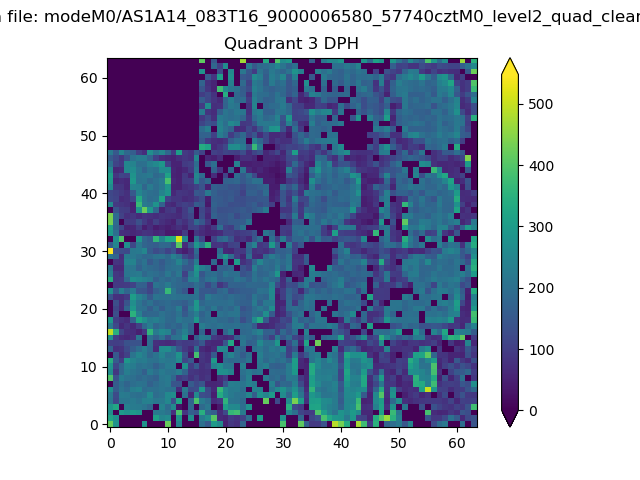 |
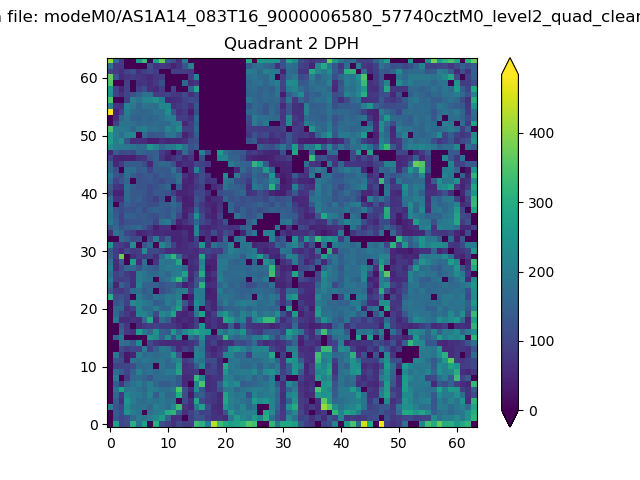 |
Quadrant C |
| Plot type | Count rate plots | Images |
|---|---|---|
| Comparison with Poisson distribution Blue bars denote a histogram of data divided into 1 sec bins. Red curve is a Poisson curve with rate = median count rate of data. |
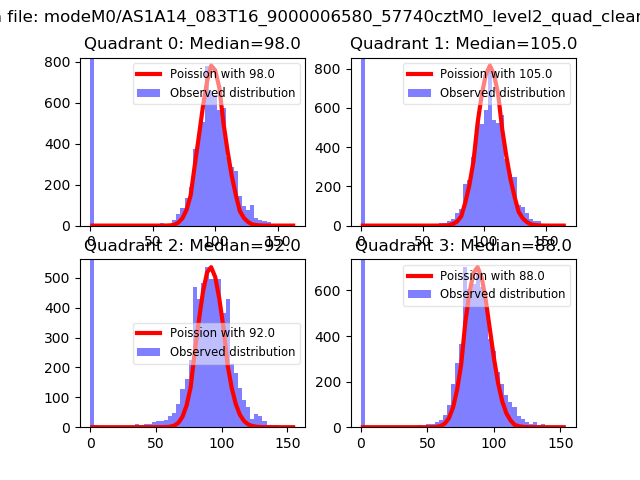 |
 |
| Quadrant-wise count rates Data is divided into 100 sec bins |
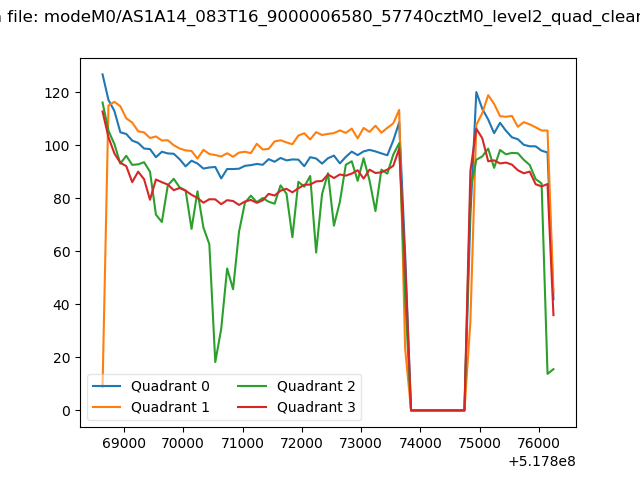 |
|
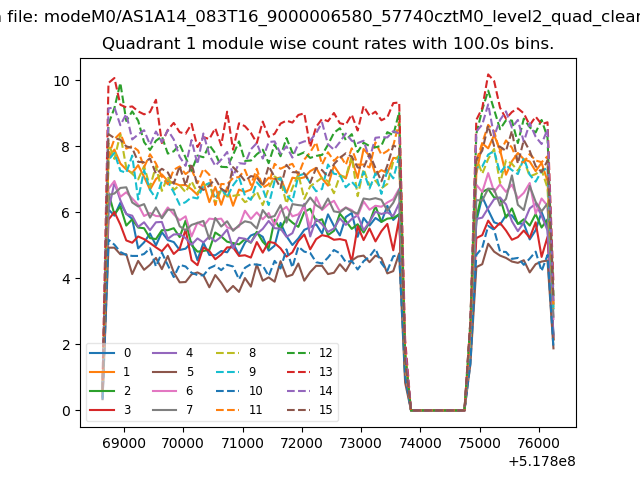
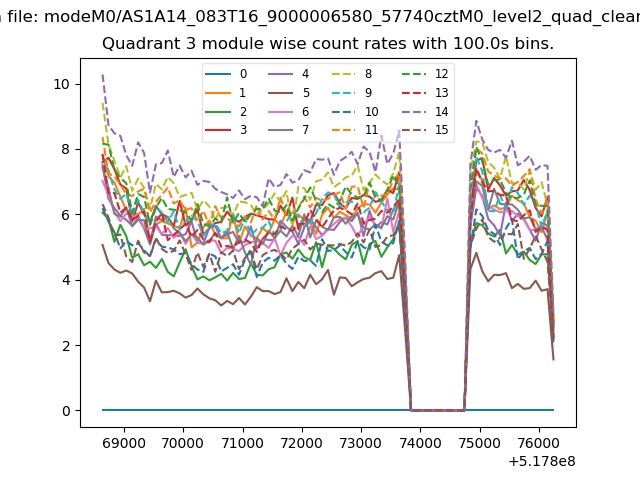
| Module-wise count rates for Quadrant A Data is divided into 100 sec bins |
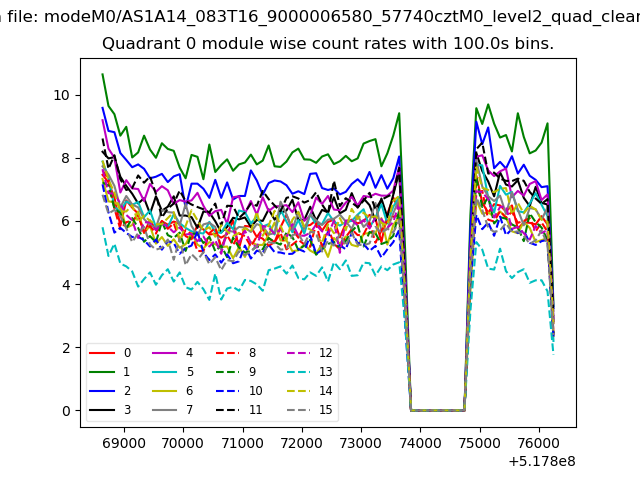 |
 |
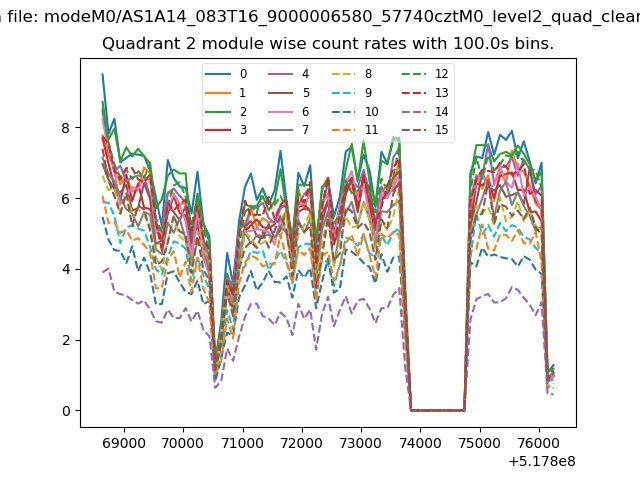
| Module-wise count rates for Quadrant B Data is divided into 100 sec bins |
 |
 |
| Module-wise count rates for Quadrant C Data is divided into 100 sec bins |
 |
 |
| Module-wise count rates for Quadrant D Data is divided into 100 sec bins |
 |
 |
| Parameter | Plot |
|---|---|
| CZT HV Monitor | 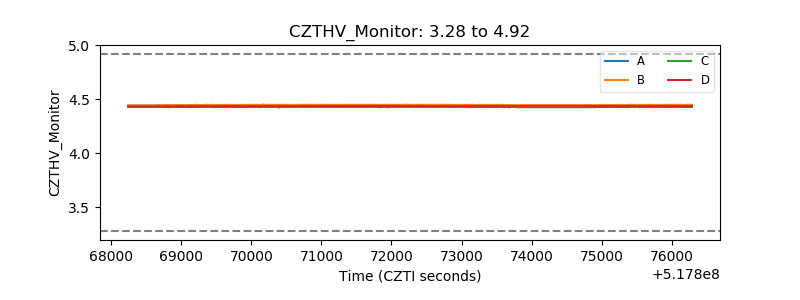 |
| D_VDD | 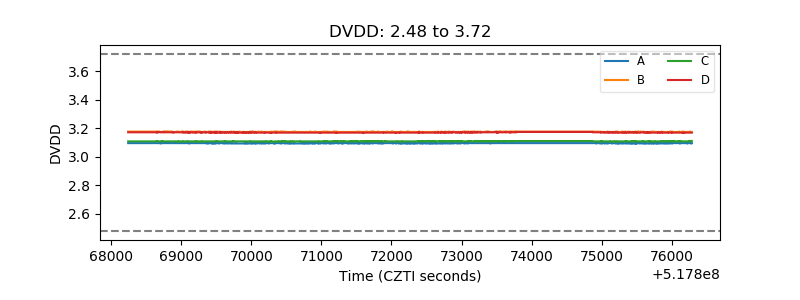 |
| Temperature 1 | 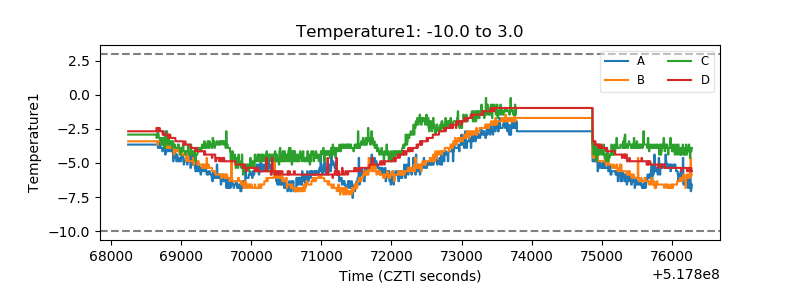 |
| Veto HV Monitor | 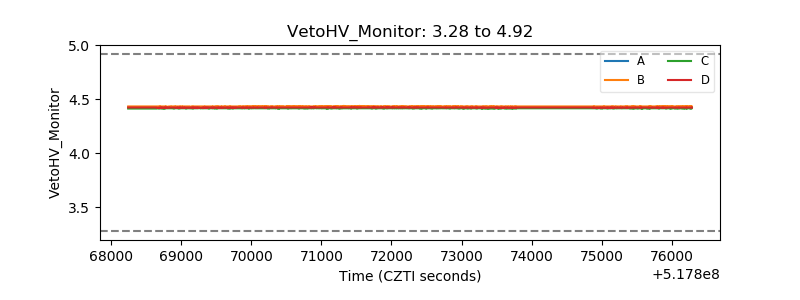 |
| Veto LLD | 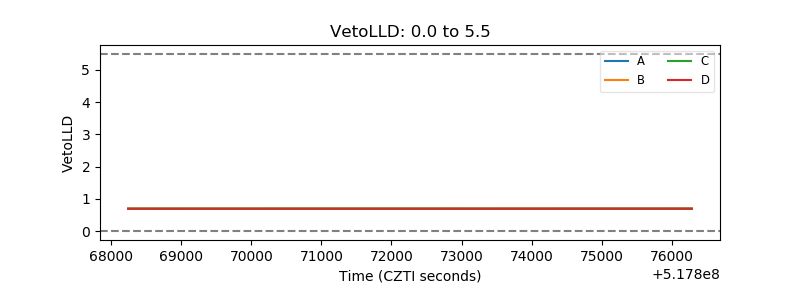 |
| Alpha Counter | 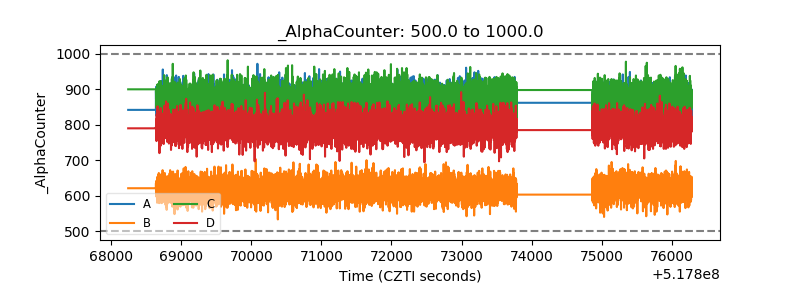 |
| _CPM_Rate | 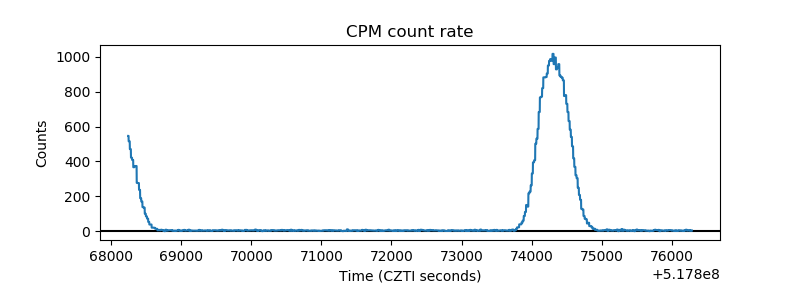 |
| CZT Counter | 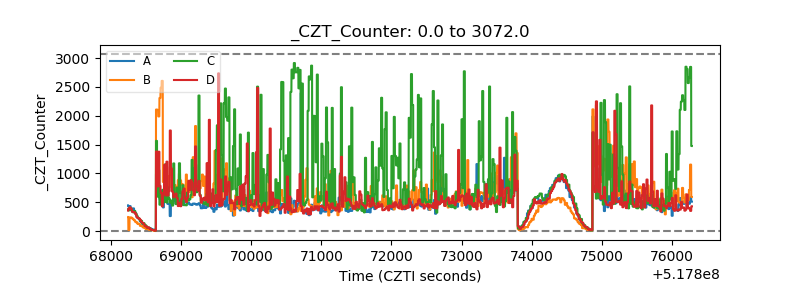 |
| +2.5 Volts monitor | 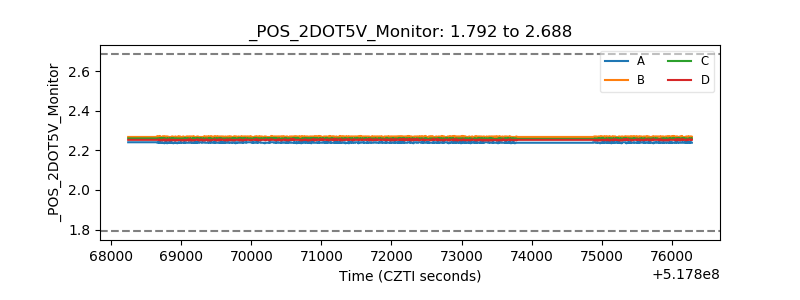 |
| +5 Volts monitor | 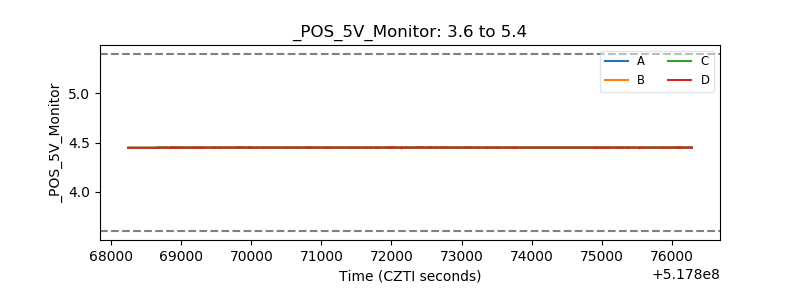 |
| _ROLL_ROT | 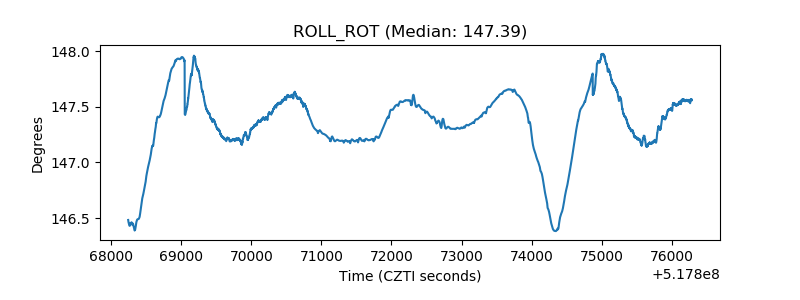 |
| _Roll_DEC | 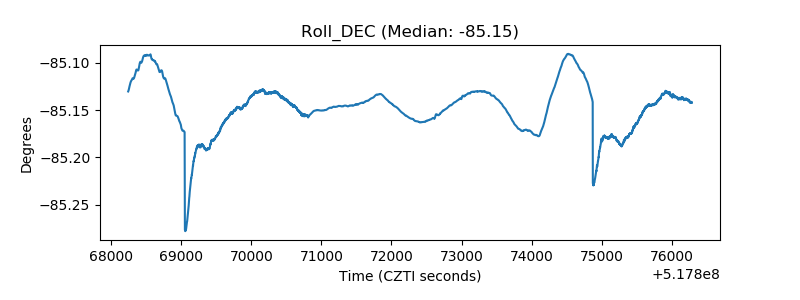 |
| _Roll_RA | 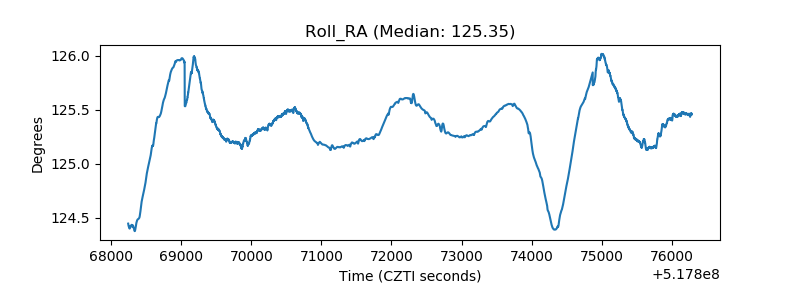 |
| Veto Counter | 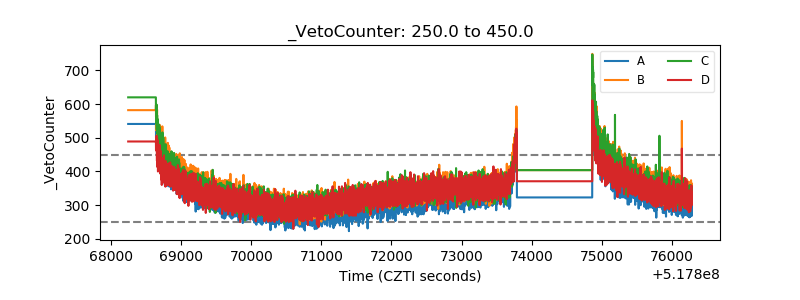 |