| Param | Original file | Final file |
|---|---|---|
| Filename | modeM0/AS1A14_083T16_9000006580_57742cztM0_level2.fits | modeM0/AS1A14_083T16_9000006580_57742cztM0_level2_quad_clean.evt |
| Size (bytes) | 896,935,680 | 176,356,800 |
| Size | 855.4 MB | 168.2 MB |
| Events in quadrant A | 6,251,354 | 1,188,393 |
| Events in quadrant B | 8,688,829 | 1,259,884 |
| Events in quadrant C | 10,679,330 | 1,023,891 |
| Events in quadrant D | 6,663,114 | 1,046,631 |
| Mode SS | |||
|---|---|---|---|
| Quadrant | BADHDUFLAG | Total packets | Discarded packets |
| A | 0 | 240 | 0 |
| B | 0 | 240 | 0 |
| C | 0 | 240 | 0 |
| D | 0 | 240 | 0 |
| Mode M0 | |||
|---|---|---|---|
| Quadrant | BADHDUFLAG | Total packets | Discarded packets |
| A | 0 | 26732 | 3 |
| B | 0 | 34027 | 3 |
| C | 0 | 39989 | 3 |
| D | 0 | 28317 | 3 |
| Mode M9 | |||
|---|---|---|---|
| Quadrant | BADHDUFLAG | Total packets | Discarded packets |
| A | 0 | 25 | 0 |
| B | 0 | 26 | 0 |
| C | 0 | 26 | 0 |
| D | 0 | 26 | 0 |
| Quadrant | Total seconds | Saturated seconds | Saturation percentage |
|---|---|---|---|
| A | 11876 | 105 | 0.884136% |
| B | 11876 | 399 | 3.359717% |
| C | 11876 | 1469 | 12.369485% |
| D | 11876 | 265 | 2.231391% |
Noise dominated data is calculated using 1-second bins in cleaned event files. If a bin has >2000 counts, and if more than 50% of those come from <1% of pixels, then it is considered to be noise-dominated and hence unusable.
| Quadrant | # 1 sec bins | Bins with >0 counts | Bins with >2000 counts | High rate bins dominated by noise | Noise dominated (total time) | Noise dominated (detector-on time) | Marked lightcurve |
|---|---|---|---|---|---|---|---|
| A | 14255 | 11876 | 34 | 34 | 0.24% | 0.29% | 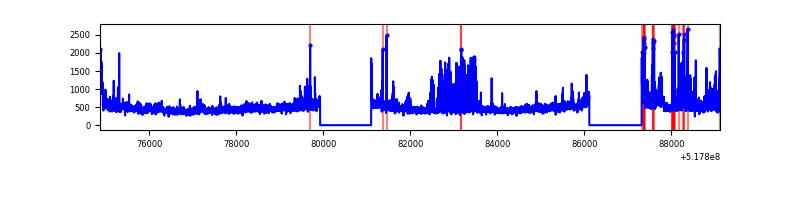 |
| B | 14256 | 11876 | 104 | 104 | 0.73% | 0.88% | 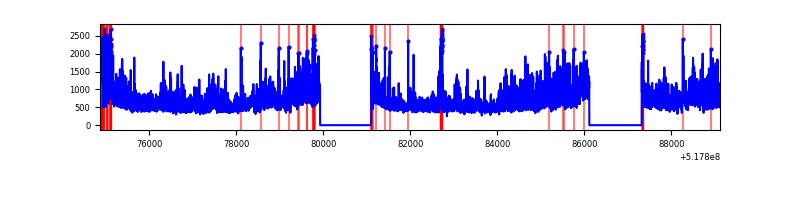 |
| C | 14255 | 11876 | 1458 | 1458 | 10.23% | 12.28% | 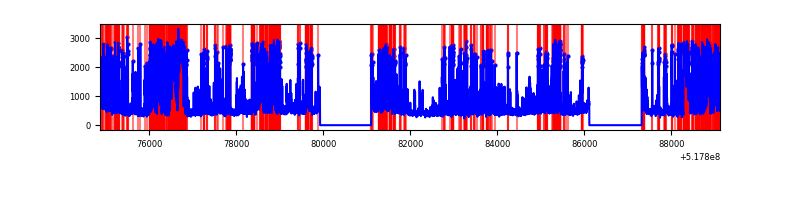 |
| D | 14255 | 11877 | 205 | 205 | 1.44% | 1.73% | 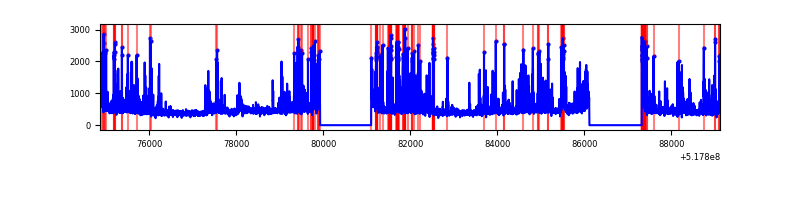 |
Top three noisy pixels from each quadrant. If the there are fewer than three noisy pixels in the level2.evt file, extra rows are filled as -1
| Pixel properties | Quadrant properties | ||||||
|---|---|---|---|---|---|---|---|
| Quadrant | DetID | PixID | Counts | Sigma | Mean | Median | Sigma |
| A | 7 | 160 | 1046434 | 3314.36 | 1279 | 1246 | 315.4 |
| A | 3 | 128 | 119786 | 375.9 | 1279 | 1246 | 315.4 |
| A | 3 | 245 | 46943 | 144.91 | 1279 | 1246 | 315.4 |
| B | 4 | 80 | 2673445 | 10098.36 | 1261 | 1212 | 264.6 |
| B | 10 | 16 | 221812 | 833.65 | 1261 | 1212 | 264.6 |
| B | 4 | 142 | 154383 | 578.83 | 1261 | 1212 | 264.6 |
| C | 15 | 224 | 4878050 | 15086.98 | 1189 | 1176 | 323.3 |
| C | 12 | 2 | 552895 | 1706.78 | 1189 | 1176 | 323.3 |
| C | 12 | 249 | 176724 | 543.07 | 1189 | 1176 | 323.3 |
| D | 3 | 224 | 1003471 | 2882.16 | 1231 | 1175 | 347.8 |
| D | 2 | 249 | 141157 | 402.53 | 1231 | 1175 | 347.8 |
| D | 5 | 32 | 140789 | 401.47 | 1231 | 1175 | 347.8 |
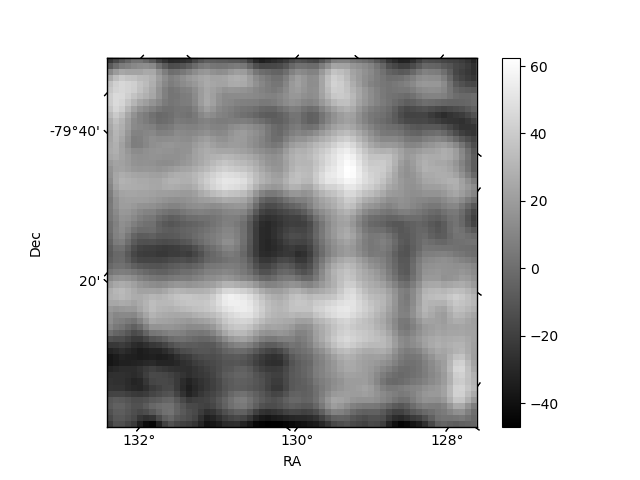
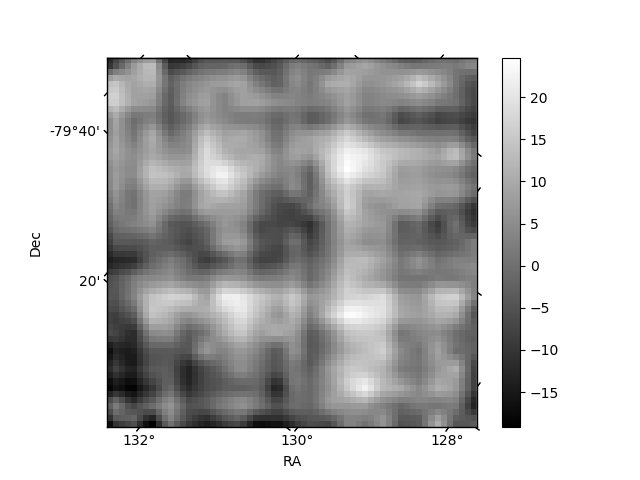
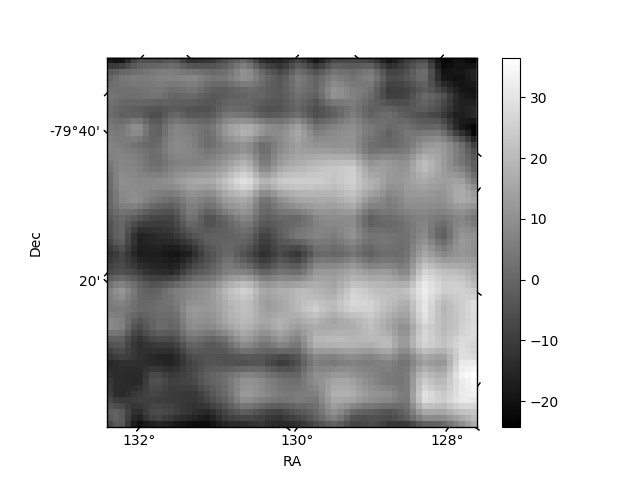
Histogram calculated using DETX and DETY for each event in the final _common_clean file
| Quadrant A | 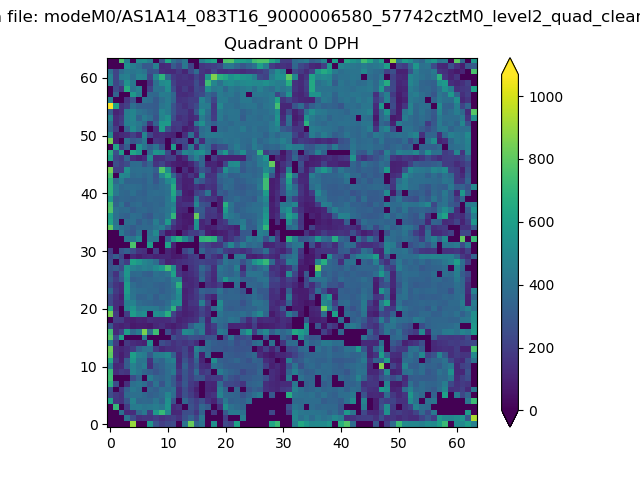 |
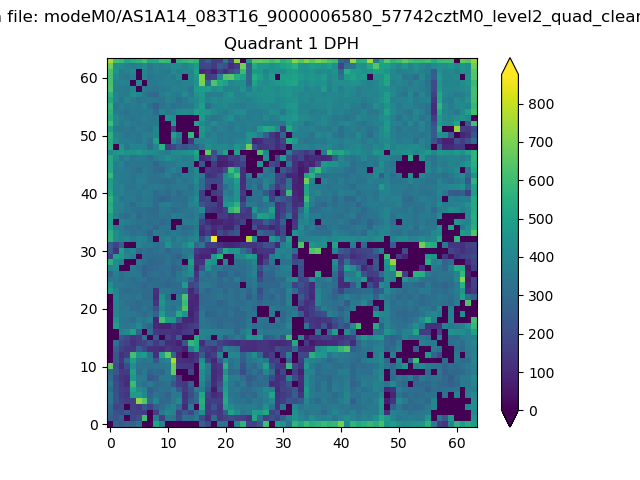 |
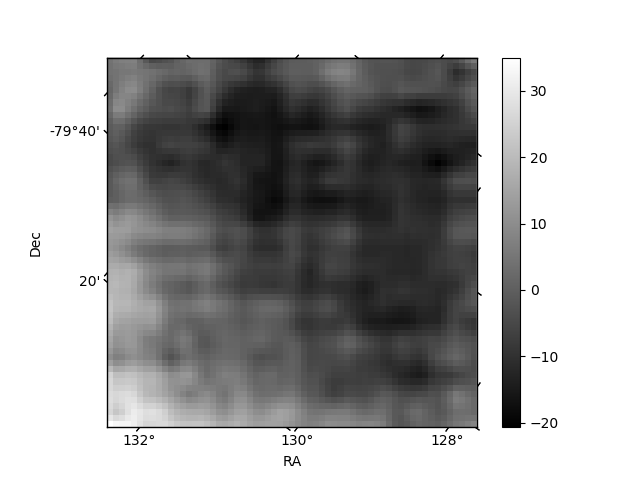
Quadrant B |
|---|---|---|---|
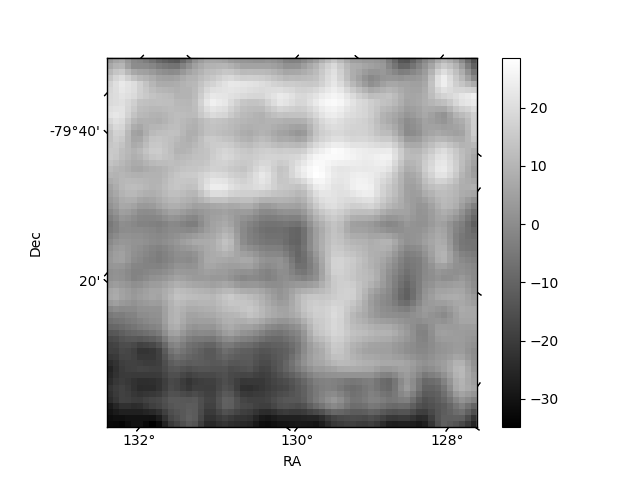
| Quadrant D | 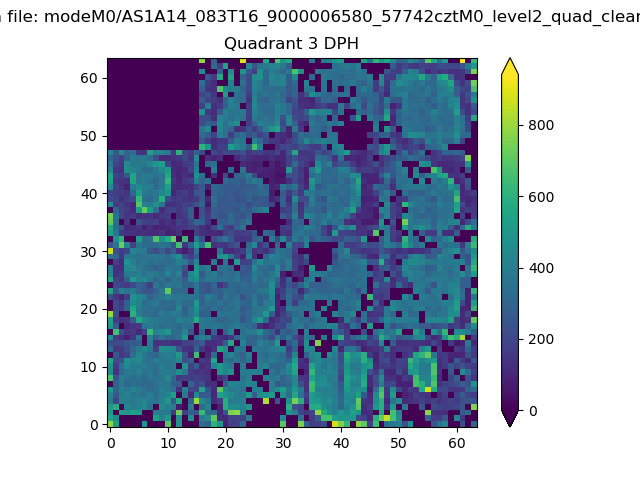 |
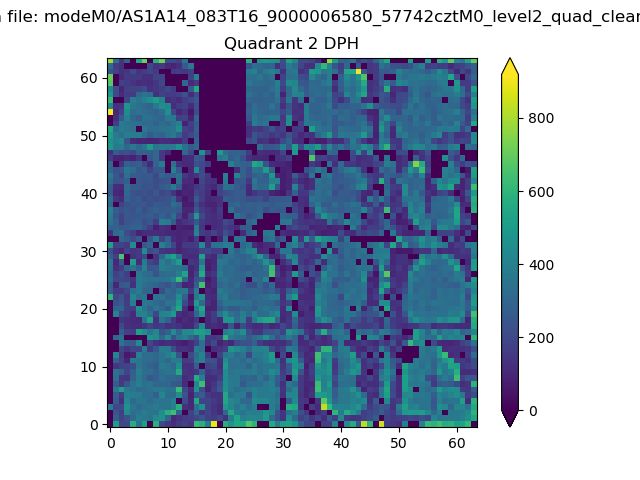 |
Quadrant C |
| Plot type | Count rate plots | Images |
|---|---|---|
| Comparison with Poisson distribution Blue bars denote a histogram of data divided into 1 sec bins. Red curve is a Poisson curve with rate = median count rate of data. |
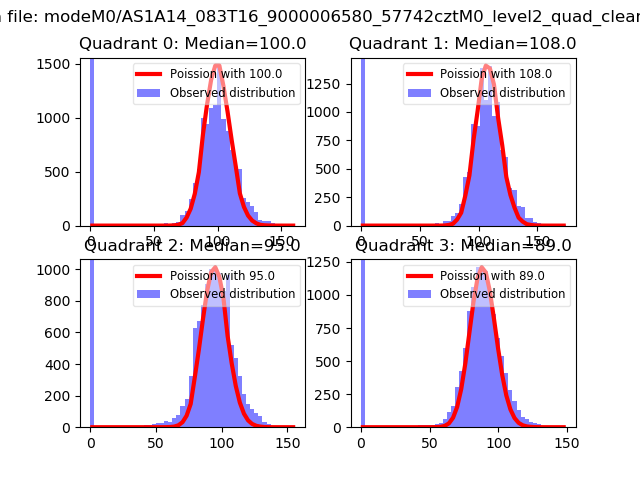 |
 |
| Quadrant-wise count rates Data is divided into 100 sec bins |
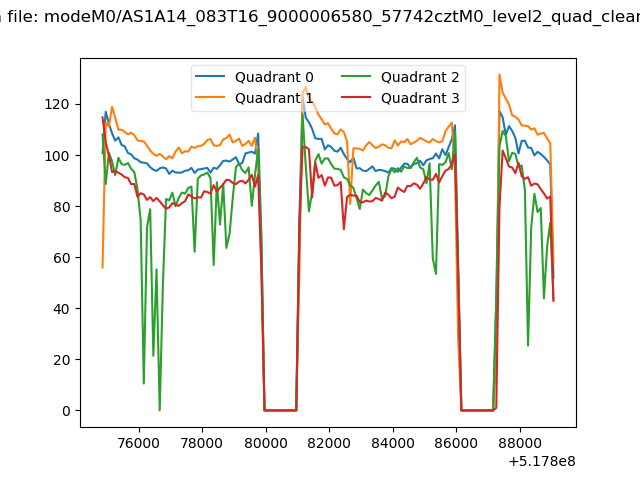 |
|
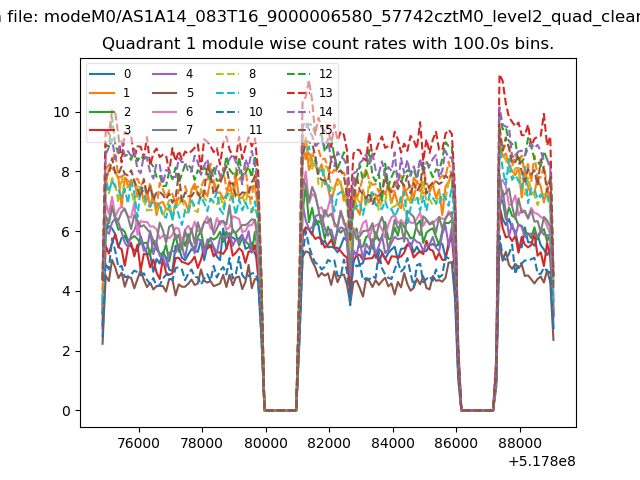
| Module-wise count rates for Quadrant A Data is divided into 100 sec bins |
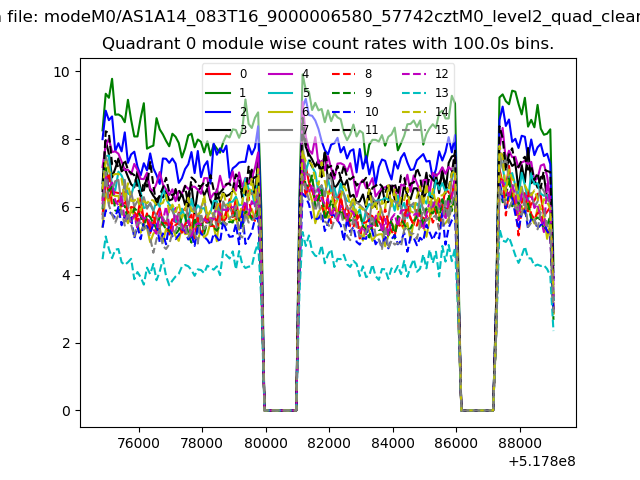 |
 |
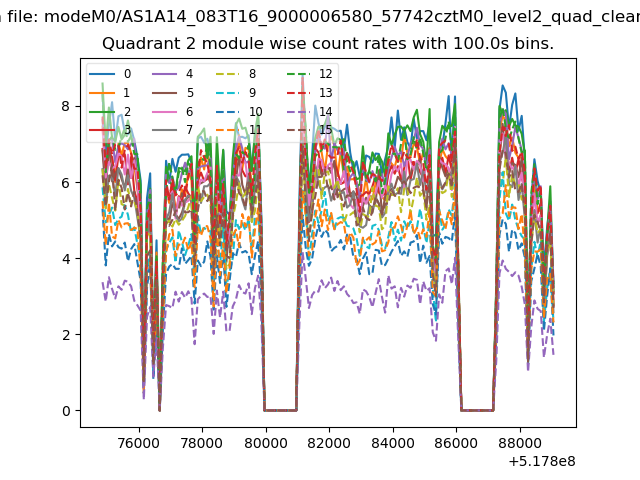
| Module-wise count rates for Quadrant B Data is divided into 100 sec bins |
 |
 |
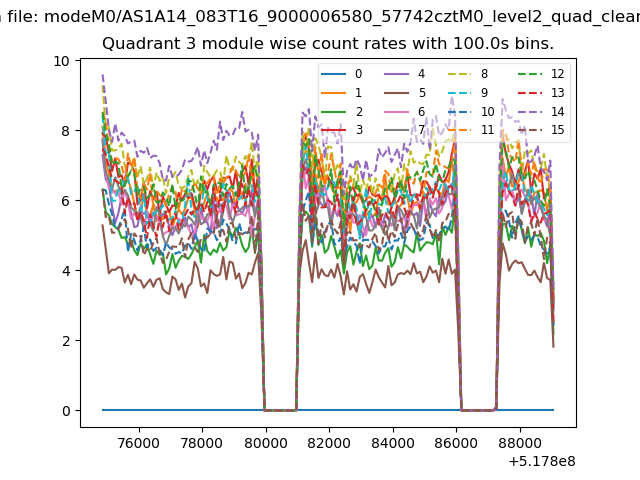
| Module-wise count rates for Quadrant C Data is divided into 100 sec bins |
 |
 |
| Module-wise count rates for Quadrant D Data is divided into 100 sec bins |
 |
 |
| Parameter | Plot |
|---|---|
| CZT HV Monitor | 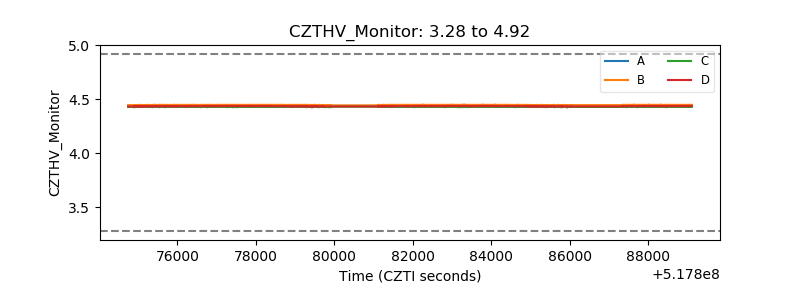 |
| D_VDD | 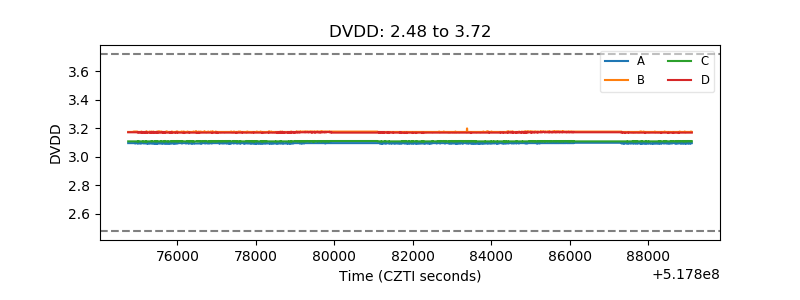 |
| Temperature 1 | 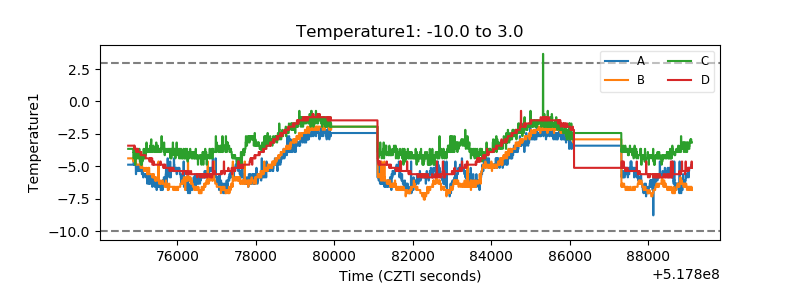 |
| Veto HV Monitor | 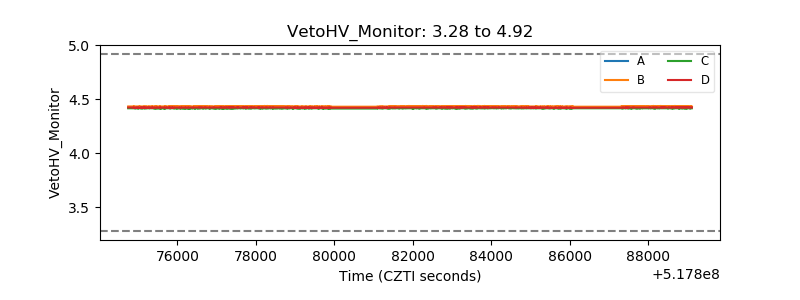 |
| Veto LLD | 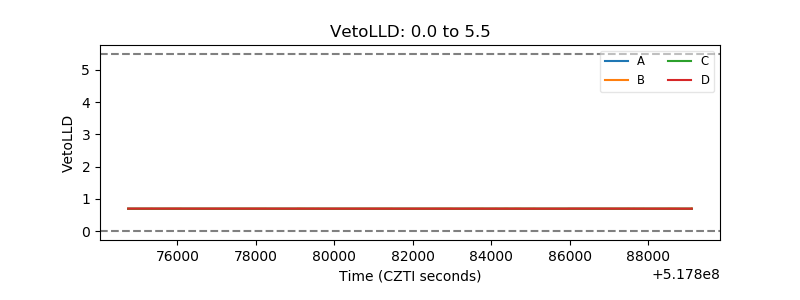 |
| Alpha Counter | 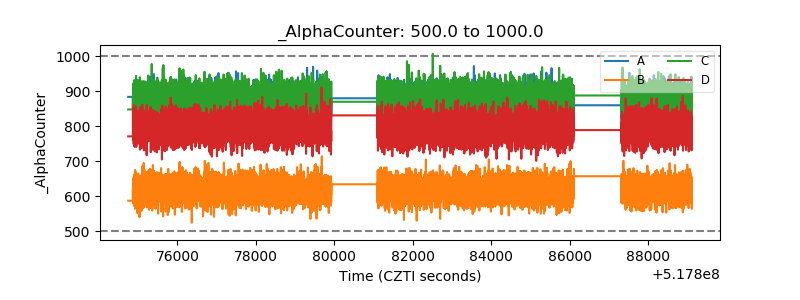 |
| _CPM_Rate | 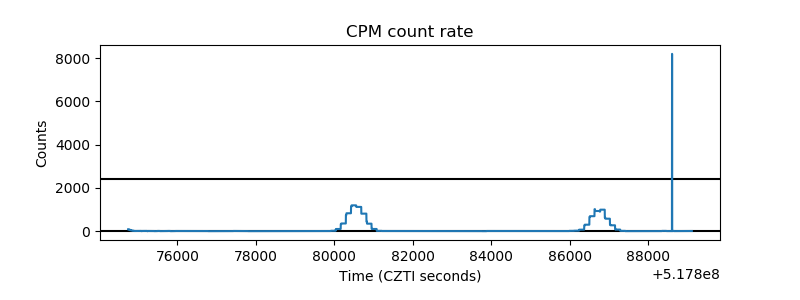 |
| CZT Counter | 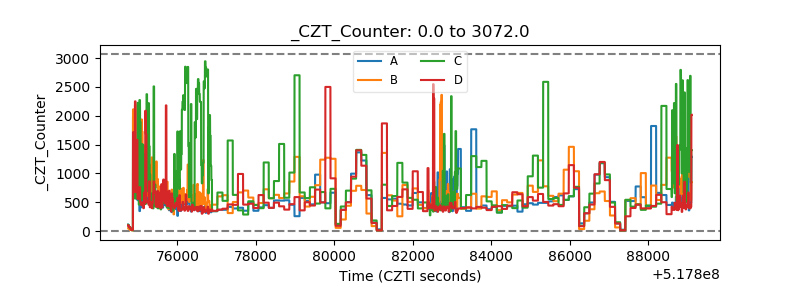 |
| +2.5 Volts monitor | 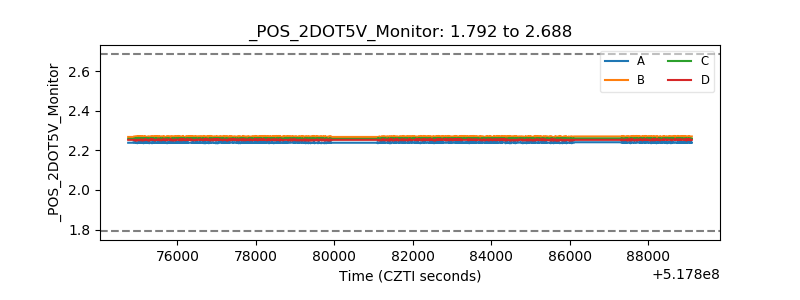 |
| +5 Volts monitor | 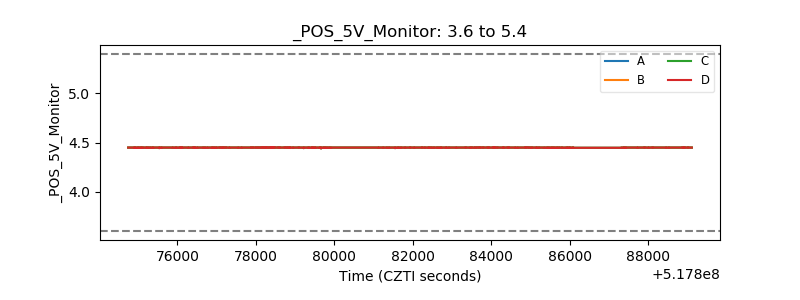 |
| _ROLL_ROT | 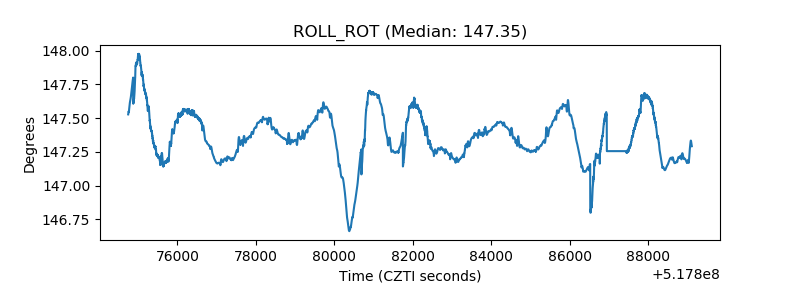 |
| _Roll_DEC | 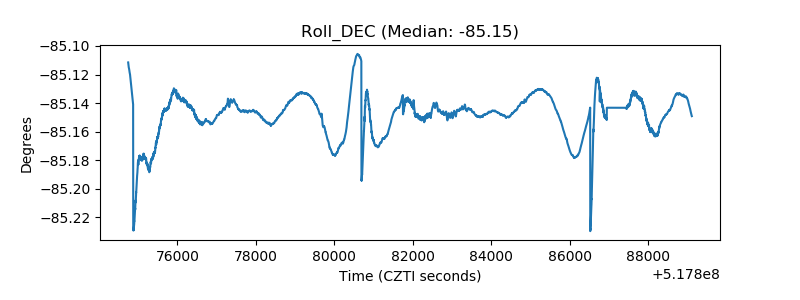 |
| _Roll_RA | 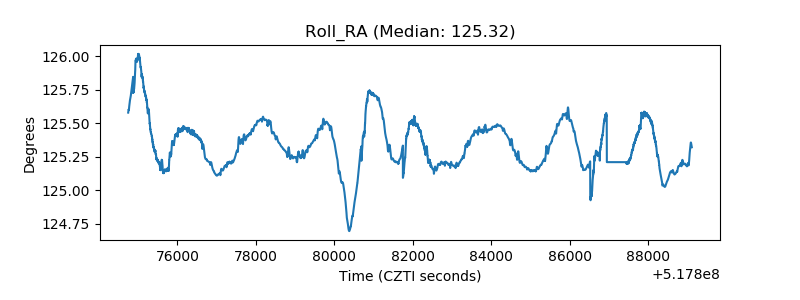 |
| Veto Counter | 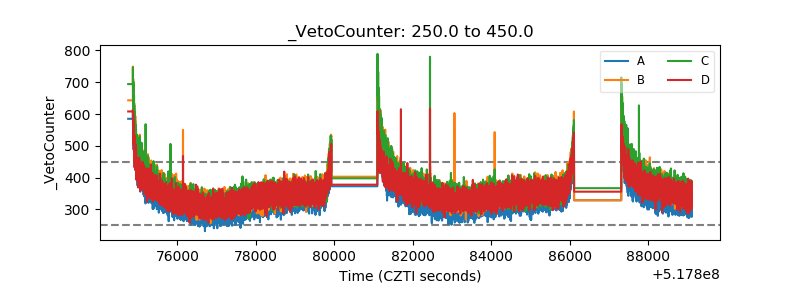 |