| Param | Original file | Final file |
|---|---|---|
| Filename | modeM0/AS1A14_083T16_9000006580_57743cztM0_level2.fits | modeM0/AS1A14_083T16_9000006580_57743cztM0_level2_quad_clean.evt |
| Size (bytes) | 465,805,440 | 93,006,720 |
| Size | 444.2 MB | 88.7 MB |
| Events in quadrant A | 3,843,601 | 623,560 |
| Events in quadrant B | 3,680,109 | 669,865 |
| Events in quadrant C | 5,940,588 | 537,469 |
| Events in quadrant D | 3,294,173 | 550,545 |
| Mode SS | |||
|---|---|---|---|
| Quadrant | BADHDUFLAG | Total packets | Discarded packets |
| A | 0 | 126 | 0 |
| B | 0 | 126 | 0 |
| C | 0 | 126 | 0 |
| D | 0 | 126 | 0 |
| Mode M0 | |||
|---|---|---|---|
| Quadrant | BADHDUFLAG | Total packets | Discarded packets |
| A | 0 | 15607 | 1 |
| B | 0 | 15187 | 2 |
| C | 0 | 21964 | 1 |
| D | 0 | 14273 | 1 |
| Mode M9 | |||
|---|---|---|---|
| Quadrant | BADHDUFLAG | Total packets | Discarded packets |
| A | 0 | 12 | 0 |
| B | 0 | 12 | 0 |
| C | 0 | 12 | 0 |
| D | 0 | 12 | 0 |
| Quadrant | Total seconds | Saturated seconds | Saturation percentage |
|---|---|---|---|
| A | 6233 | 80 | 1.283491% |
| B | 6233 | 69 | 1.107011% |
| C | 6233 | 784 | 12.578213% |
| D | 6233 | 121 | 1.941280% |
Noise dominated data is calculated using 1-second bins in cleaned event files. If a bin has >2000 counts, and if more than 50% of those come from <1% of pixels, then it is considered to be noise-dominated and hence unusable.
| Quadrant | # 1 sec bins | Bins with >0 counts | Bins with >2000 counts | High rate bins dominated by noise | Noise dominated (total time) | Noise dominated (detector-on time) | Marked lightcurve |
|---|---|---|---|---|---|---|---|
| A | 7437 | 6232 | 56 | 56 | 0.75% | 0.90% | 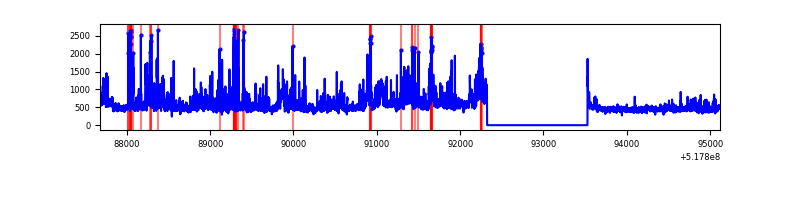 |
| B | 7437 | 6232 | 20 | 20 | 0.27% | 0.32% | 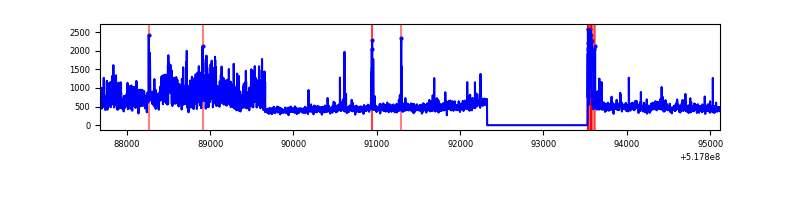 |
| C | 7437 | 6232 | 739 | 739 | 9.94% | 11.86% | 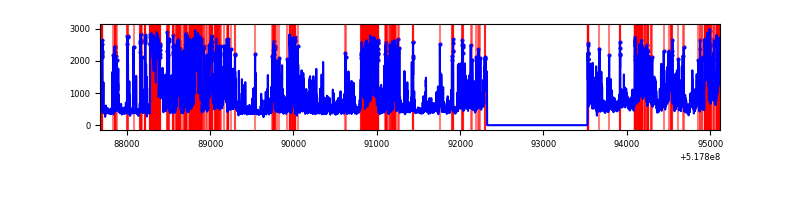 |
| D | 7437 | 6232 | 86 | 86 | 1.16% | 1.38% | 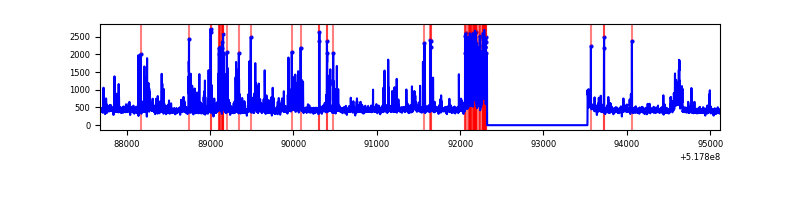 |
Top three noisy pixels from each quadrant. If the there are fewer than three noisy pixels in the level2.evt file, extra rows are filled as -1
| Pixel properties | Quadrant properties | ||||||
|---|---|---|---|---|---|---|---|
| Quadrant | DetID | PixID | Counts | Sigma | Mean | Median | Sigma |
| A | 7 | 160 | 1034556 | 6265.98 | 666 | 649 | 165.0 |
| A | 3 | 128 | 188068 | 1135.85 | 666 | 649 | 165.0 |
| A | 3 | 61 | 30041 | 178.13 | 666 | 649 | 165.0 |
| B | 4 | 80 | 724995 | 5159.52 | 661 | 637 | 140.4 |
| B | 0 | 63 | 122820 | 870.3 | 661 | 637 | 140.4 |
| B | 10 | 16 | 76345 | 539.26 | 661 | 637 | 140.4 |
| C | 15 | 224 | 2659328 | 15712.56 | 624 | 618 | 169.2 |
| C | 9 | 38 | 406290 | 2397.46 | 624 | 618 | 169.2 |
| C | 12 | 249 | 196979 | 1160.46 | 624 | 618 | 169.2 |
| D | 3 | 224 | 246831 | 1366.85 | 644 | 616 | 180.1 |
| D | 13 | 138 | 210606 | 1165.75 | 644 | 616 | 180.1 |
| D | 2 | 249 | 82968 | 457.17 | 644 | 616 | 180.1 |
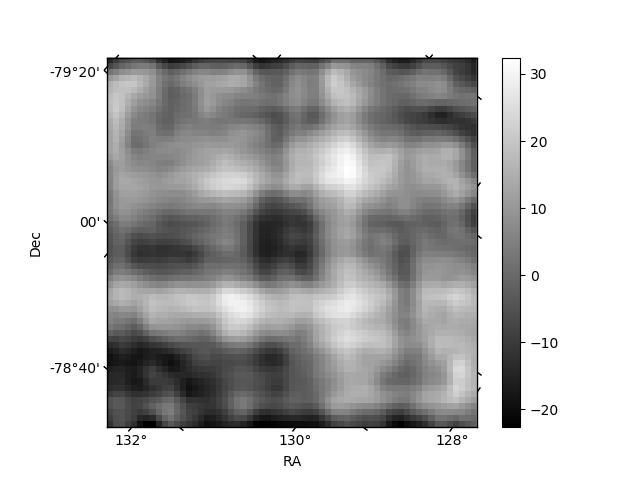
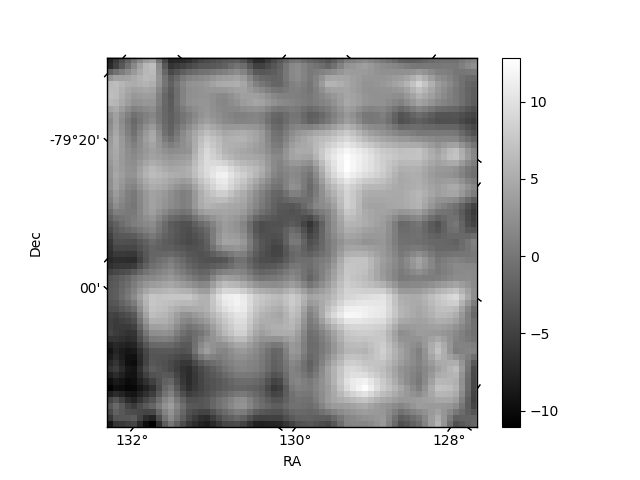
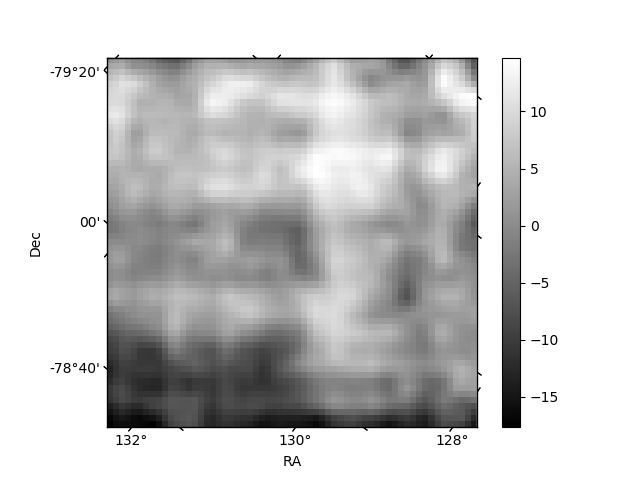
Histogram calculated using DETX and DETY for each event in the final _common_clean file
| Quadrant A | 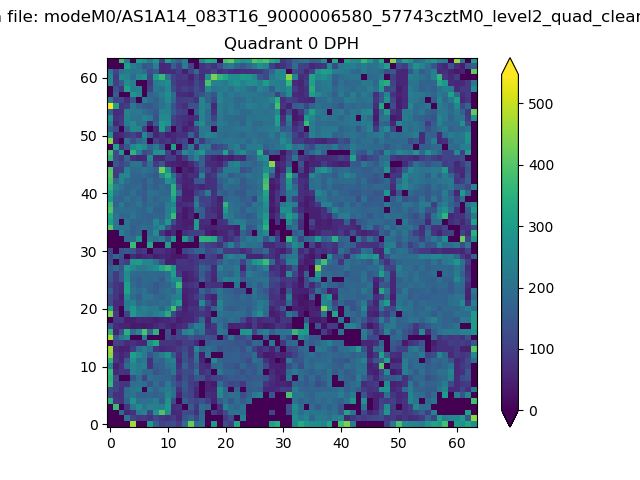 |
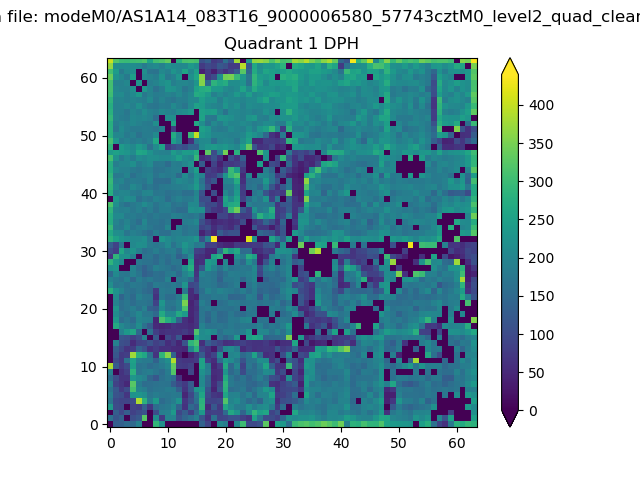 |
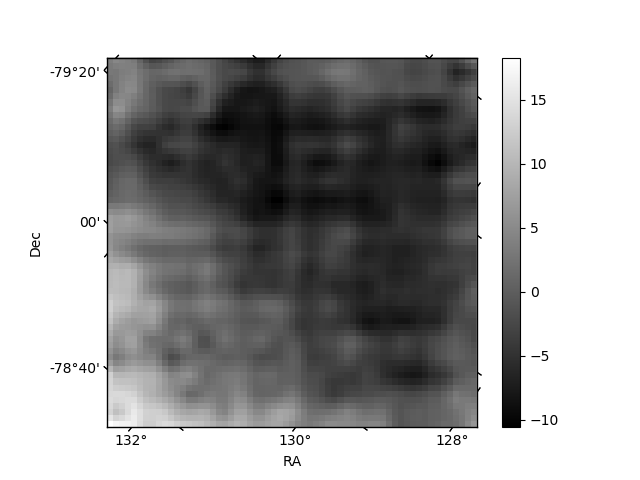
Quadrant B |
|---|---|---|---|
| Quadrant D | 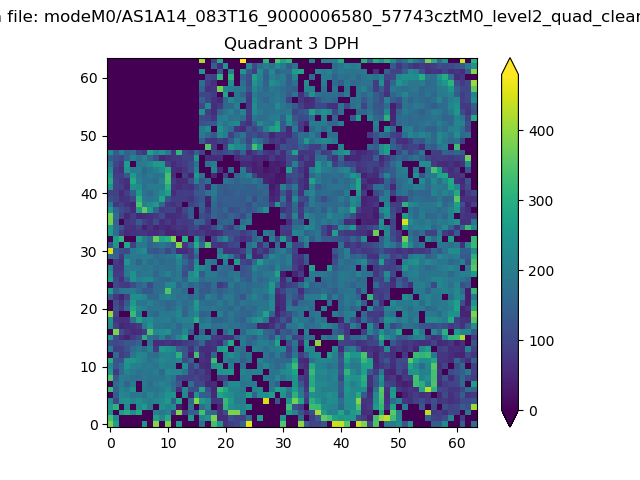 |
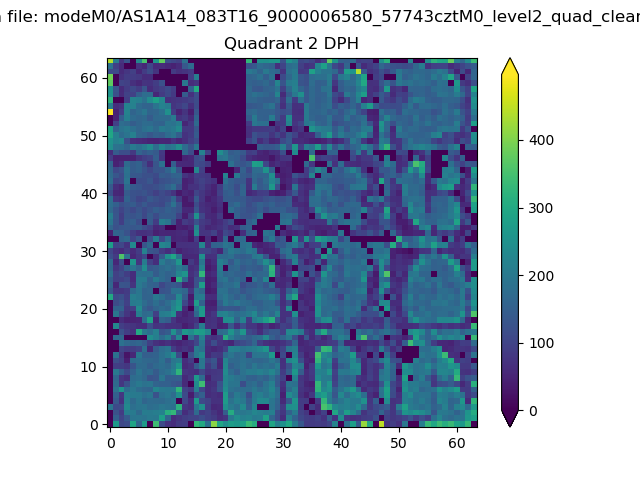 |
Quadrant C |
| Plot type | Count rate plots | Images |
|---|---|---|
| Comparison with Poisson distribution Blue bars denote a histogram of data divided into 1 sec bins. Red curve is a Poisson curve with rate = median count rate of data. |
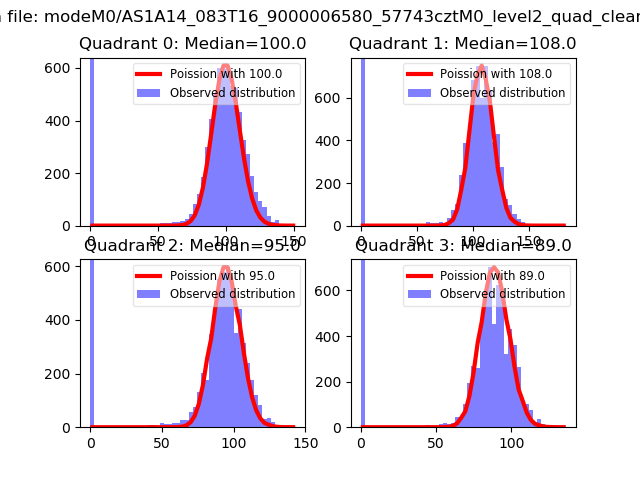 |
 |
| Quadrant-wise count rates Data is divided into 100 sec bins |
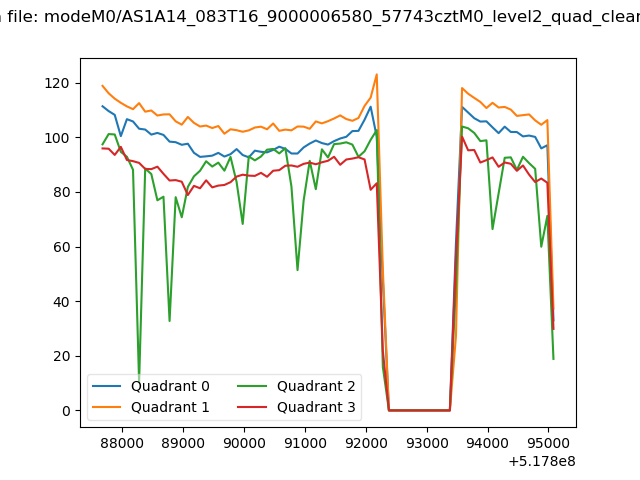 |
|
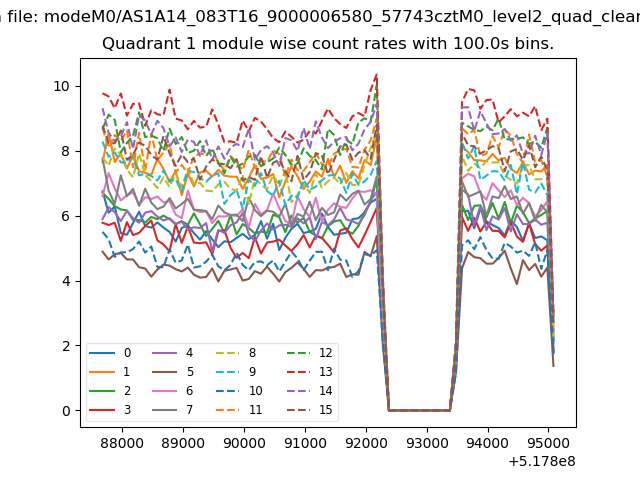
| Module-wise count rates for Quadrant A Data is divided into 100 sec bins |
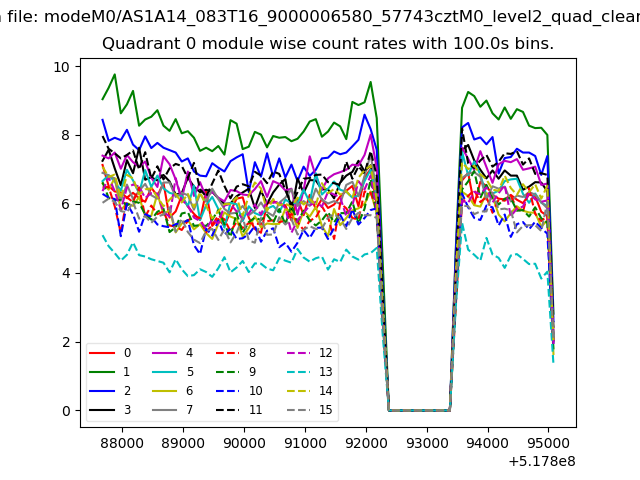 |
 |
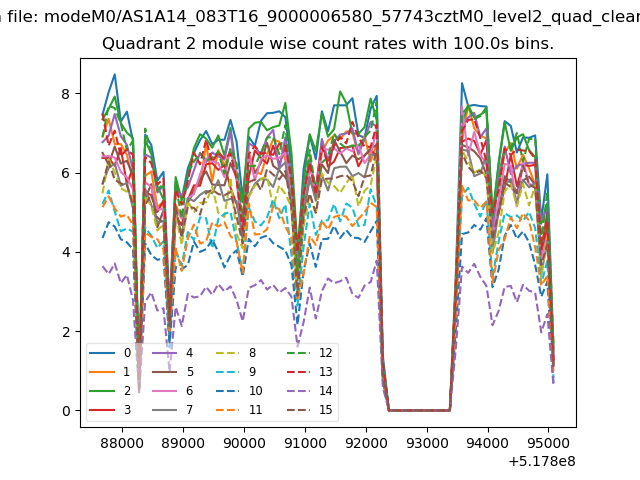
| Module-wise count rates for Quadrant B Data is divided into 100 sec bins |
 |
 |
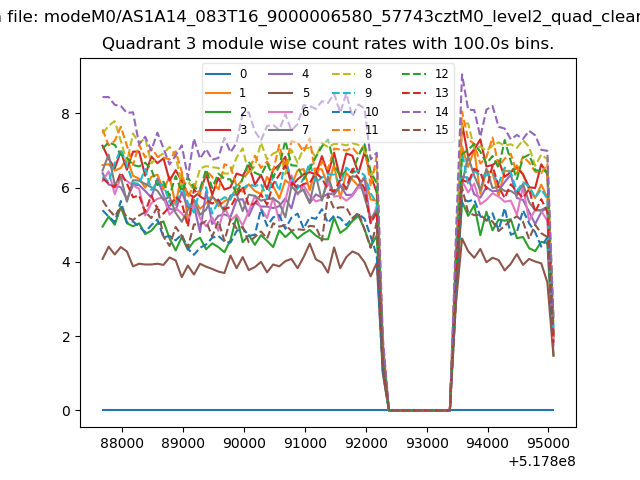
| Module-wise count rates for Quadrant C Data is divided into 100 sec bins |
 |
 |
| Module-wise count rates for Quadrant D Data is divided into 100 sec bins |
 |
 |
| Parameter | Plot |
|---|---|
| CZT HV Monitor |  |
| D_VDD | 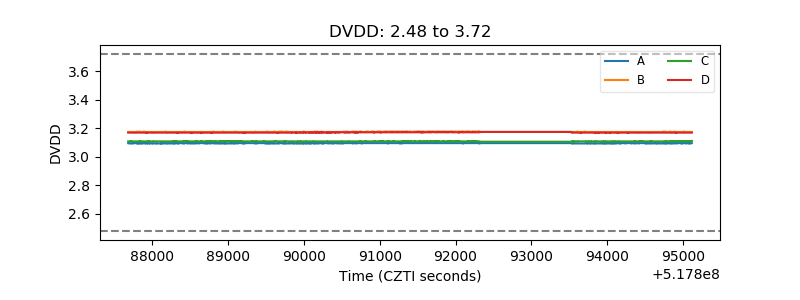 |
| Temperature 1 | 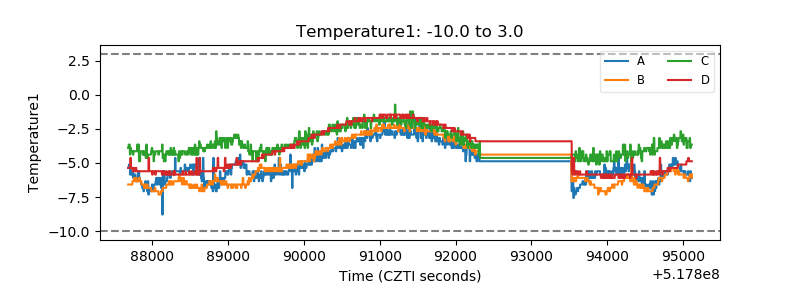 |
| Veto HV Monitor | 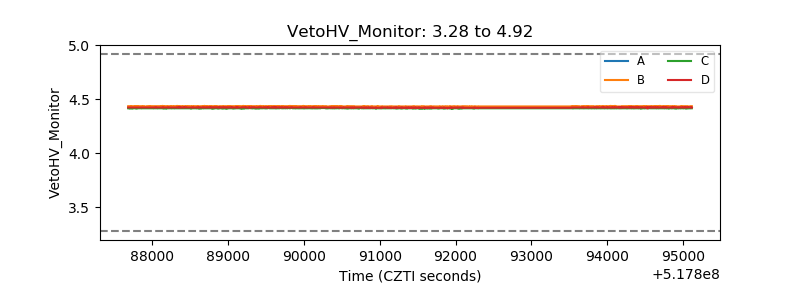 |
| Veto LLD | 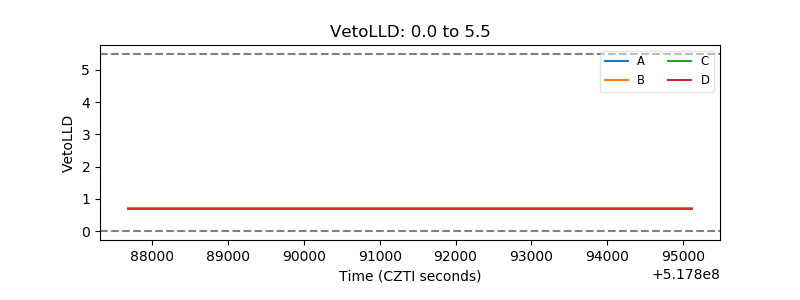 |
| Alpha Counter | 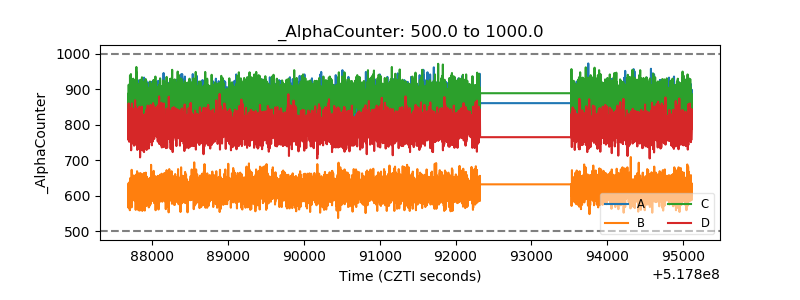 |
| _CPM_Rate | 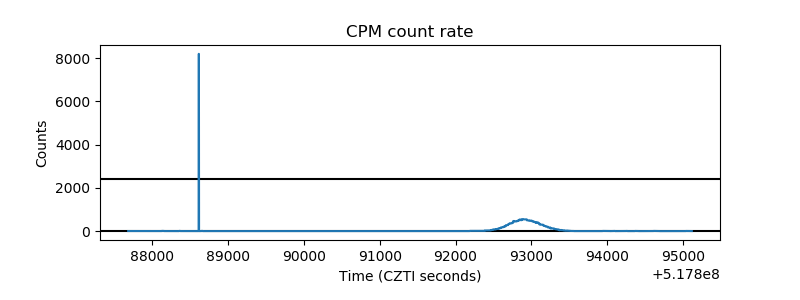 |
| CZT Counter | 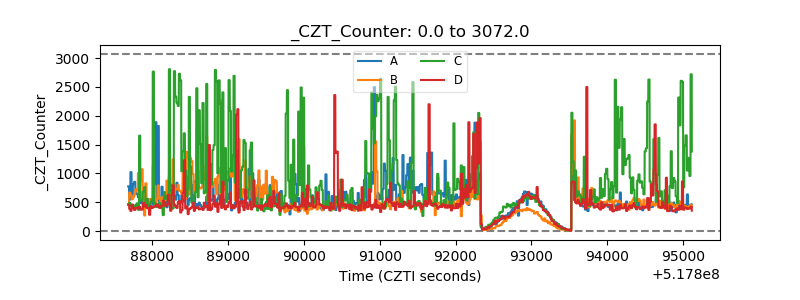 |
| +2.5 Volts monitor | 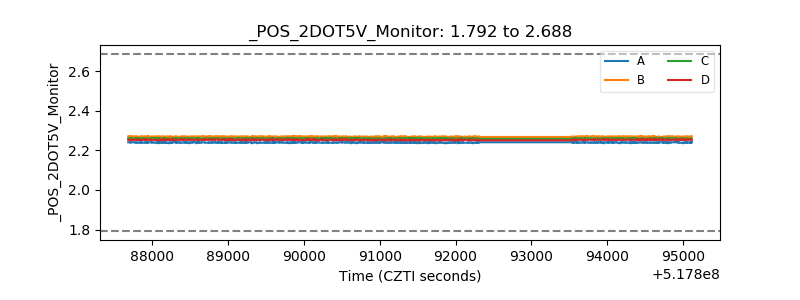 |
| +5 Volts monitor | 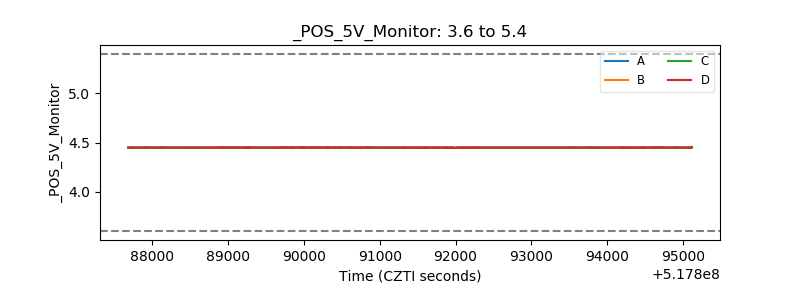 |
| _ROLL_ROT | 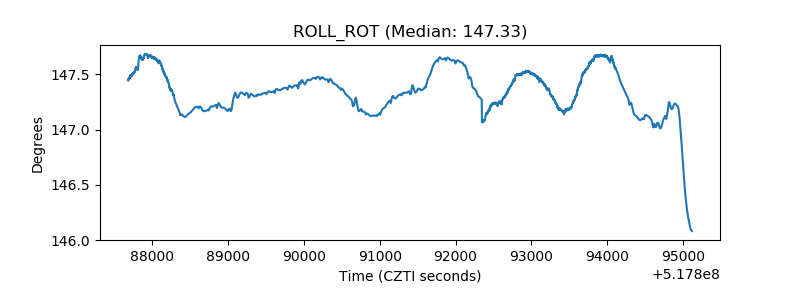 |
| _Roll_DEC | 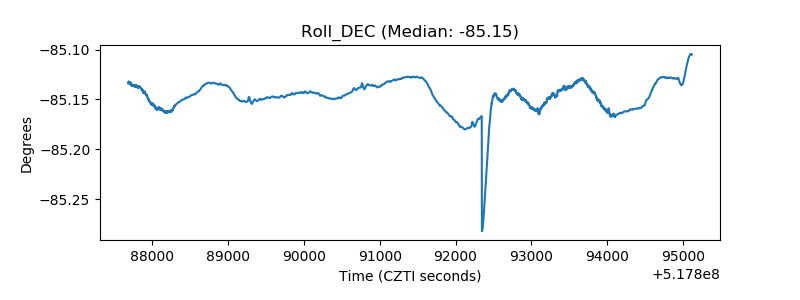 |
| _Roll_RA |  |
| Veto Counter | 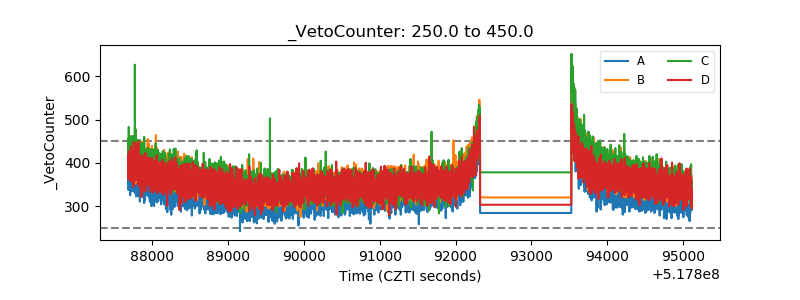 |