| Param | Original file | Final file |
|---|---|---|
| Filename | modeM0/AS1A14_083T16_9000006580_57745cztM0_level2.fits | modeM0/AS1A14_083T16_9000006580_57745cztM0_level2_quad_clean.evt |
| Size (bytes) | 536,368,320 | 102,182,400 |
| Size | 511.5 MB | 97.4 MB |
| Events in quadrant A | 4,140,146 | 681,112 |
| Events in quadrant B | 3,477,355 | 718,699 |
| Events in quadrant C | 7,884,892 | 593,997 |
| Events in quadrant D | 3,799,401 | 604,336 |
| Mode SS | |||
|---|---|---|---|
| Quadrant | BADHDUFLAG | Total packets | Discarded packets |
| A | 0 | 144 | 0 |
| B | 0 | 144 | 0 |
| C | 0 | 144 | 0 |
| D | 0 | 144 | 0 |
| Mode M0 | |||
|---|---|---|---|
| Quadrant | BADHDUFLAG | Total packets | Discarded packets |
| A | 0 | 17146 | 2 |
| B | 0 | 15319 | 2 |
| C | 0 | 28350 | 2 |
| D | 0 | 16447 | 2 |
| Mode M9 | |||
|---|---|---|---|
| Quadrant | BADHDUFLAG | Total packets | Discarded packets |
| A | 0 | 12 | 0 |
| B | 0 | 13 | 0 |
| C | 0 | 13 | 0 |
| D | 0 | 13 | 0 |
| Quadrant | Total seconds | Saturated seconds | Saturation percentage |
|---|---|---|---|
| A | 7120 | 188 | 2.640449% |
| B | 7120 | 261 | 3.665730% |
| C | 7120 | 1052 | 14.775281% |
| D | 7120 | 261 | 3.665730% |
Noise dominated data is calculated using 1-second bins in cleaned event files. If a bin has >2000 counts, and if more than 50% of those come from <1% of pixels, then it is considered to be noise-dominated and hence unusable.
| Quadrant | # 1 sec bins | Bins with >0 counts | Bins with >2000 counts | High rate bins dominated by noise | Noise dominated (total time) | Noise dominated (detector-on time) | Marked lightcurve |
|---|---|---|---|---|---|---|---|
| A | 7705 | 7121 | 17 | 17 | 0.22% | 0.24% | 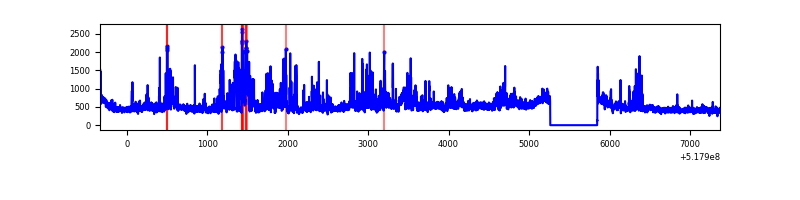 |
| B | 7705 | 7121 | 13 | 13 | 0.17% | 0.18% | 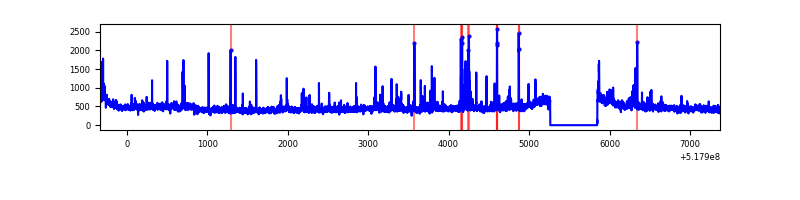 |
| C | 7705 | 7121 | 856 | 856 | 11.11% | 12.02% | 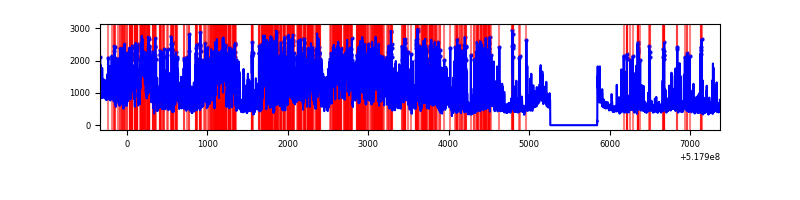 |
| D | 7705 | 7121 | 101 | 101 | 1.31% | 1.42% | 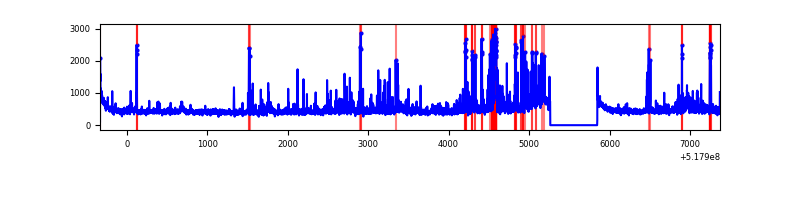 |
Top three noisy pixels from each quadrant. If the there are fewer than three noisy pixels in the level2.evt file, extra rows are filled as -1
| Pixel properties | Quadrant properties | ||||||
|---|---|---|---|---|---|---|---|
| Quadrant | DetID | PixID | Counts | Sigma | Mean | Median | Sigma |
| A | 7 | 160 | 961242 | 5110.42 | 768 | 746 | 187.9 |
| A | 3 | 61 | 78822 | 415.41 | 768 | 746 | 187.9 |
| A | 3 | 128 | 70099 | 369.0 | 768 | 746 | 187.9 |
| B | 0 | 63 | 168016 | 1040.52 | 760 | 730 | 160.8 |
| B | 10 | 247 | 83622 | 515.59 | 760 | 730 | 160.8 |
| B | 9 | 251 | 52186 | 320.06 | 760 | 730 | 160.8 |
| C | 9 | 38 | 2949623 | 15096.79 | 726 | 718 | 195.3 |
| C | 15 | 224 | 1779935 | 9108.62 | 726 | 718 | 195.3 |
| C | 14 | 254 | 75612 | 383.42 | 726 | 718 | 195.3 |
| D | 3 | 12 | 276639 | 1311.86 | 747 | 713 | 210.3 |
| D | 8 | 240 | 218537 | 1035.62 | 747 | 713 | 210.3 |
| D | 2 | 249 | 159845 | 756.57 | 747 | 713 | 210.3 |
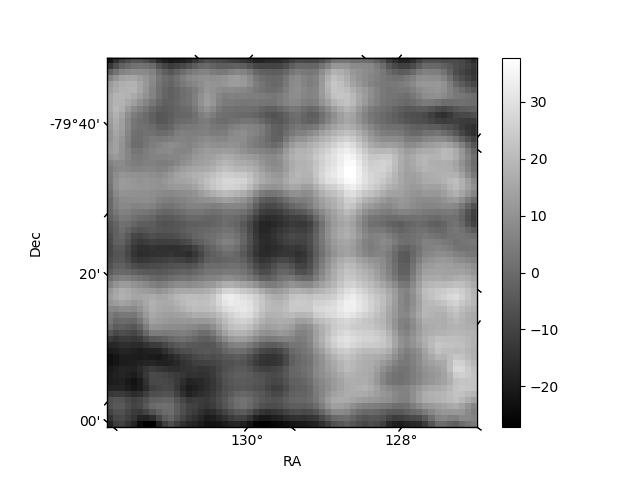
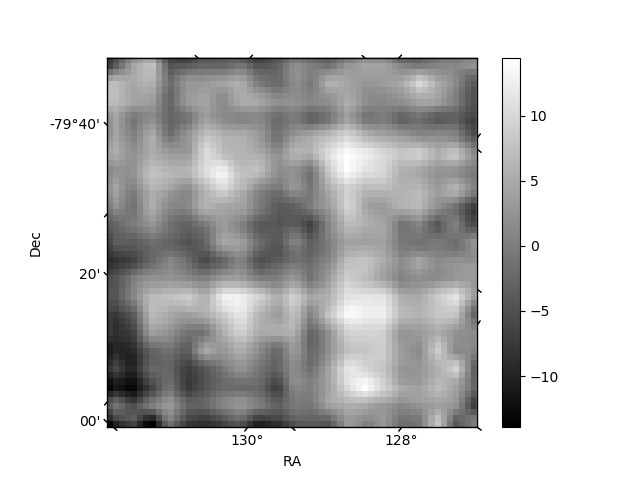
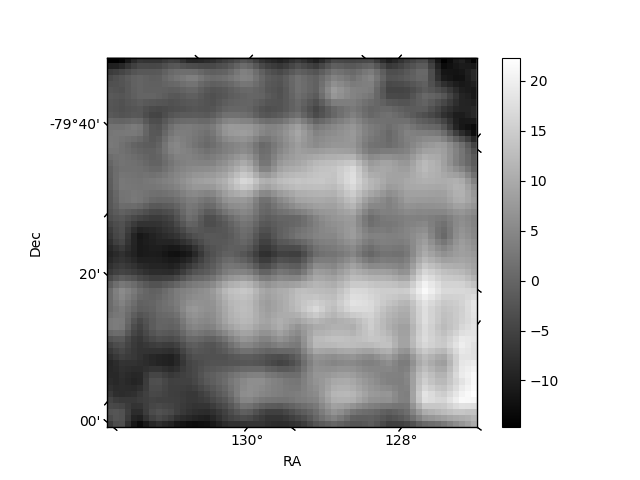
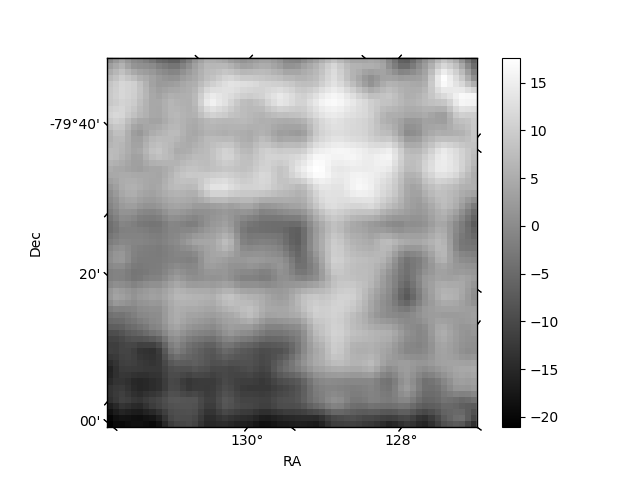
Histogram calculated using DETX and DETY for each event in the final _common_clean file
| Quadrant A | 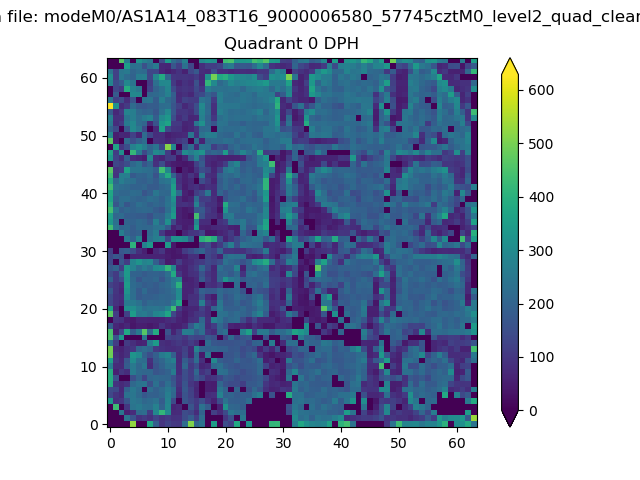 |
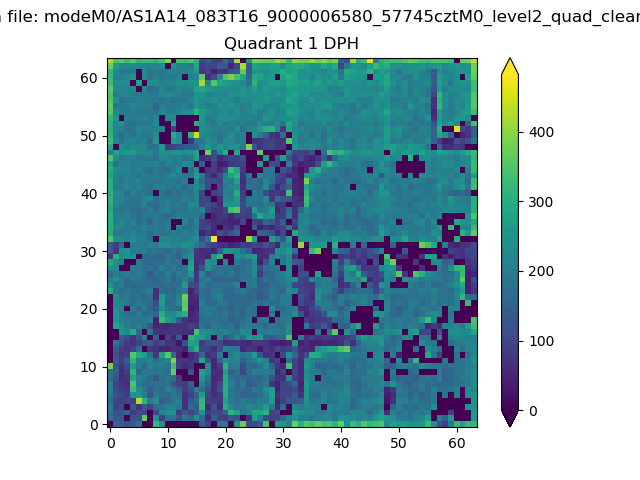 |
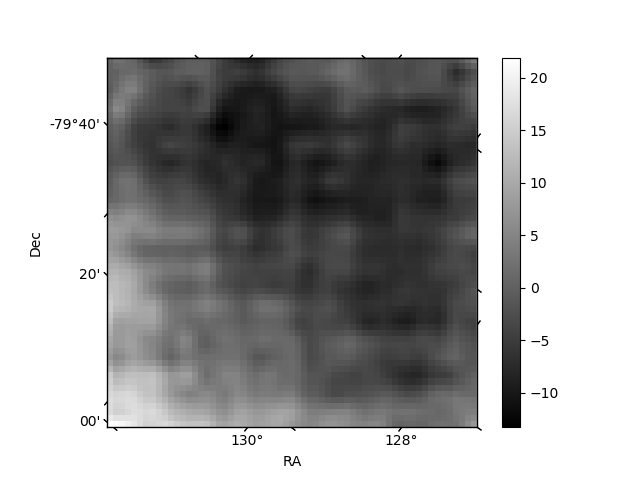
Quadrant B |
|---|---|---|---|
| Quadrant D | 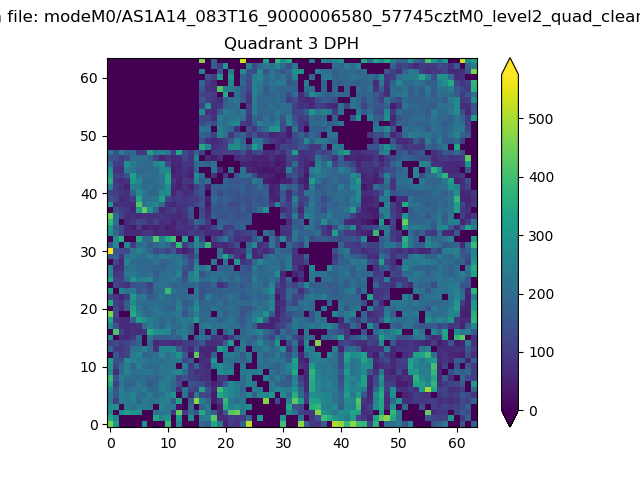 |
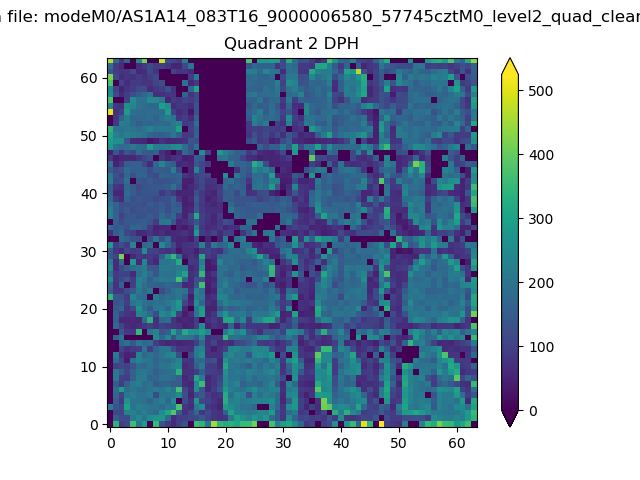 |
Quadrant C |
| Plot type | Count rate plots | Images |
|---|---|---|
| Comparison with Poisson distribution Blue bars denote a histogram of data divided into 1 sec bins. Red curve is a Poisson curve with rate = median count rate of data. |
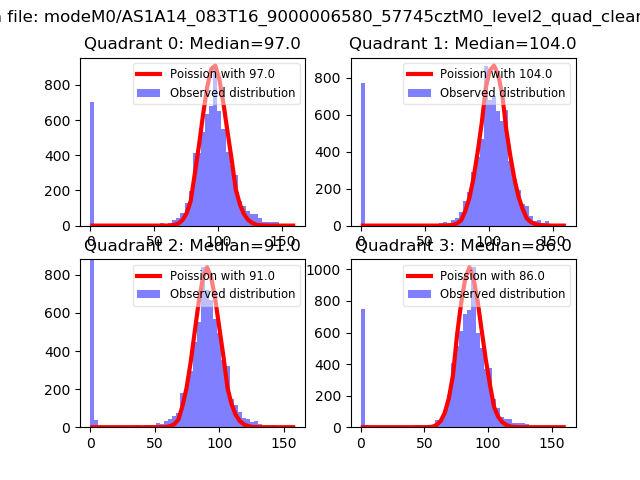 |
 |
| Quadrant-wise count rates Data is divided into 100 sec bins |
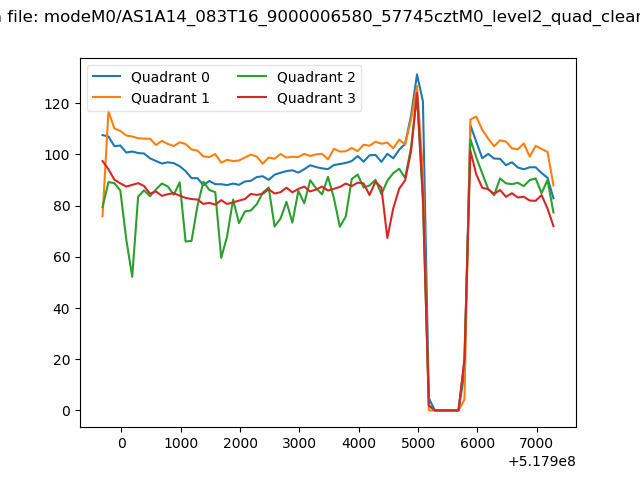 |
|
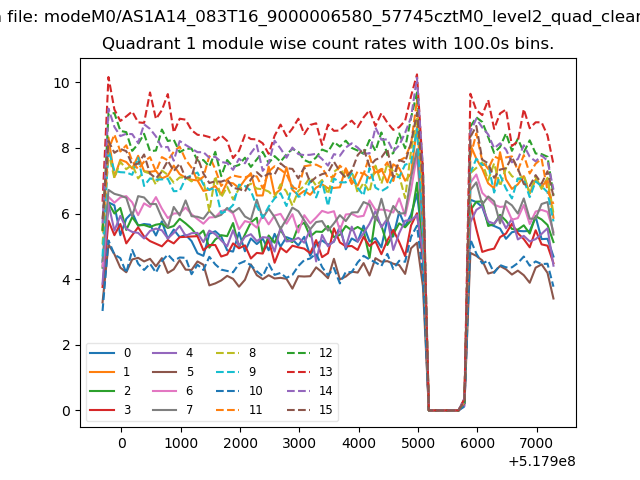
| Module-wise count rates for Quadrant A Data is divided into 100 sec bins |
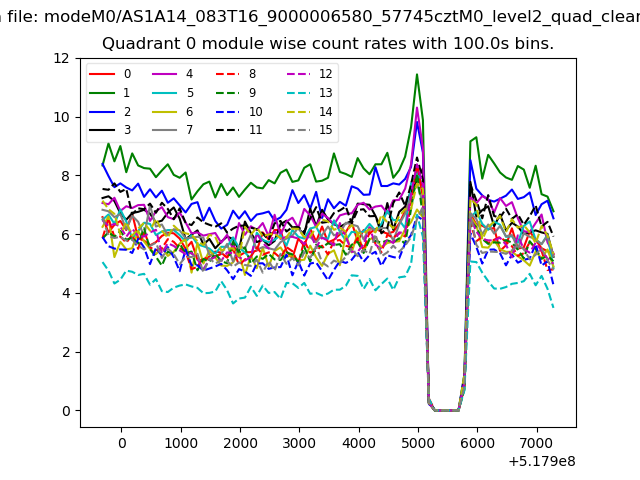 |
 |
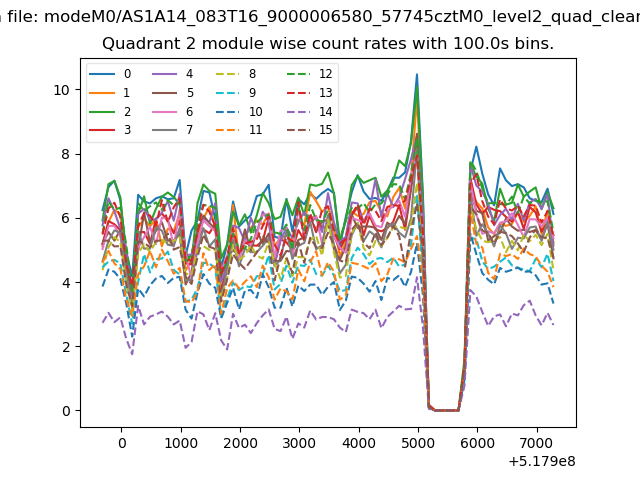
| Module-wise count rates for Quadrant B Data is divided into 100 sec bins |
 |
 |
| Module-wise count rates for Quadrant C Data is divided into 100 sec bins |
 |
 |
| Module-wise count rates for Quadrant D Data is divided into 100 sec bins |
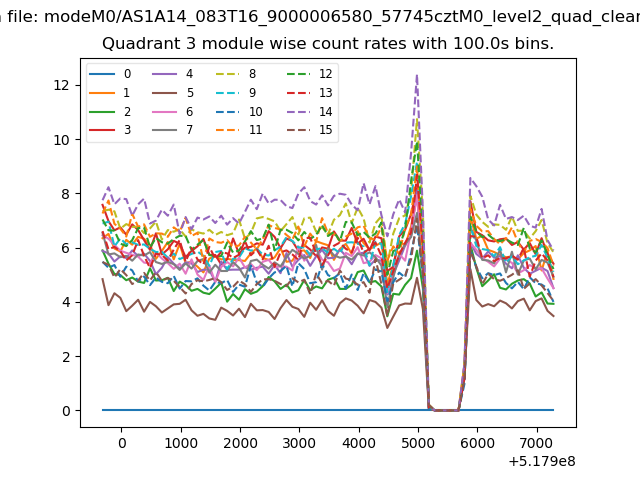 |
 |
| Parameter | Plot |
|---|---|
| CZT HV Monitor | 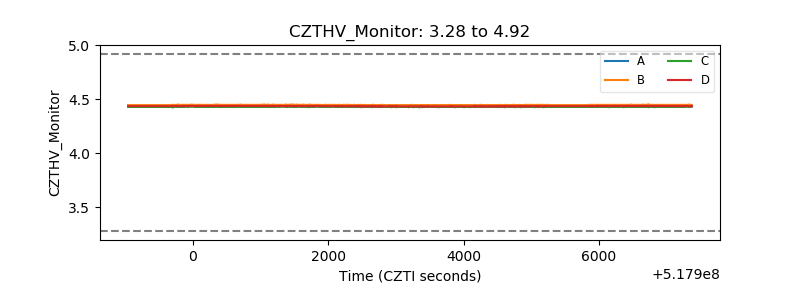 |
| D_VDD | 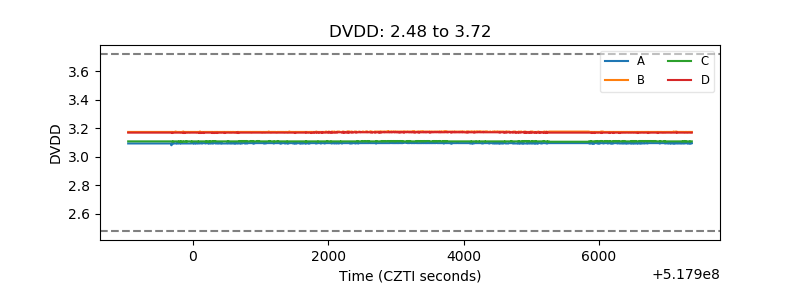 |
| Temperature 1 | 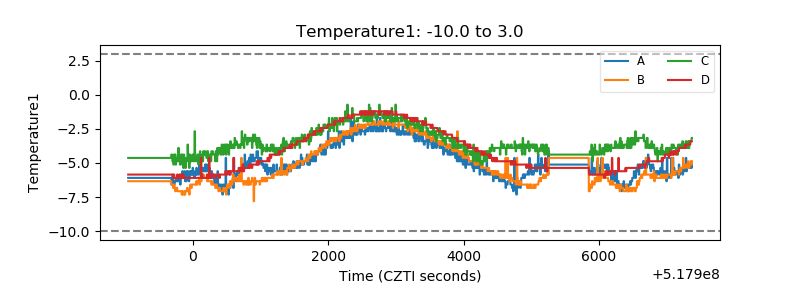 |
| Veto HV Monitor | 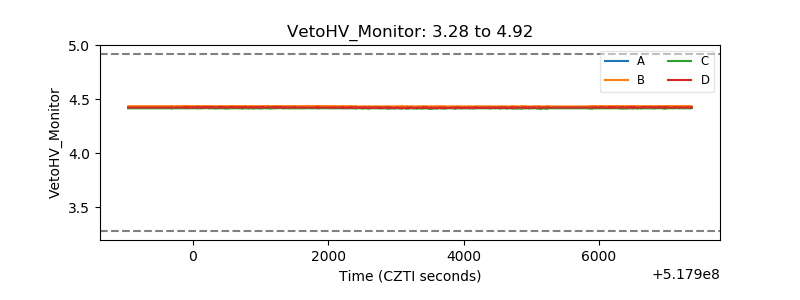 |
| Veto LLD | 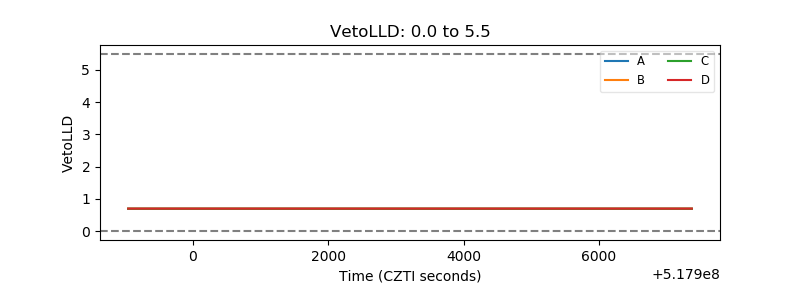 |
| Alpha Counter | 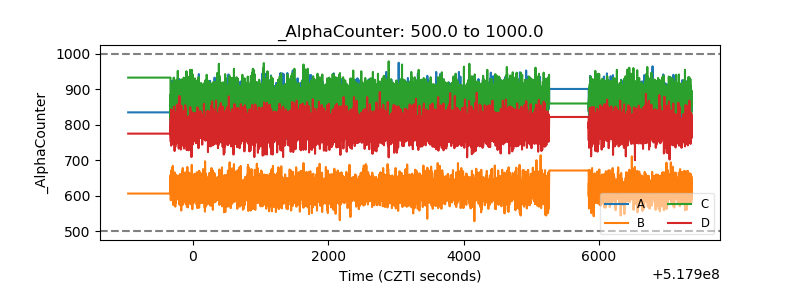 |
| _CPM_Rate | 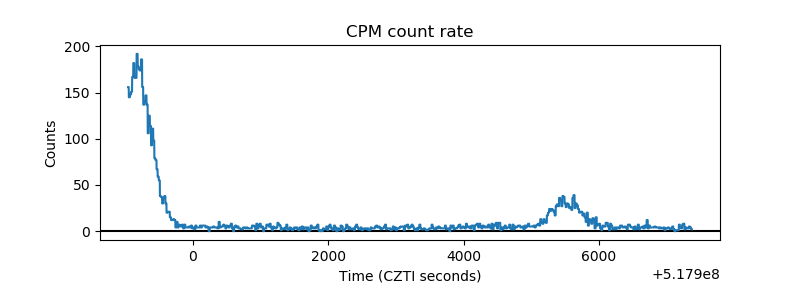 |
| CZT Counter | 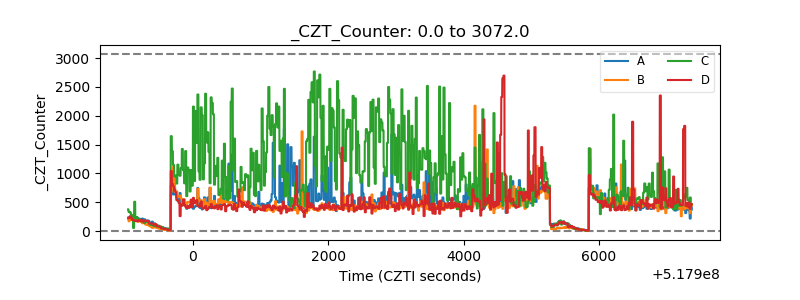 |
| +2.5 Volts monitor | 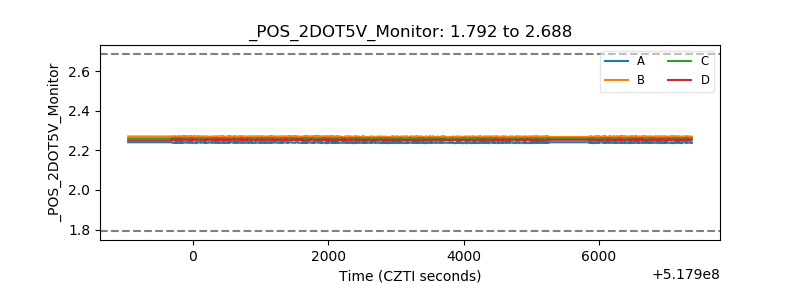 |
| +5 Volts monitor | 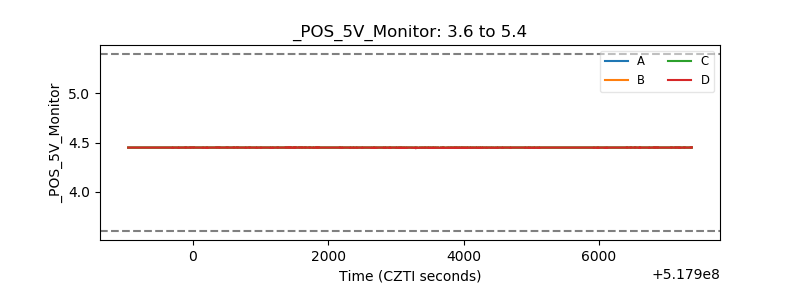 |
| _ROLL_ROT | 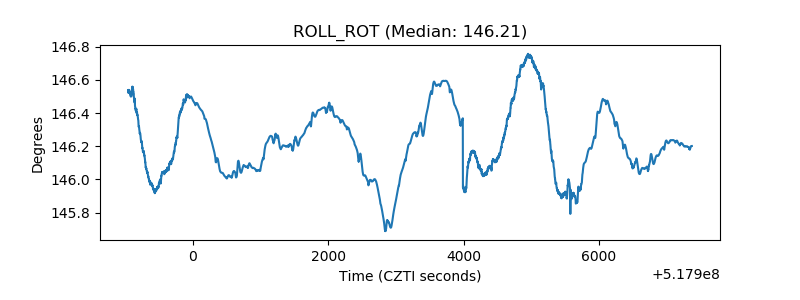 |
| _Roll_DEC | 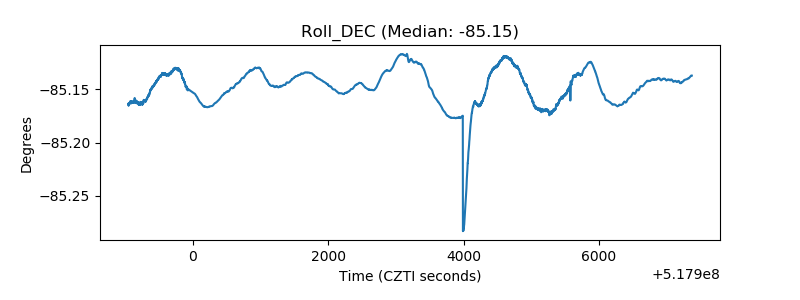 |
| _Roll_RA | 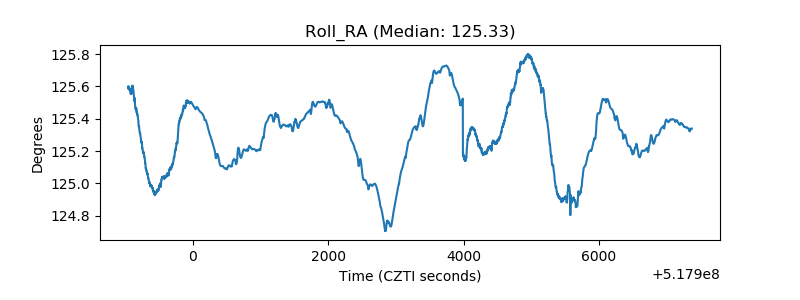 |
| Veto Counter | 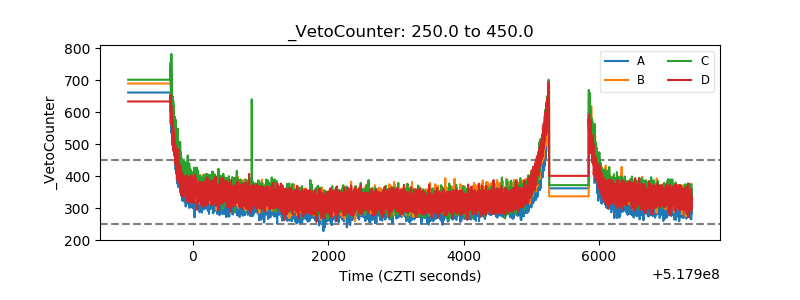 |