| Param | Original file | Final file |
|---|---|---|
| Filename | modeM0/AS1A14_083T16_9000006580_57746cztM0_level2.fits | modeM0/AS1A14_083T16_9000006580_57746cztM0_level2_quad_clean.evt |
| Size (bytes) | 534,948,480 | 112,682,880 |
| Size | 510.2 MB | 107.5 MB |
| Events in quadrant A | 4,170,074 | 740,009 |
| Events in quadrant B | 3,921,048 | 791,047 |
| Events in quadrant C | 6,764,553 | 668,298 |
| Events in quadrant D | 4,334,982 | 665,643 |
| Mode SS | |||
|---|---|---|---|
| Quadrant | BADHDUFLAG | Total packets | Discarded packets |
| A | 0 | 156 | 0 |
| B | 0 | 156 | 2 |
| C | 0 | 156 | 0 |
| D | 0 | 156 | 0 |
| Mode M0 | |||
|---|---|---|---|
| Quadrant | BADHDUFLAG | Total packets | Discarded packets |
| A | 0 | 18305 | 78 |
| B | 0 | 17300 | 61 |
| C | 0 | 25571 | 61 |
| D | 0 | 18513 | 63 |
| Mode M9 | |||
|---|---|---|---|
| Quadrant | BADHDUFLAG | Total packets | Discarded packets |
| A | 0 | 3 | 1 |
| B | 0 | 3 | 0 |
| C | 0 | 3 | 2 |
| D | 0 | 3 | 1 |
| Quadrant | Total seconds | Saturated seconds | Saturation percentage |
|---|---|---|---|
| A | 7867 | 246 | 3.126986% |
| B | 7873 | 279 | 3.543757% |
| C | 7871 | 747 | 9.490535% |
| D | 7870 | 202 | 2.566709% |
Noise dominated data is calculated using 1-second bins in cleaned event files. If a bin has >2000 counts, and if more than 50% of those come from <1% of pixels, then it is considered to be noise-dominated and hence unusable.
| Quadrant | # 1 sec bins | Bins with >0 counts | Bins with >2000 counts | High rate bins dominated by noise | Noise dominated (total time) | Noise dominated (detector-on time) | Marked lightcurve |
|---|---|---|---|---|---|---|---|
| A | 7888 | 7882 | 98 | 98 | 1.24% | 1.24% | 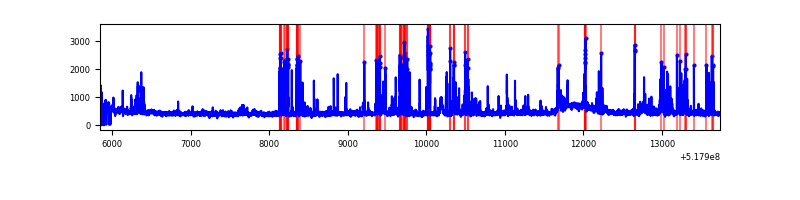 |
| B | 7891 | 7887 | 37 | 37 | 0.47% | 0.47% | 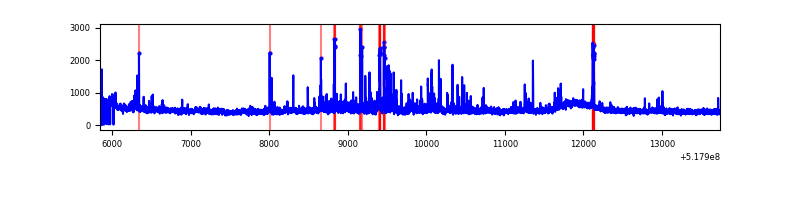 |
| C | 7890 | 7885 | 483 | 483 | 6.12% | 6.13% | 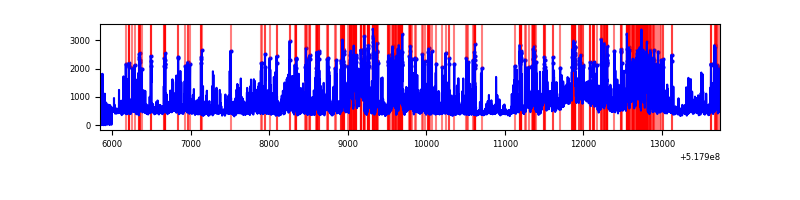 |
| D | 7887 | 7882 | 118 | 118 | 1.50% | 1.50% | 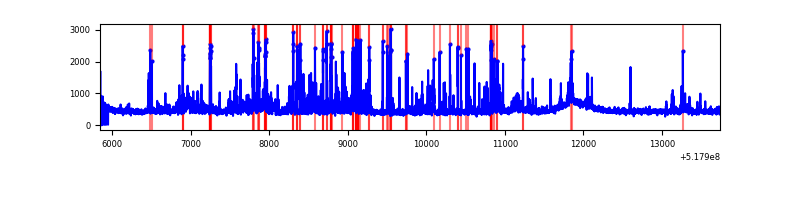 |
Top three noisy pixels from each quadrant. If the there are fewer than three noisy pixels in the level2.evt file, extra rows are filled as -1
| Pixel properties | Quadrant properties | ||||||
|---|---|---|---|---|---|---|---|
| Quadrant | DetID | PixID | Counts | Sigma | Mean | Median | Sigma |
| A | 10 | 251 | 653363 | 3097.35 | 849 | 824 | 210.7 |
| A | 7 | 160 | 93785 | 441.25 | 849 | 824 | 210.7 |
| A | 4 | 249 | 58806 | 275.22 | 849 | 824 | 210.7 |
| B | 0 | 63 | 123548 | 686.09 | 844 | 810 | 178.9 |
| B | 8 | 128 | 76152 | 421.15 | 844 | 810 | 178.9 |
| B | 5 | 185 | 68667 | 379.31 | 844 | 810 | 178.9 |
| C | 15 | 224 | 1767617 | 8099.19 | 810 | 801 | 218.1 |
| C | 9 | 38 | 1205291 | 5521.46 | 810 | 801 | 218.1 |
| C | 12 | 2 | 257165 | 1175.19 | 810 | 801 | 218.1 |
| D | 8 | 240 | 228675 | 977.61 | 831 | 792 | 233.1 |
| D | 2 | 153 | 195992 | 837.41 | 831 | 792 | 233.1 |
| D | 3 | 12 | 138708 | 591.66 | 831 | 792 | 233.1 |
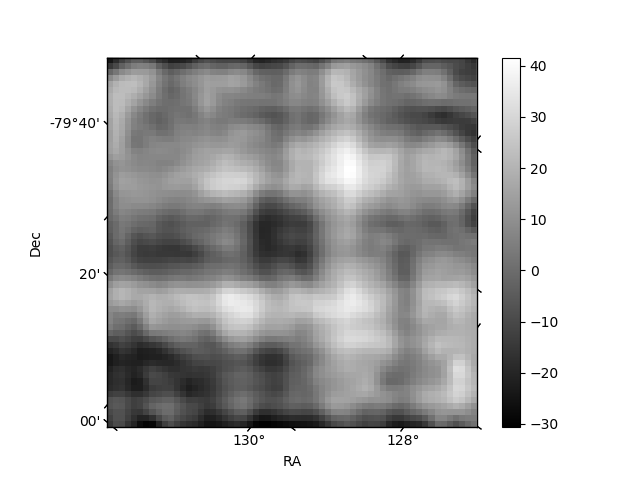
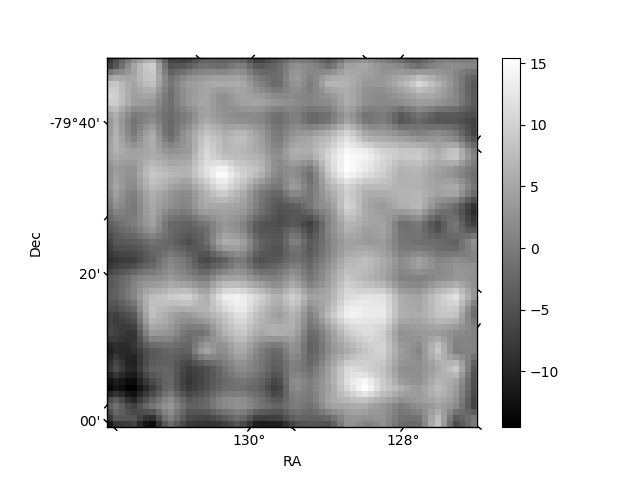
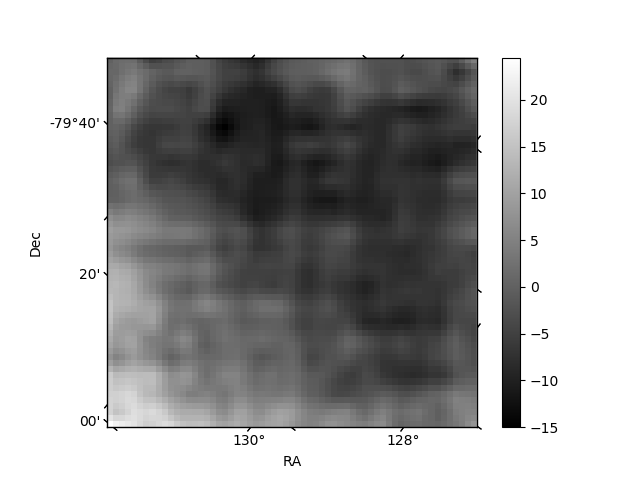
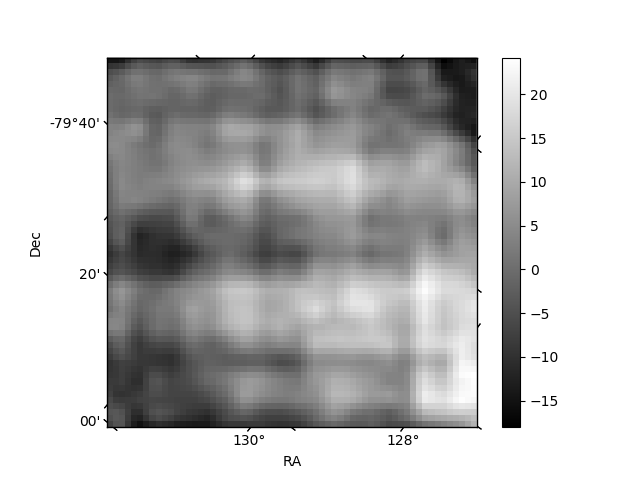
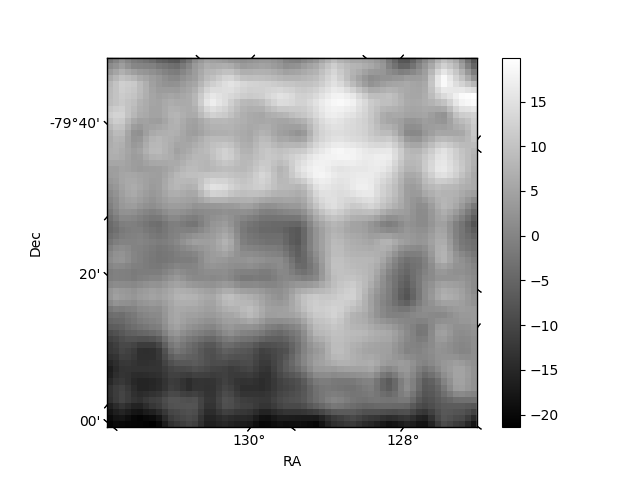
Histogram calculated using DETX and DETY for each event in the final _common_clean file
| Quadrant A | 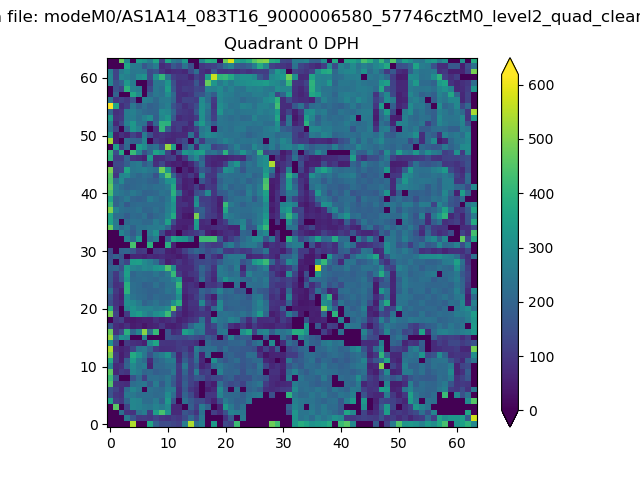 |
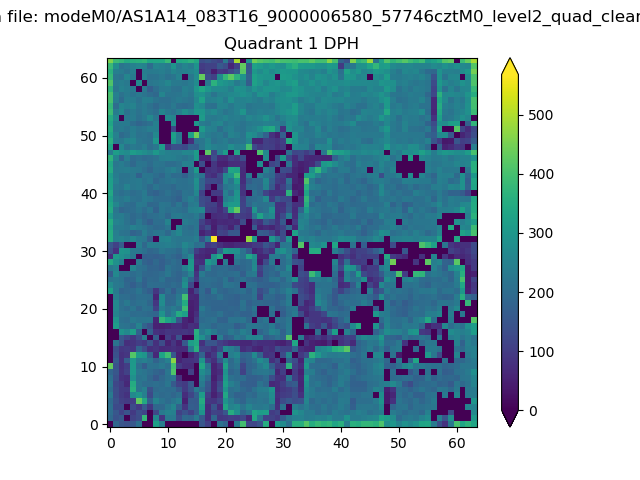 |
Quadrant B |
|---|---|---|---|
| Quadrant D | 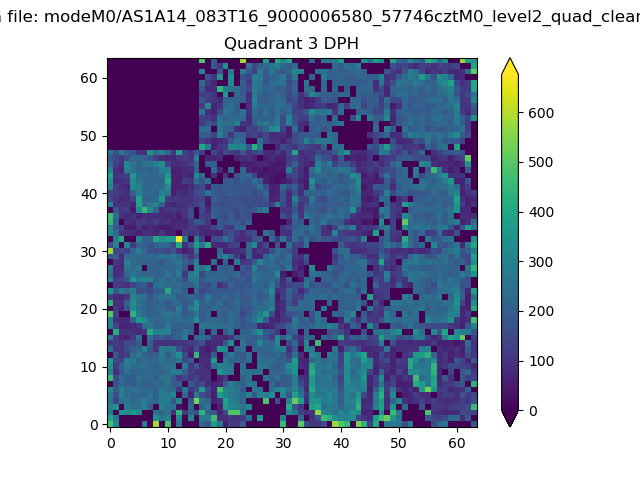 |
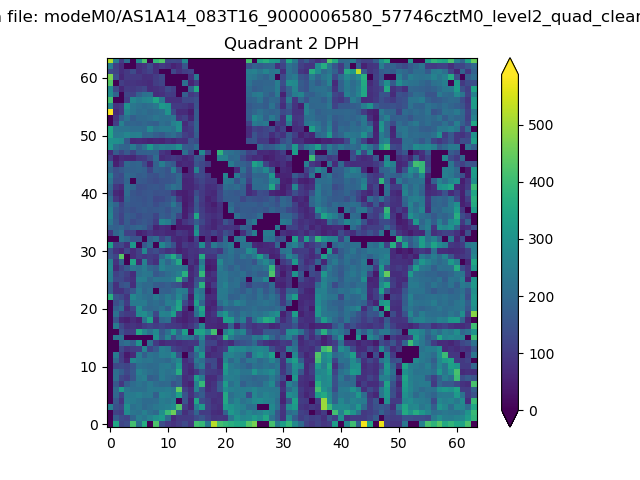 |
Quadrant C |
| Plot type | Count rate plots | Images |
|---|---|---|
| Comparison with Poisson distribution Blue bars denote a histogram of data divided into 1 sec bins. Red curve is a Poisson curve with rate = median count rate of data. |
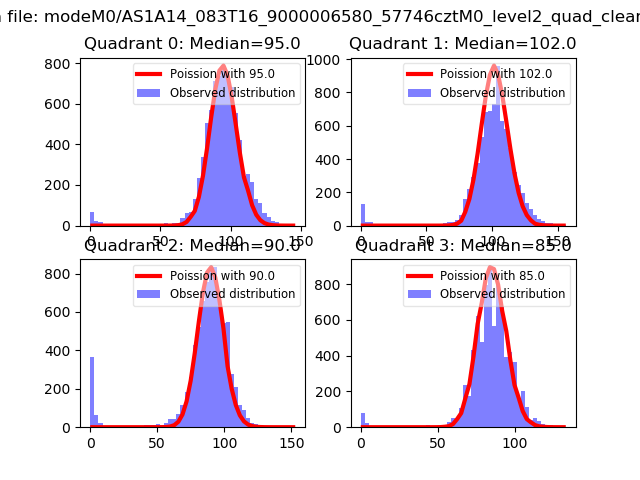 |
 |
| Quadrant-wise count rates Data is divided into 100 sec bins |
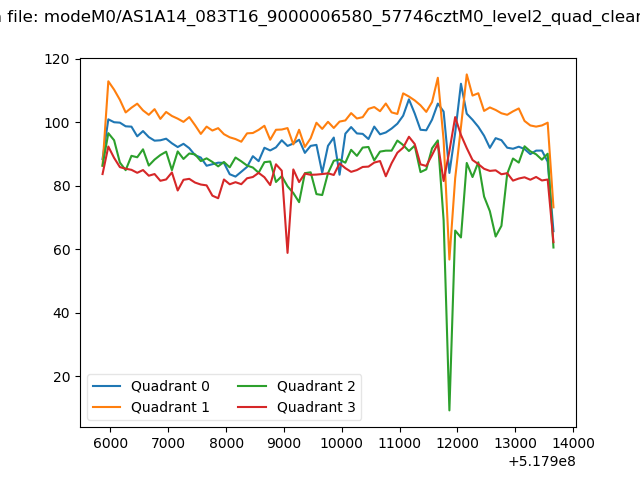 |
|
| Module-wise count rates for Quadrant A Data is divided into 100 sec bins |
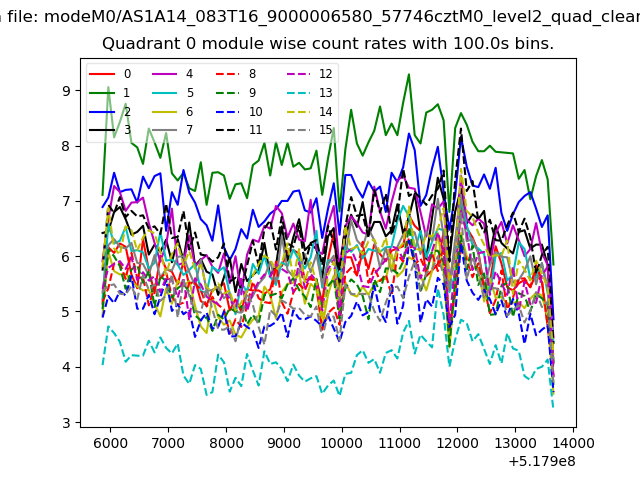 |
 |
| Module-wise count rates for Quadrant B Data is divided into 100 sec bins |
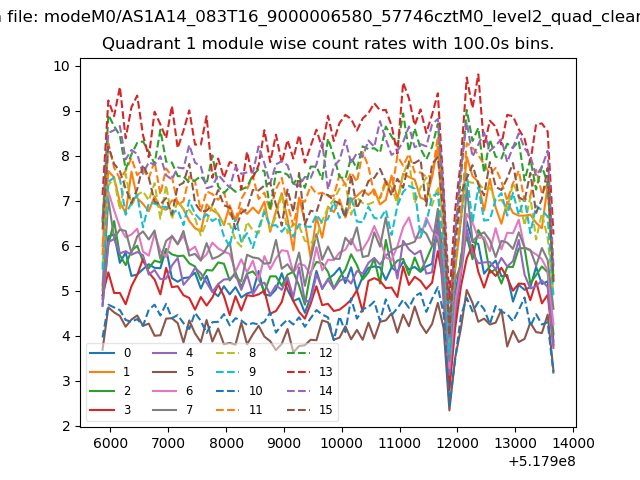 |
 |
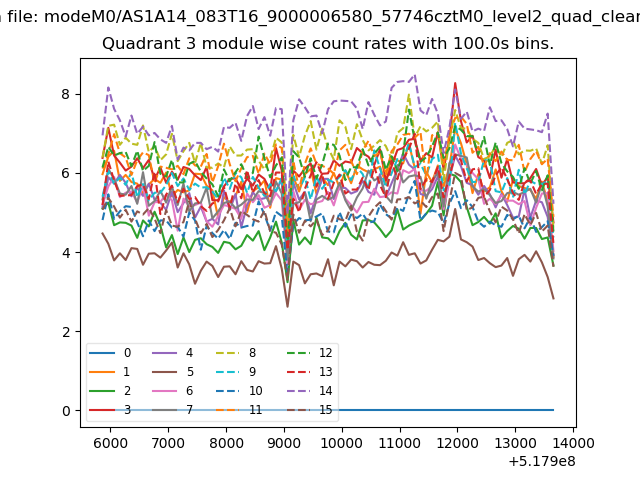
| Module-wise count rates for Quadrant C Data is divided into 100 sec bins |
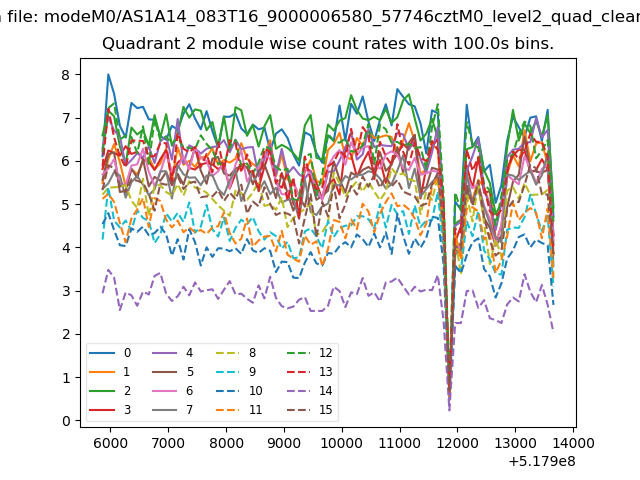 |
 |
| Module-wise count rates for Quadrant D Data is divided into 100 sec bins |
 |
 |
| Parameter | Plot |
|---|---|
| CZT HV Monitor | 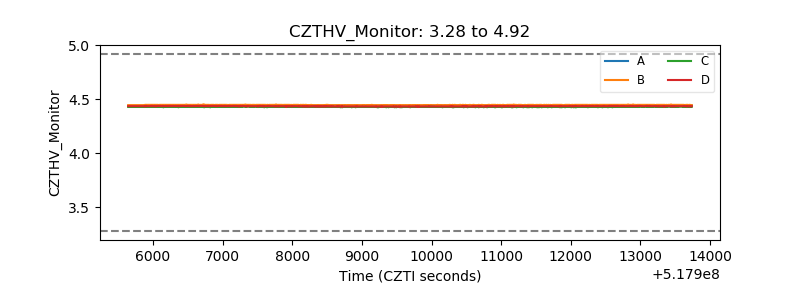 |
| D_VDD | 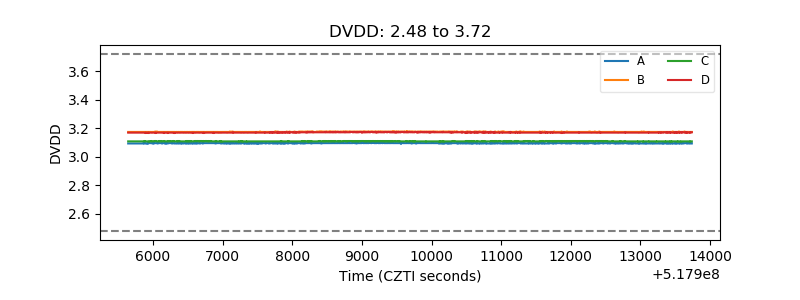 |
| Temperature 1 | 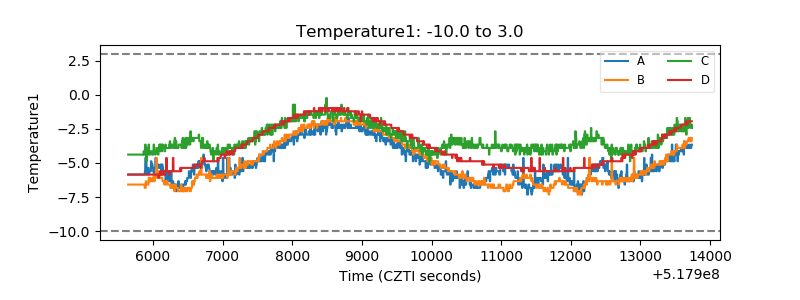 |
| Veto HV Monitor |  |
| Veto LLD | 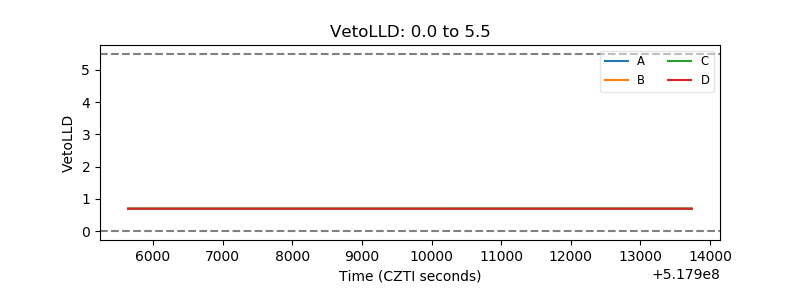 |
| Alpha Counter | 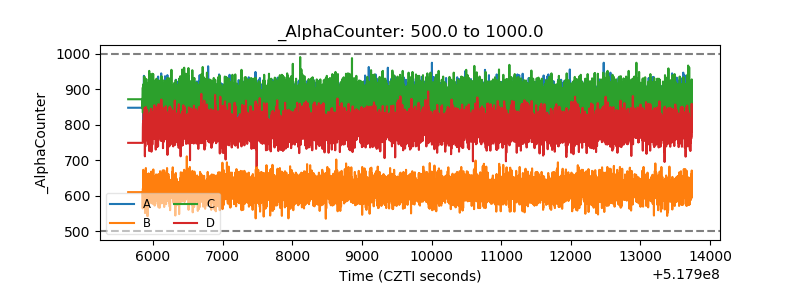 |
| _CPM_Rate | 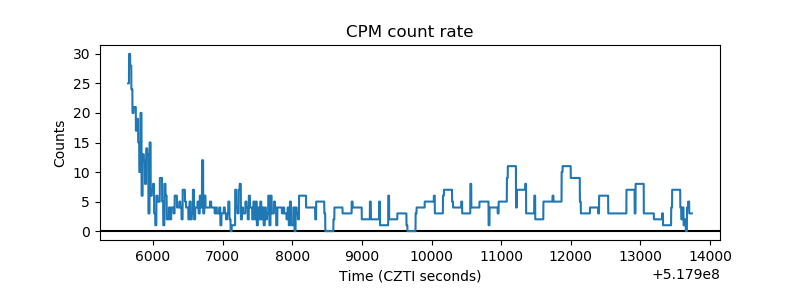 |
| CZT Counter | 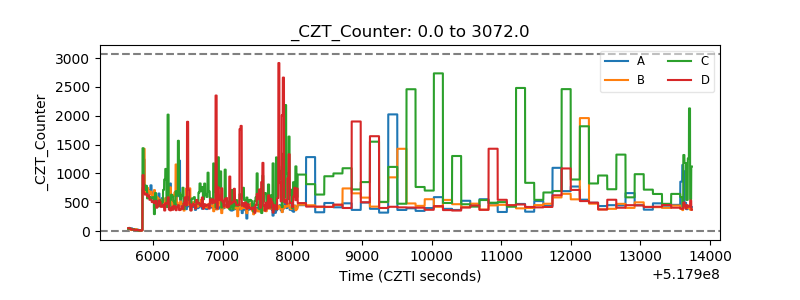 |
| +2.5 Volts monitor | 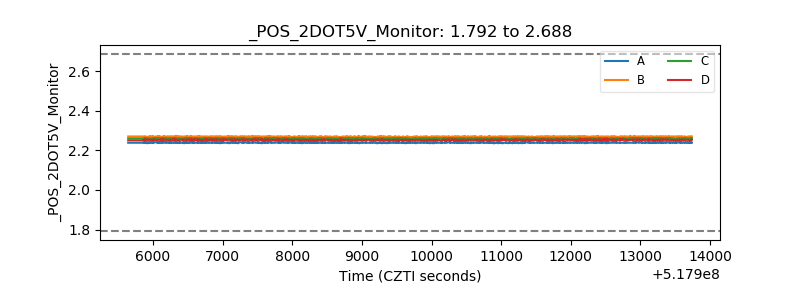 |
| +5 Volts monitor | 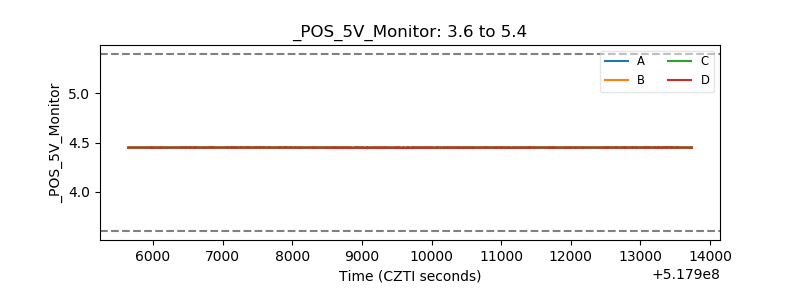 |
| _ROLL_ROT | 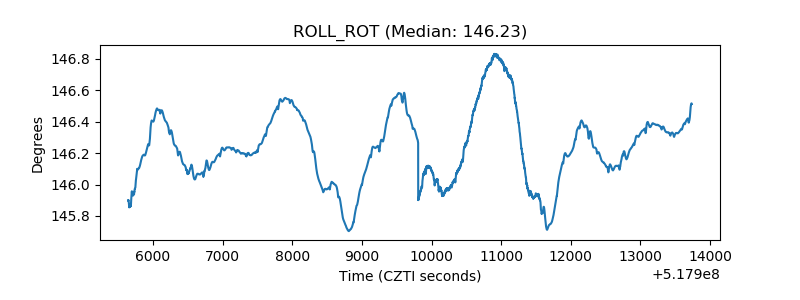 |
| _Roll_DEC | 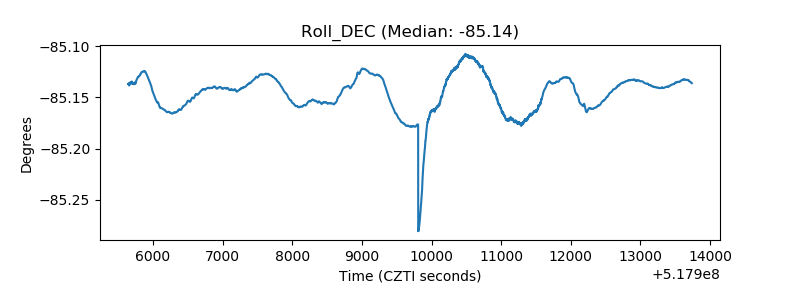 |
| _Roll_RA | 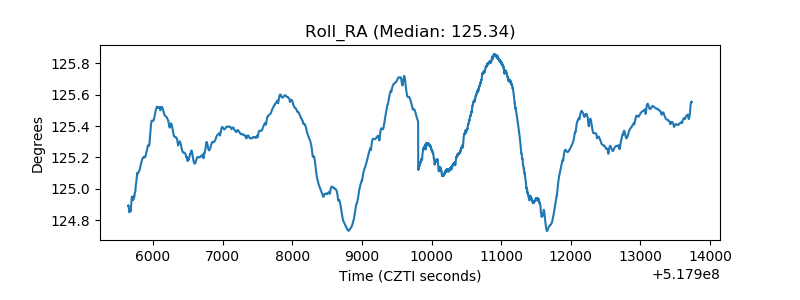 |
| Veto Counter | 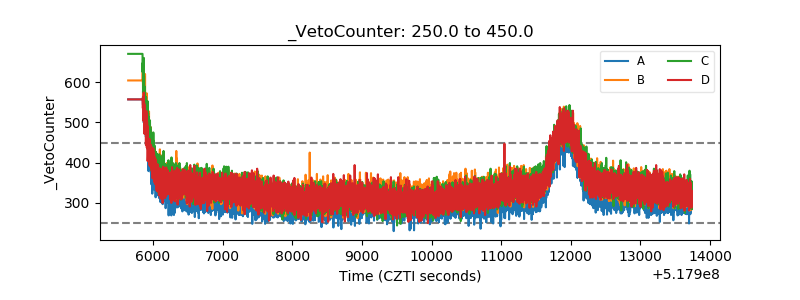 |