| Param | Original file | Final file |
|---|---|---|
| Filename | modeM0/AS1A14_083T16_9000006580_57747cztM0_level2.fits | modeM0/AS1A14_083T16_9000006580_57747cztM0_level2_quad_clean.evt |
| Size (bytes) | 498,139,200 | 107,821,440 |
| Size | 475.1 MB | 102.8 MB |
| Events in quadrant A | 3,543,563 | 708,332 |
| Events in quadrant B | 4,035,664 | 746,641 |
| Events in quadrant C | 6,162,464 | 653,267 |
| Events in quadrant D | 4,114,099 | 633,055 |
| Mode SS | |||
|---|---|---|---|
| Quadrant | BADHDUFLAG | Total packets | Discarded packets |
| A | 0 | 152 | 0 |
| B | 0 | 152 | 0 |
| C | 0 | 152 | 0 |
| D | 0 | 152 | 0 |
| Mode M0 | |||
|---|---|---|---|
| Quadrant | BADHDUFLAG | Total packets | Discarded packets |
| A | 0 | 16019 | 0 |
| B | 0 | 17380 | 0 |
| C | 0 | 23534 | 0 |
| D | 0 | 17462 | 0 |
| Quadrant | Total seconds | Saturated seconds | Saturation percentage |
|---|---|---|---|
| A | 7514 | 45 | 0.598882% |
| B | 7515 | 172 | 2.288756% |
| C | 7515 | 468 | 6.227545% |
| D | 7515 | 108 | 1.437126% |
Noise dominated data is calculated using 1-second bins in cleaned event files. If a bin has >2000 counts, and if more than 50% of those come from <1% of pixels, then it is considered to be noise-dominated and hence unusable.
| Quadrant | # 1 sec bins | Bins with >0 counts | Bins with >2000 counts | High rate bins dominated by noise | Noise dominated (total time) | Noise dominated (detector-on time) | Marked lightcurve |
|---|---|---|---|---|---|---|---|
| A | 7514 | 7514 | 31 | 31 | 0.41% | 0.41% | 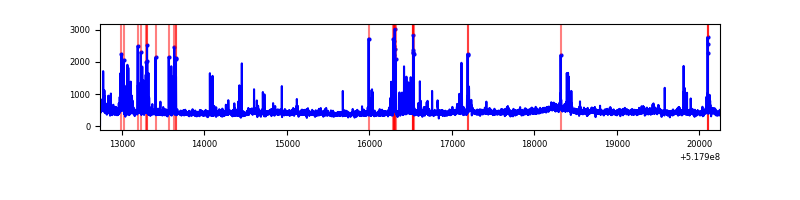 |
| B | 7515 | 7515 | 110 | 110 | 1.46% | 1.46% | 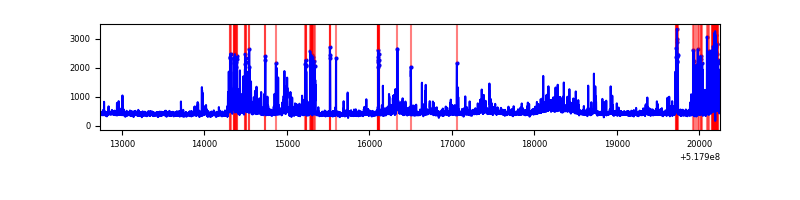 |
| C | 7515 | 7515 | 369 | 369 | 4.91% | 4.91% | 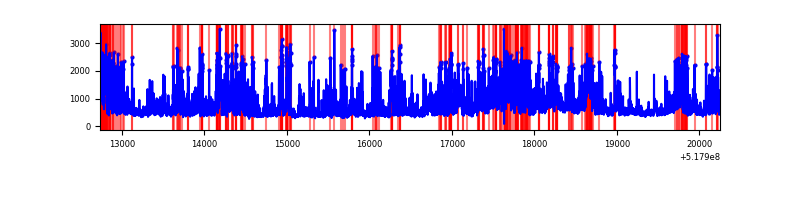 |
| D | 7515 | 7515 | 91 | 91 | 1.21% | 1.21% | 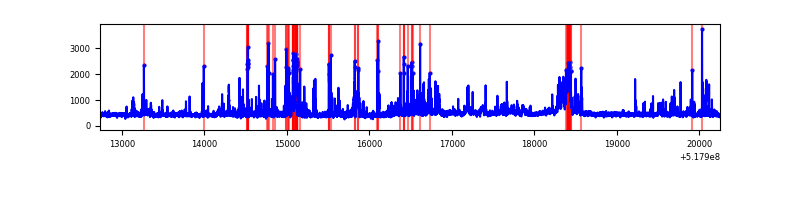 |
Top three noisy pixels from each quadrant. If the there are fewer than three noisy pixels in the level2.evt file, extra rows are filled as -1
| Pixel properties | Quadrant properties | ||||||
|---|---|---|---|---|---|---|---|
| Quadrant | DetID | PixID | Counts | Sigma | Mean | Median | Sigma |
| A | 10 | 251 | 263024 | 1339.6 | 792 | 770 | 195.8 |
| A | 4 | 249 | 61433 | 309.87 | 792 | 770 | 195.8 |
| A | 4 | 236 | 38619 | 193.33 | 792 | 770 | 195.8 |
| B | 8 | 128 | 385773 | 2299.61 | 778 | 748 | 167.4 |
| B | 4 | 171 | 189671 | 1128.37 | 778 | 748 | 167.4 |
| B | 0 | 213 | 131285 | 779.65 | 778 | 748 | 167.4 |
| C | 15 | 224 | 1717955 | 8305.52 | 760 | 750 | 206.8 |
| C | 9 | 38 | 1173970 | 5674.46 | 760 | 750 | 206.8 |
| C | 12 | 2 | 85713 | 410.94 | 760 | 750 | 206.8 |
| D | 8 | 240 | 253919 | 1169.95 | 769 | 734 | 216.4 |
| D | 2 | 249 | 183390 | 844.04 | 769 | 734 | 216.4 |
| D | 15 | 142 | 130756 | 600.82 | 769 | 734 | 216.4 |
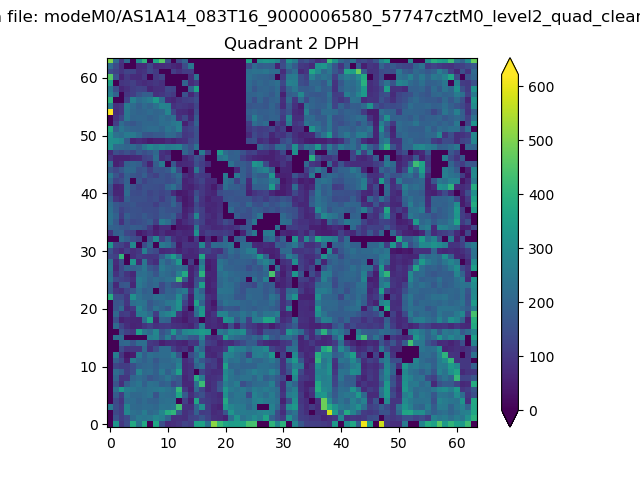
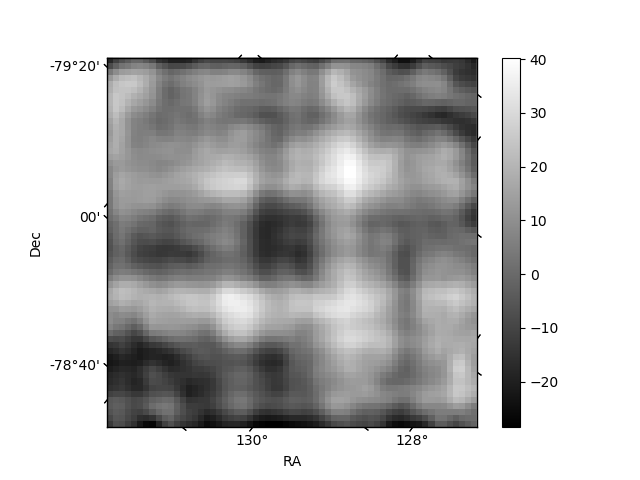
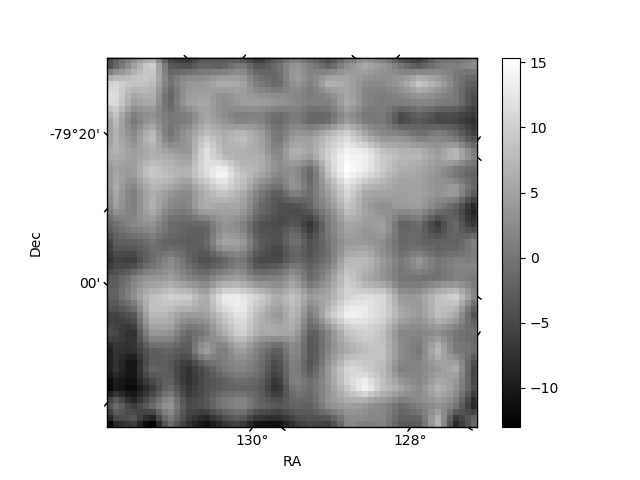
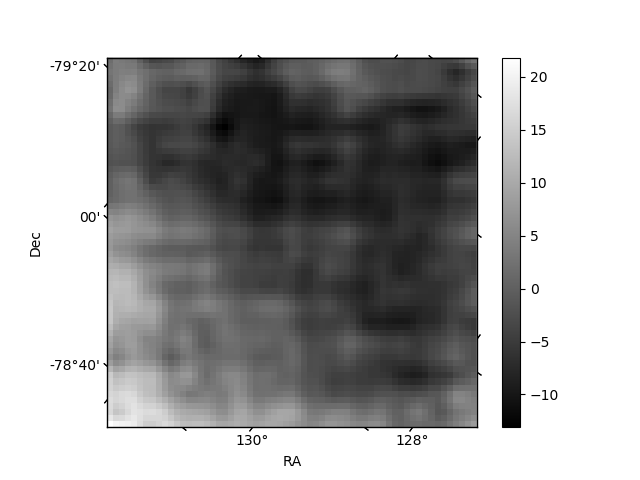
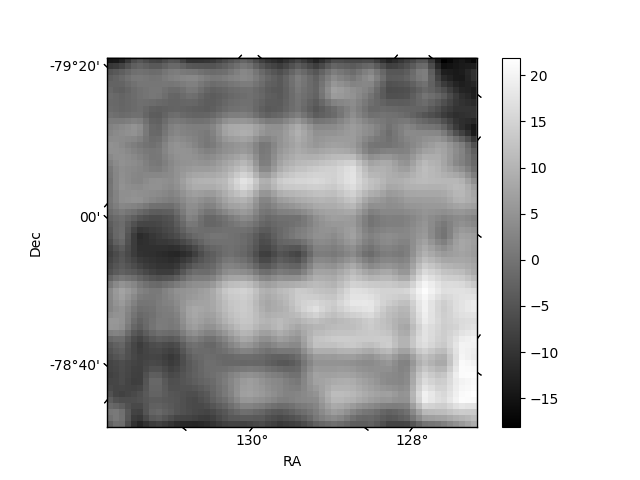
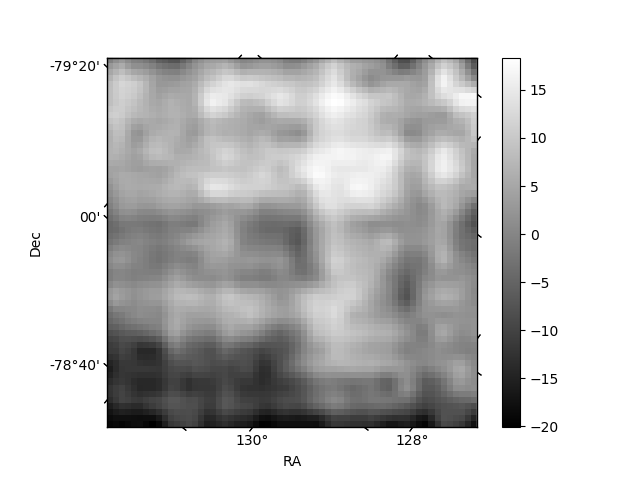
Histogram calculated using DETX and DETY for each event in the final _common_clean file
| Quadrant A | 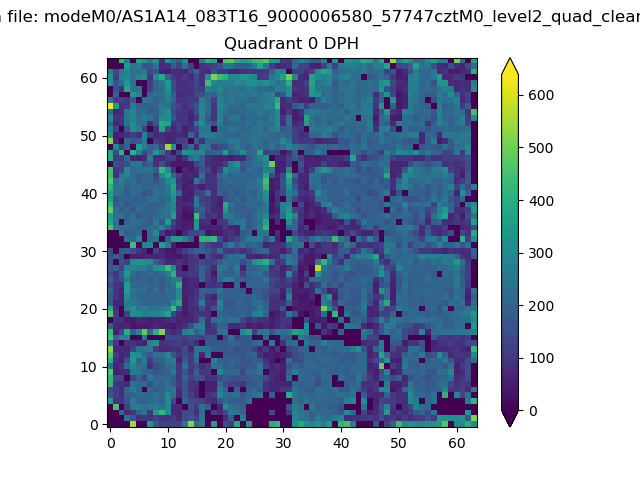 |
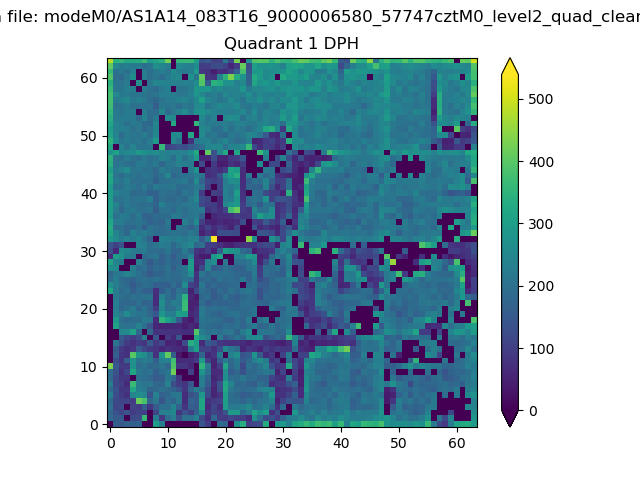 |
Quadrant B |
|---|---|---|---|
| Quadrant D | 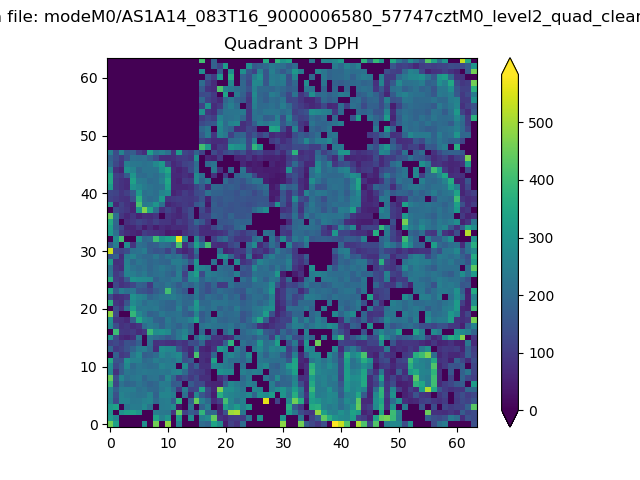 |
 |
Quadrant C |
| Plot type | Count rate plots | Images |
|---|---|---|
| Comparison with Poisson distribution Blue bars denote a histogram of data divided into 1 sec bins. Red curve is a Poisson curve with rate = median count rate of data. |
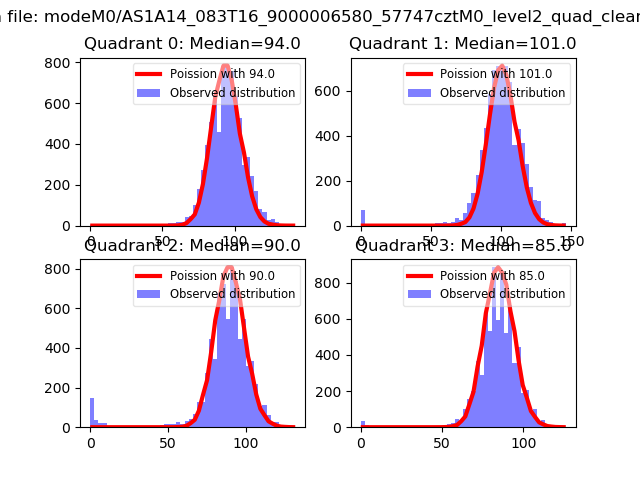 |
 |
| Quadrant-wise count rates Data is divided into 100 sec bins |
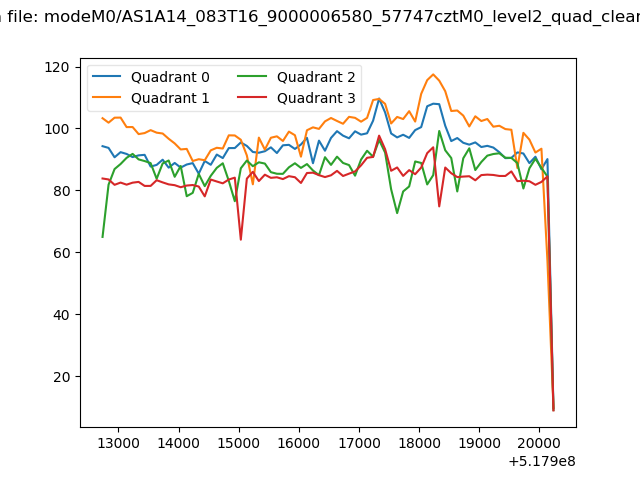 |
|
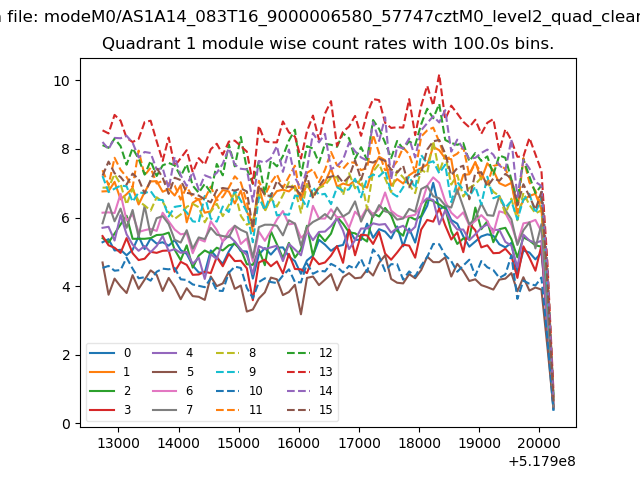
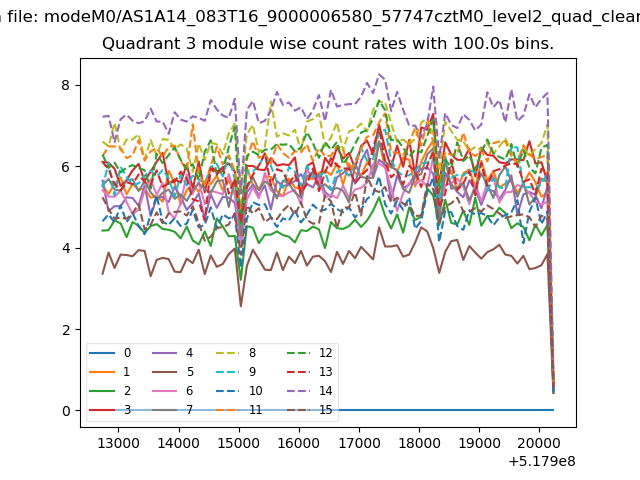
| Module-wise count rates for Quadrant A Data is divided into 100 sec bins |
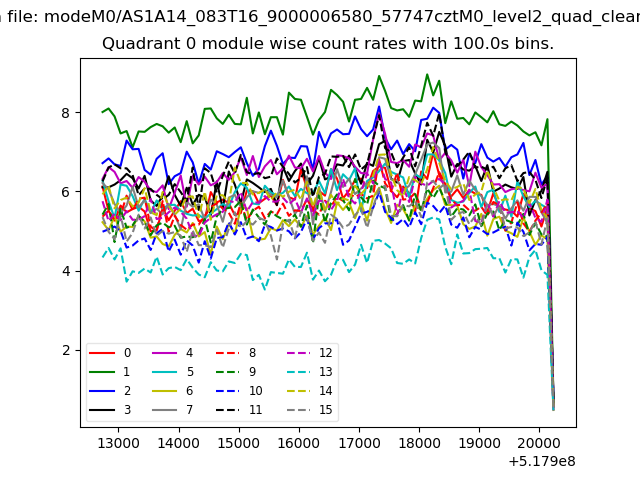 |
 |
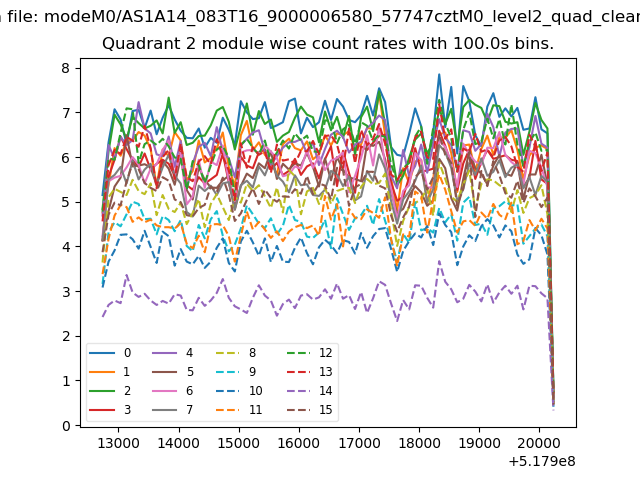
| Module-wise count rates for Quadrant B Data is divided into 100 sec bins |
 |
 |
| Module-wise count rates for Quadrant C Data is divided into 100 sec bins |
 |
 |
| Module-wise count rates for Quadrant D Data is divided into 100 sec bins |
 |
 |
| Parameter | Plot |
|---|---|
| CZT HV Monitor | 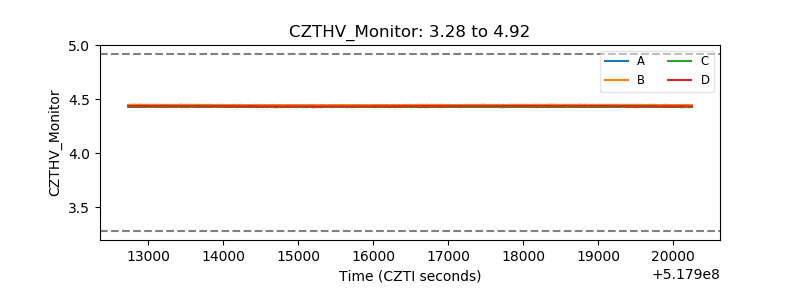 |
| D_VDD | 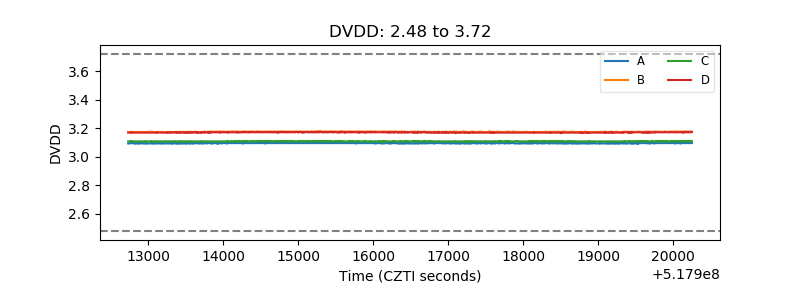 |
| Temperature 1 | 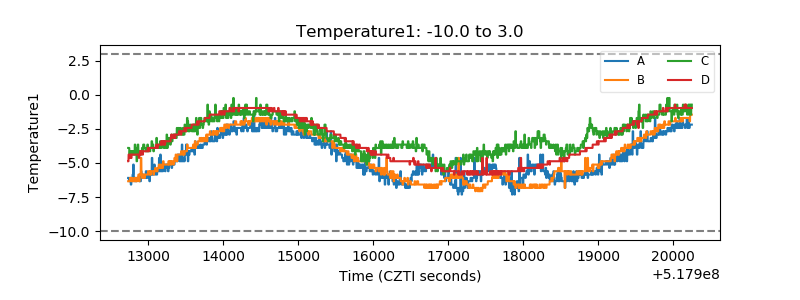 |
| Veto HV Monitor | 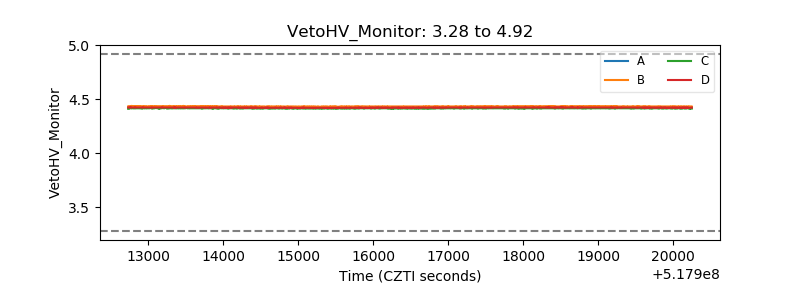 |
| Veto LLD | 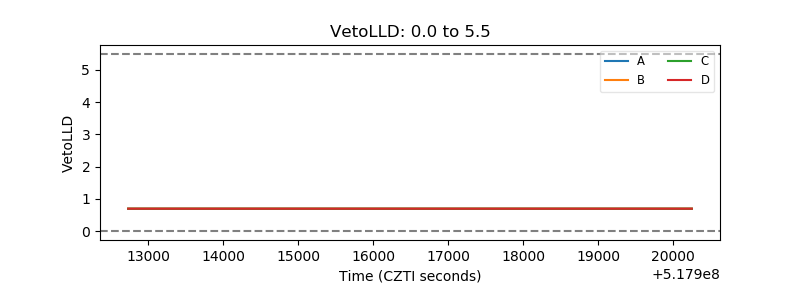 |
| Alpha Counter | 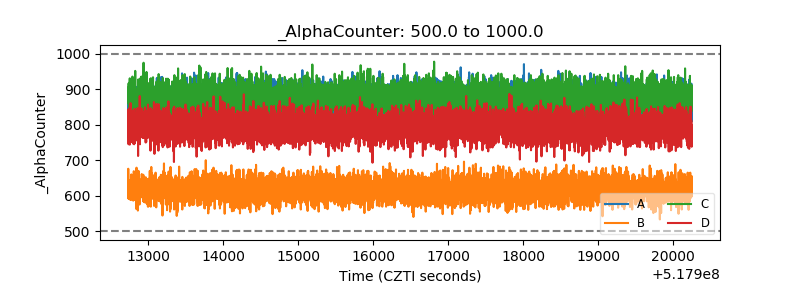 |
| _CPM_Rate | 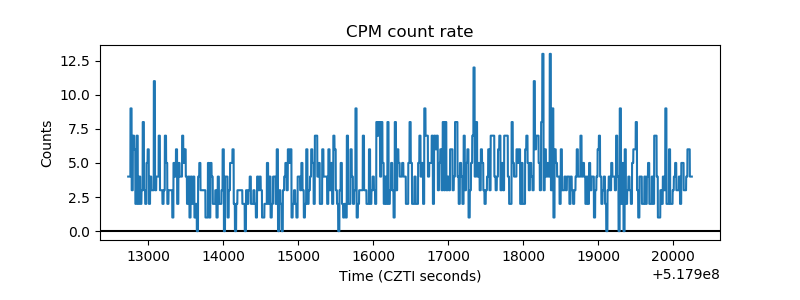 |
| CZT Counter | 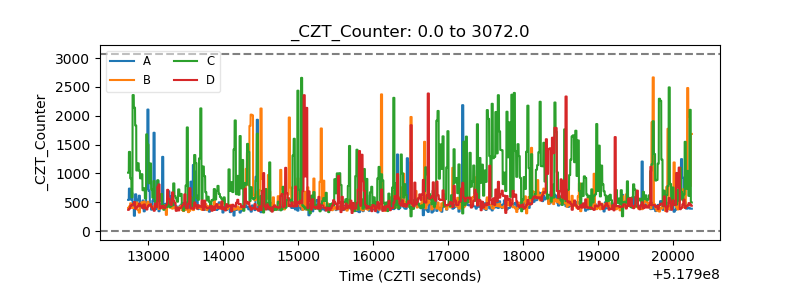 |
| +2.5 Volts monitor | 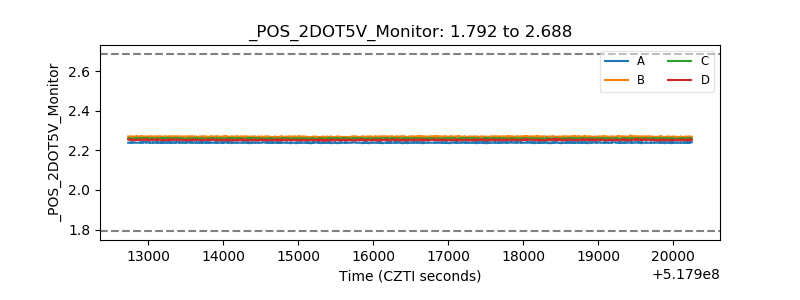 |
| +5 Volts monitor | 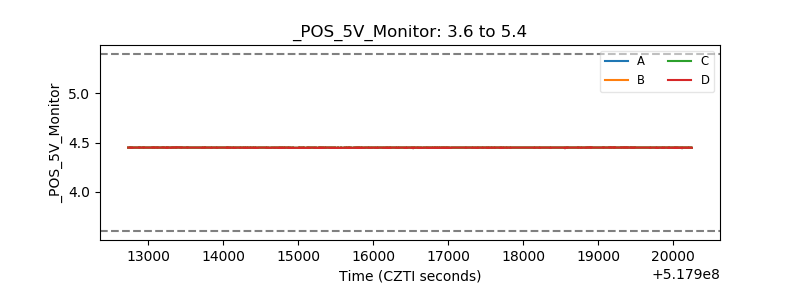 |
| _ROLL_ROT | 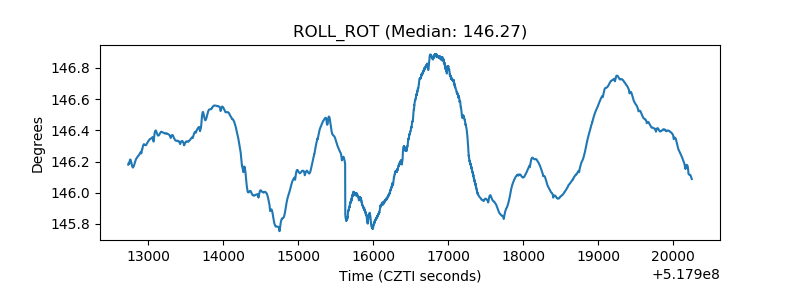 |
| _Roll_DEC | 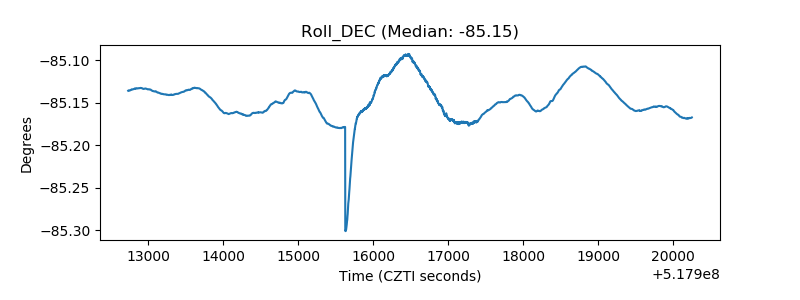 |
| _Roll_RA | 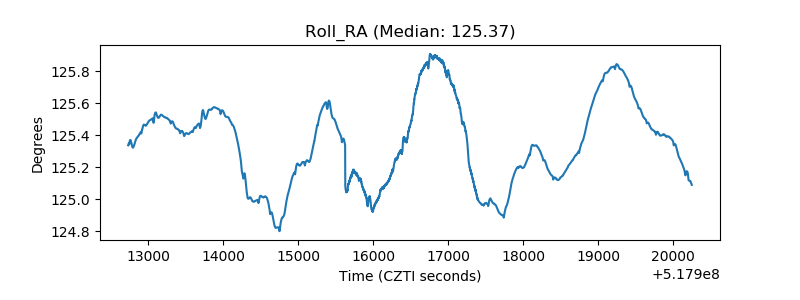 |
| Veto Counter | 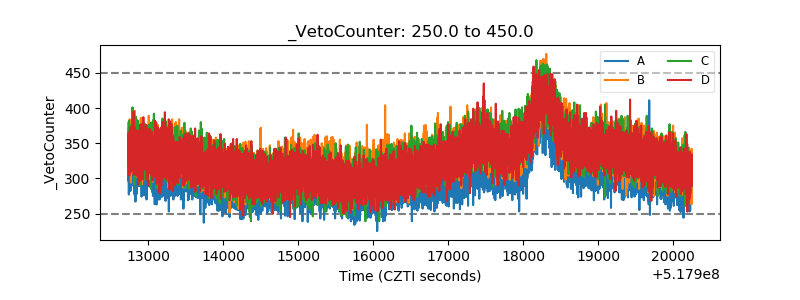 |