| Param | Original file | Final file |
|---|---|---|
| Filename | modeM0/AS1A14_083T16_9000006580_57752cztM0_level2.fits | modeM0/AS1A14_083T16_9000006580_57752cztM0_level2_quad_clean.evt |
| Size (bytes) | 513,728,640 | 93,847,680 |
| Size | 489.9 MB | 89.5 MB |
| Events in quadrant A | 3,056,872 | 633,621 |
| Events in quadrant B | 3,739,639 | 663,587 |
| Events in quadrant C | 6,325,766 | 555,867 |
| Events in quadrant D | 5,383,294 | 529,558 |
| Mode SS | |||
|---|---|---|---|
| Quadrant | BADHDUFLAG | Total packets | Discarded packets |
| A | 0 | 134 | 2 |
| B | 0 | 134 | 0 |
| C | 0 | 134 | 2 |
| D | 0 | 134 | 0 |
| Mode M0 | |||
|---|---|---|---|
| Quadrant | BADHDUFLAG | Total packets | Discarded packets |
| A | 0 | 13821 | 39 |
| B | 0 | 15699 | 53 |
| C | 0 | 23573 | 172 |
| D | 0 | 20611 | 30 |
| Mode M9 | |||
|---|---|---|---|
| Quadrant | BADHDUFLAG | Total packets | Discarded packets |
| A | 0 | 9 | 0 |
| B | 0 | 9 | 0 |
| C | 0 | 9 | 0 |
| D | 0 | 9 | 0 |
| Quadrant | Total seconds | Saturated seconds | Saturation percentage |
|---|---|---|---|
| A | 6580 | 38 | 0.577508% |
| B | 6583 | 136 | 2.065927% |
| C | 6573 | 650 | 9.888940% |
| D | 6585 | 552 | 8.382688% |
Noise dominated data is calculated using 1-second bins in cleaned event files. If a bin has >2000 counts, and if more than 50% of those come from <1% of pixels, then it is considered to be noise-dominated and hence unusable.
| Quadrant | # 1 sec bins | Bins with >0 counts | Bins with >2000 counts | High rate bins dominated by noise | Noise dominated (total time) | Noise dominated (detector-on time) | Marked lightcurve |
|---|---|---|---|---|---|---|---|
| A | 7498 | 6589 | 24 | 24 | 0.32% | 0.36% | 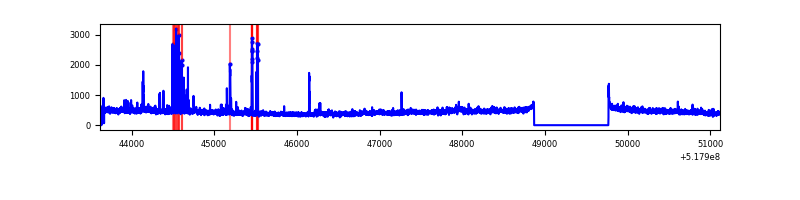 |
| B | 7494 | 6593 | 75 | 75 | 1.00% | 1.14% | 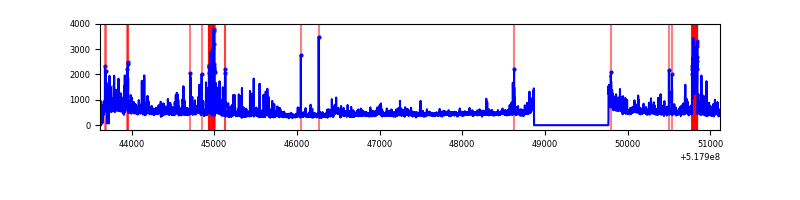 |
| C | 7498 | 6583 | 555 | 555 | 7.40% | 8.43% | 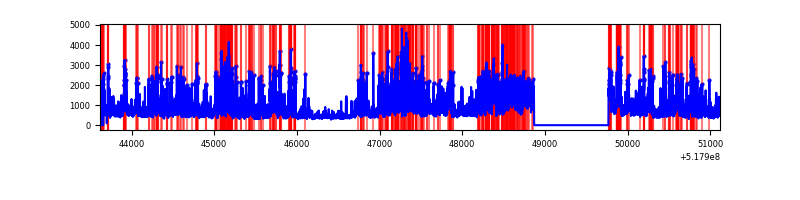 |
| D | 7498 | 6593 | 592 | 592 | 7.90% | 8.98% | 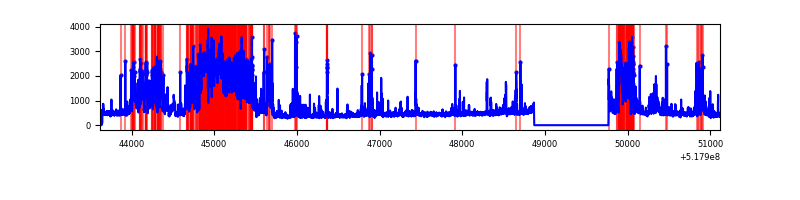 |
Top three noisy pixels from each quadrant. If the there are fewer than three noisy pixels in the level2.evt file, extra rows are filled as -1
| Pixel properties | Quadrant properties | ||||||
|---|---|---|---|---|---|---|---|
| Quadrant | DetID | PixID | Counts | Sigma | Mean | Median | Sigma |
| A | 3 | 128 | 91372 | 518.96 | 700 | 684 | 174.8 |
| A | 3 | 17 | 83299 | 472.76 | 700 | 684 | 174.8 |
| A | 7 | 160 | 72023 | 408.23 | 700 | 684 | 174.8 |
| B | 8 | 128 | 373696 | 2534.65 | 688 | 662 | 147.2 |
| B | 4 | 80 | 162277 | 1098.12 | 688 | 662 | 147.2 |
| B | 10 | 247 | 111443 | 752.72 | 688 | 662 | 147.2 |
| C | 9 | 38 | 1784120 | 10039.81 | 647 | 640 | 177.6 |
| C | 15 | 224 | 1720873 | 9683.77 | 647 | 640 | 177.6 |
| C | 15 | 208 | 144432 | 809.45 | 647 | 640 | 177.6 |
| D | 2 | 153 | 1944145 | 10366.24 | 656 | 626 | 187.5 |
| D | 2 | 249 | 460925 | 2455.12 | 656 | 626 | 187.5 |
| D | 5 | 32 | 98663 | 522.9 | 656 | 626 | 187.5 |
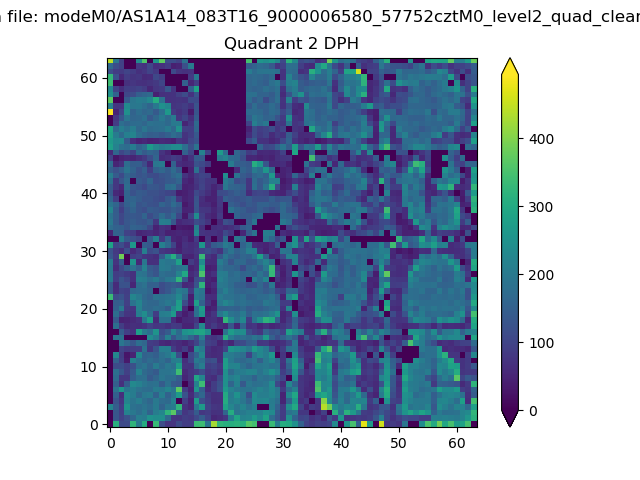
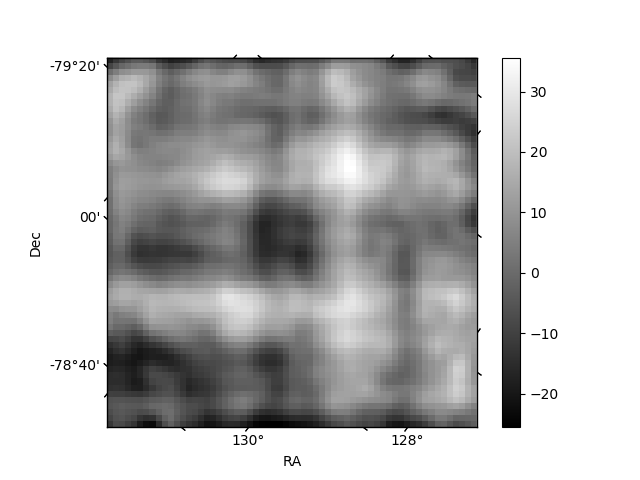
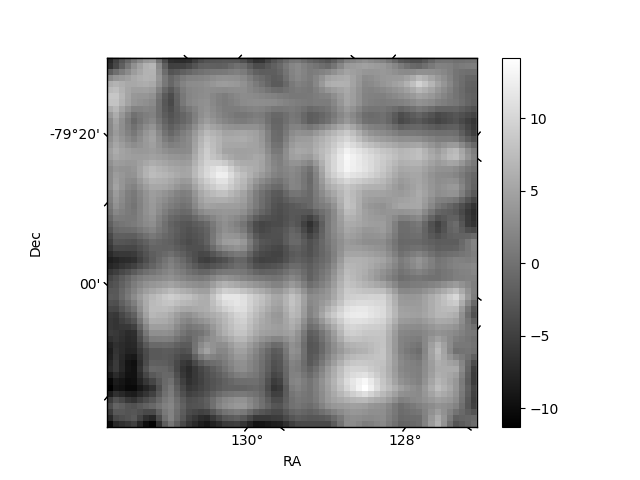
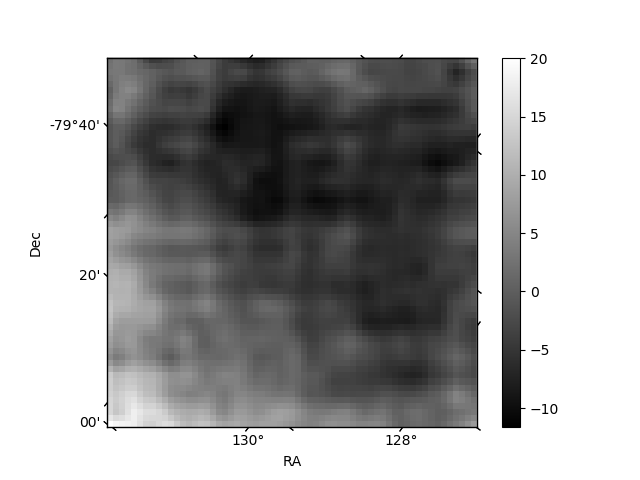
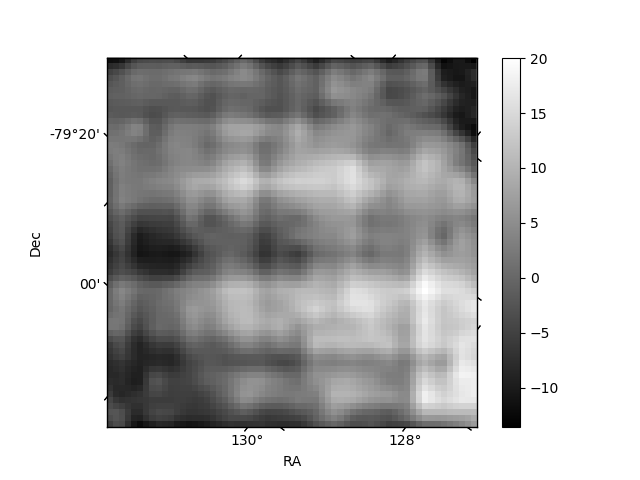
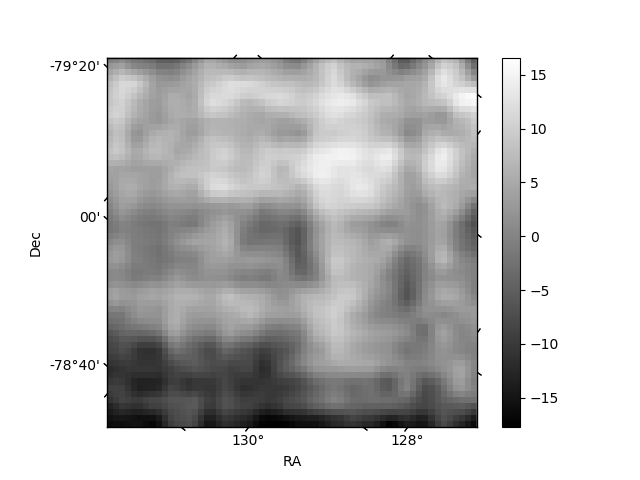
Histogram calculated using DETX and DETY for each event in the final _common_clean file
| Quadrant A | 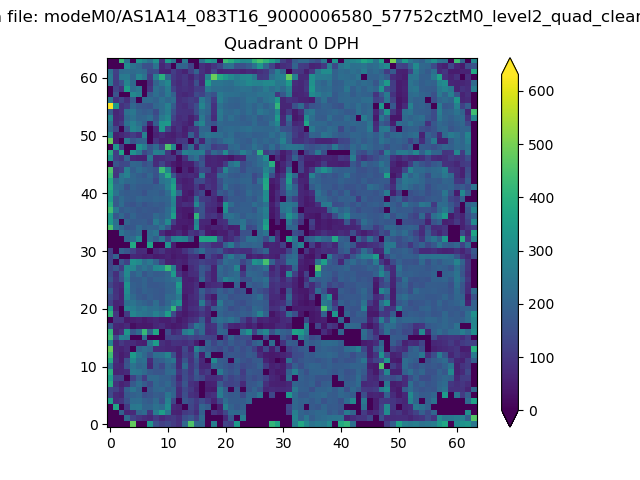 |
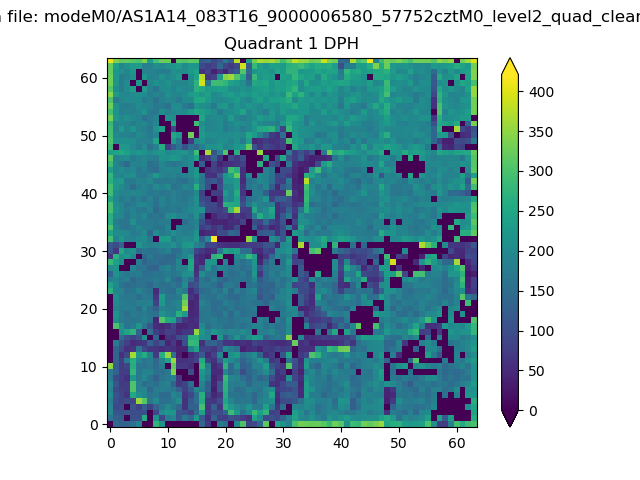 |
Quadrant B |
|---|---|---|---|
| Quadrant D | 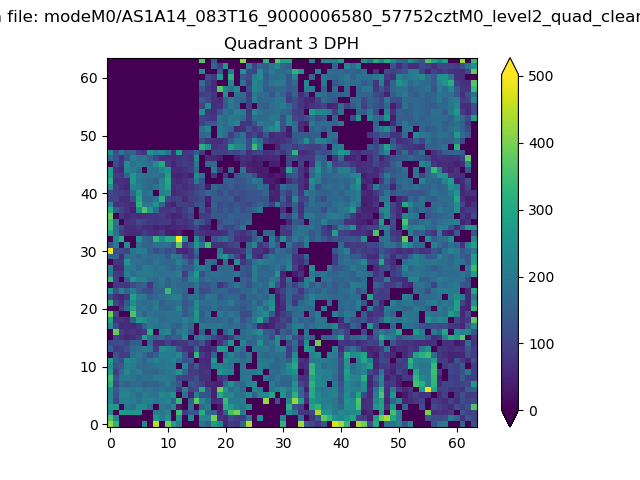 |
 |
Quadrant C |
| Plot type | Count rate plots | Images |
|---|---|---|
| Comparison with Poisson distribution Blue bars denote a histogram of data divided into 1 sec bins. Red curve is a Poisson curve with rate = median count rate of data. |
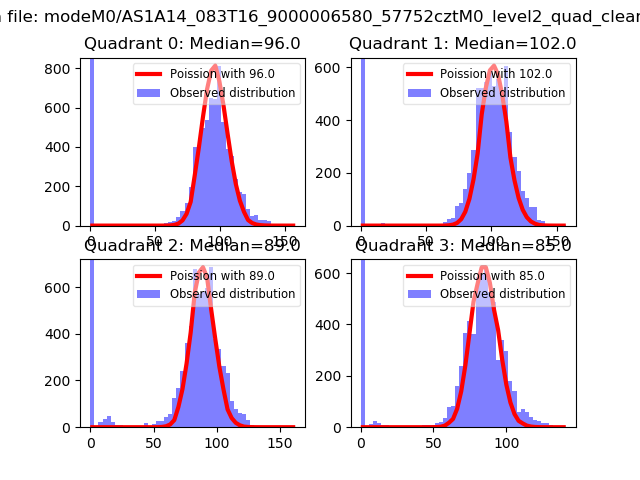 |
 |
| Quadrant-wise count rates Data is divided into 100 sec bins |
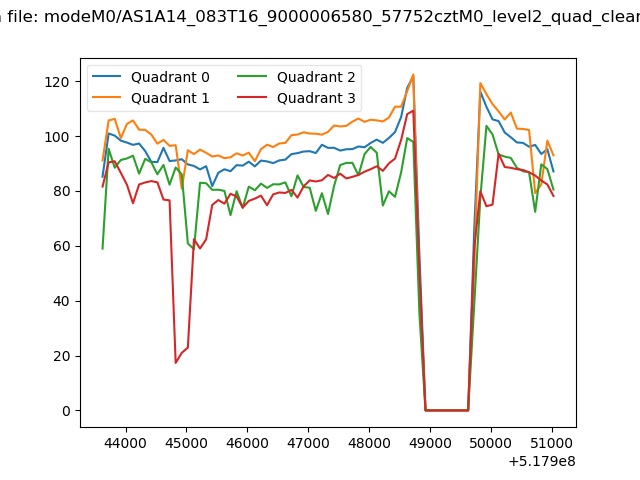 |
|
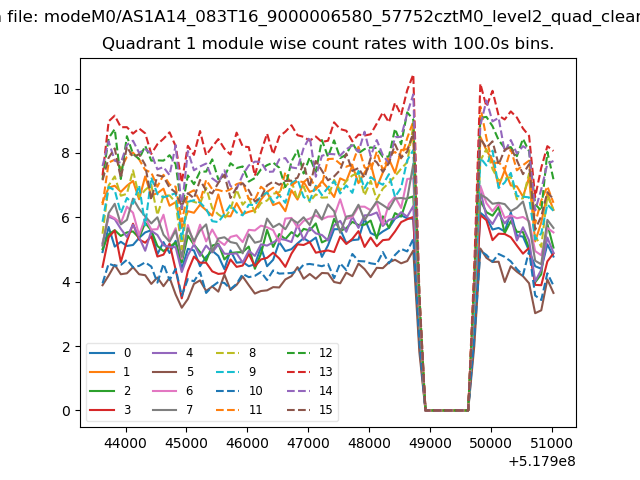
| Module-wise count rates for Quadrant A Data is divided into 100 sec bins |
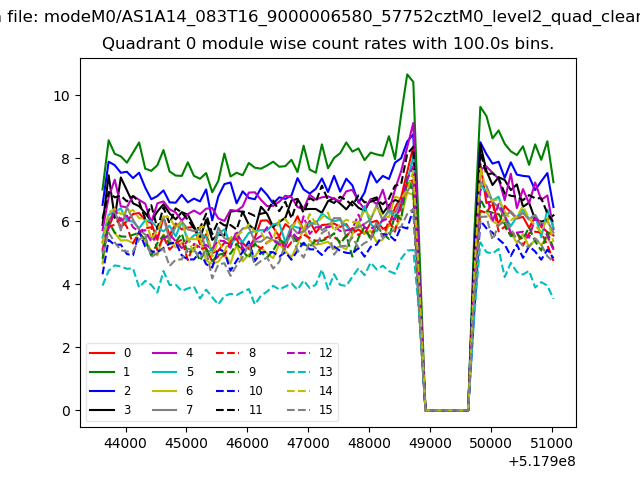 |
 |
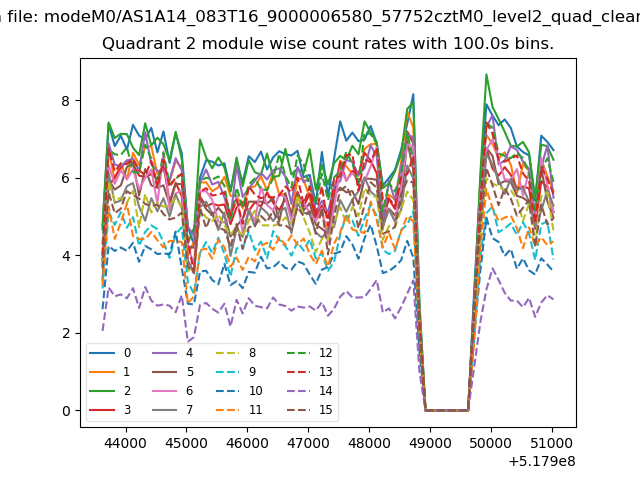
| Module-wise count rates for Quadrant B Data is divided into 100 sec bins |
 |
 |
| Module-wise count rates for Quadrant C Data is divided into 100 sec bins |
 |
 |
| Module-wise count rates for Quadrant D Data is divided into 100 sec bins |
 |
 |
| Parameter | Plot |
|---|---|
| CZT HV Monitor | 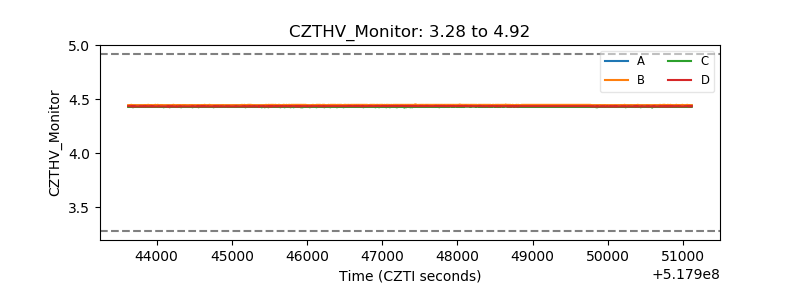 |
| D_VDD | 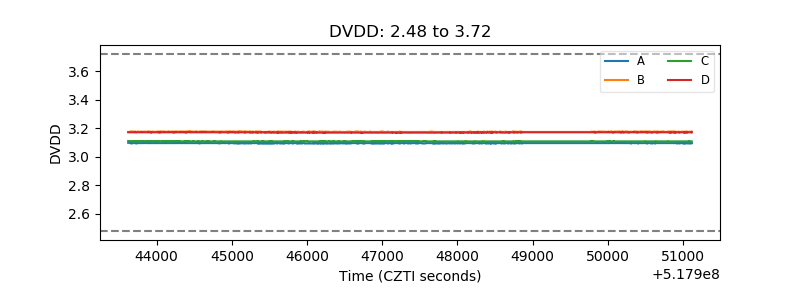 |
| Temperature 1 | 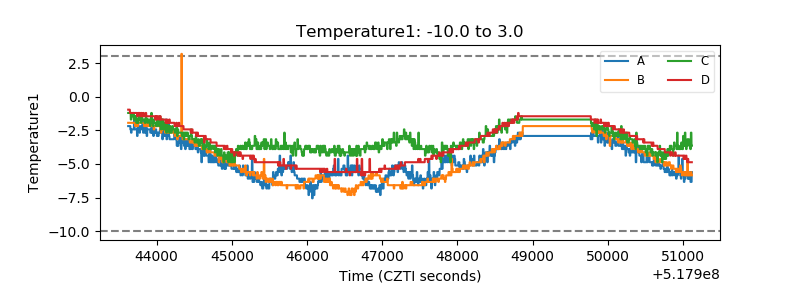 |
| Veto HV Monitor | 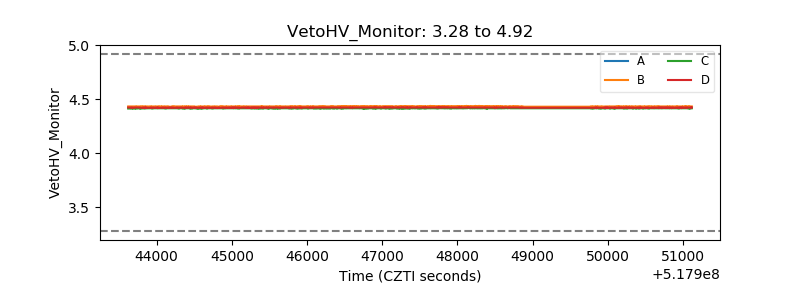 |
| Veto LLD | 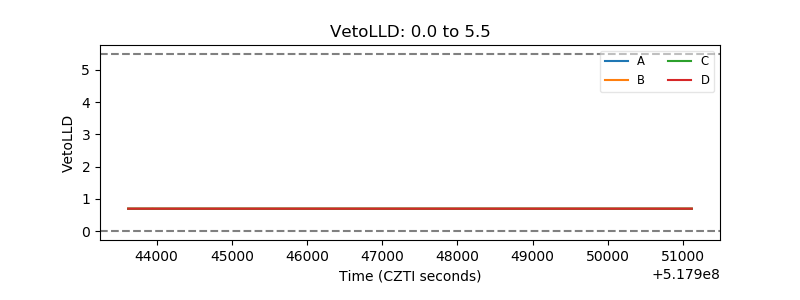 |
| Alpha Counter | 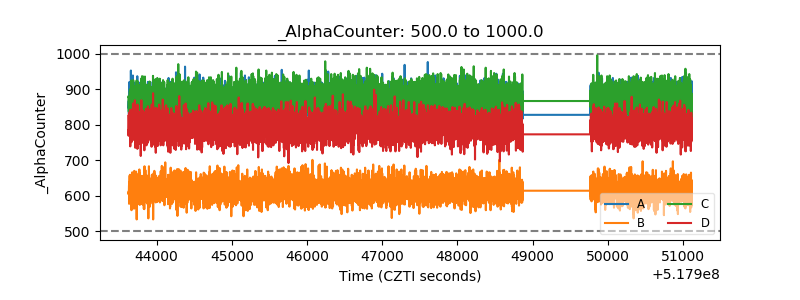 |
| _CPM_Rate | 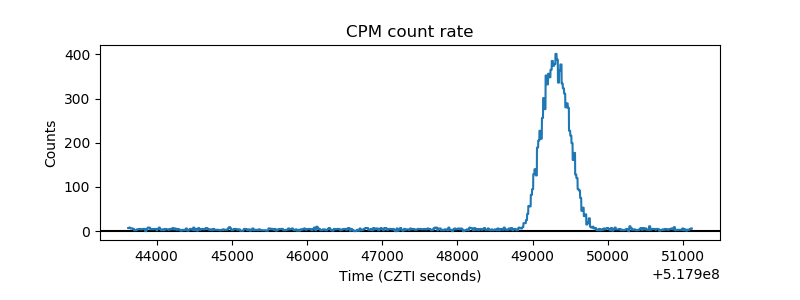 |
| CZT Counter | 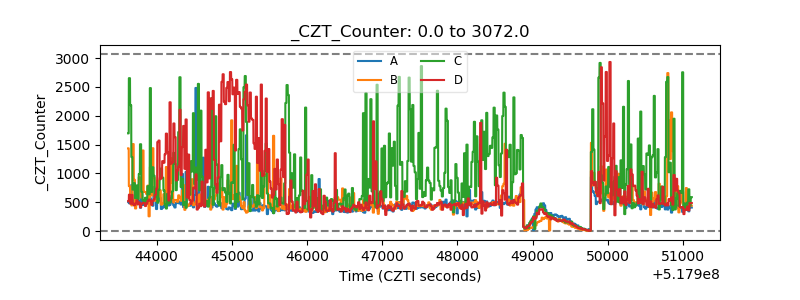 |
| +2.5 Volts monitor |  |
| +5 Volts monitor |  |
| _ROLL_ROT | 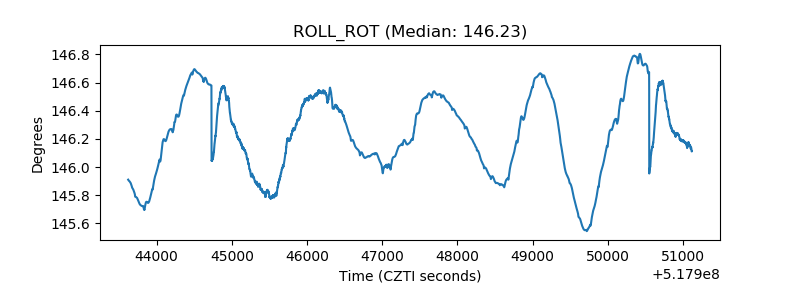 |
| _Roll_DEC | 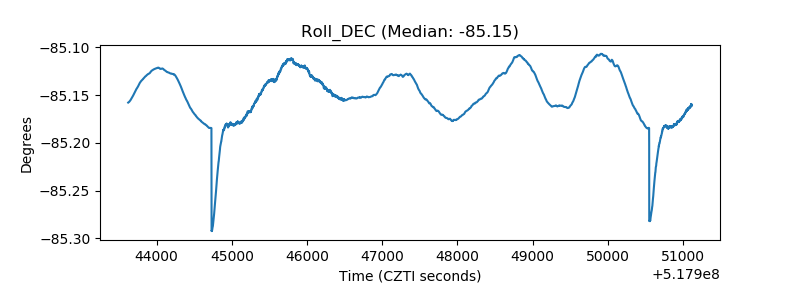 |
| _Roll_RA | 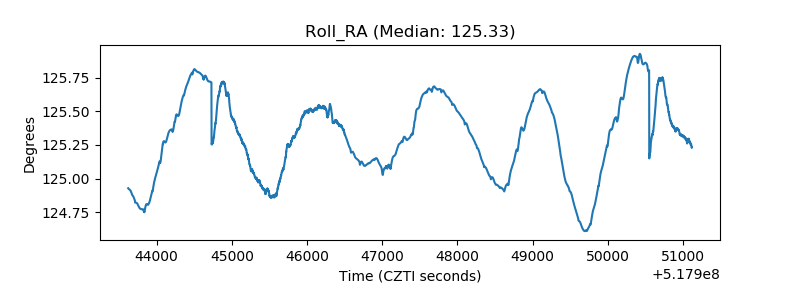 |
| Veto Counter | 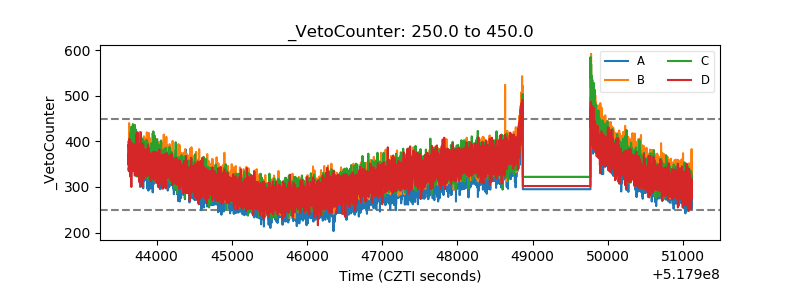 |