| Param | Original file | Final file |
|---|---|---|
| Filename | modeM0/AS1A14_083T16_9000006580_57754cztM0_level2.fits | modeM0/AS1A14_083T16_9000006580_57754cztM0_level2_quad_clean.evt |
| Size (bytes) | 479,862,720 | 94,916,160 |
| Size | 457.6 MB | 90.5 MB |
| Events in quadrant A | 2,968,396 | 643,294 |
| Events in quadrant B | 3,974,039 | 666,326 |
| Events in quadrant C | 6,411,512 | 540,769 |
| Events in quadrant D | 3,897,459 | 564,393 |
| Mode SS | |||
|---|---|---|---|
| Quadrant | BADHDUFLAG | Total packets | Discarded packets |
| A | 0 | 134 | 0 |
| B | 0 | 134 | 0 |
| C | 0 | 134 | 2 |
| D | 0 | 134 | 0 |
| Mode M0 | |||
|---|---|---|---|
| Quadrant | BADHDUFLAG | Total packets | Discarded packets |
| A | 0 | 13844 | 41 |
| B | 0 | 16367 | 71 |
| C | 0 | 23721 | 113 |
| D | 0 | 16358 | 35 |
| Mode M9 | |||
|---|---|---|---|
| Quadrant | BADHDUFLAG | Total packets | Discarded packets |
| A | 0 | 10 | 0 |
| B | 0 | 10 | 0 |
| C | 0 | 10 | 0 |
| D | 0 | 10 | 0 |
| Quadrant | Total seconds | Saturated seconds | Saturation percentage |
|---|---|---|---|
| A | 6584 | 22 | 0.334143% |
| B | 6582 | 215 | 3.266484% |
| C | 6579 | 837 | 12.722298% |
| D | 6589 | 164 | 2.488997% |
Noise dominated data is calculated using 1-second bins in cleaned event files. If a bin has >2000 counts, and if more than 50% of those come from <1% of pixels, then it is considered to be noise-dominated and hence unusable.
| Quadrant | # 1 sec bins | Bins with >0 counts | Bins with >2000 counts | High rate bins dominated by noise | Noise dominated (total time) | Noise dominated (detector-on time) | Marked lightcurve |
|---|---|---|---|---|---|---|---|
| A | 7624 | 6598 | 1 | 1 | 0.01% | 0.02% | 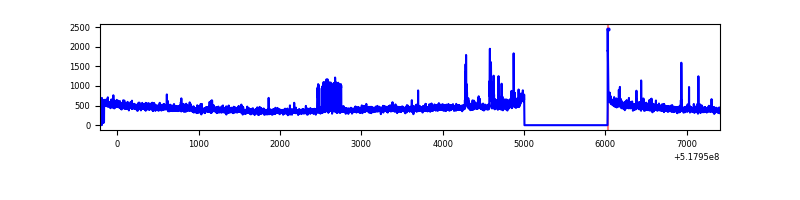 |
| B | 7625 | 6597 | 99 | 99 | 1.30% | 1.50% | 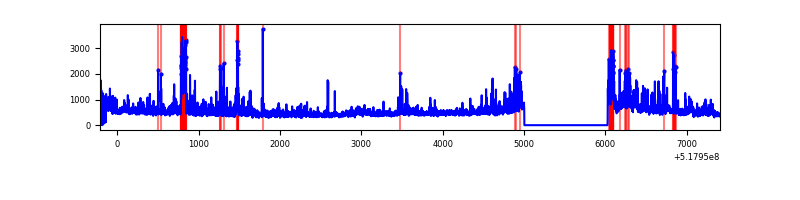 |
| C | 7625 | 6592 | 703 | 703 | 9.22% | 10.66% | 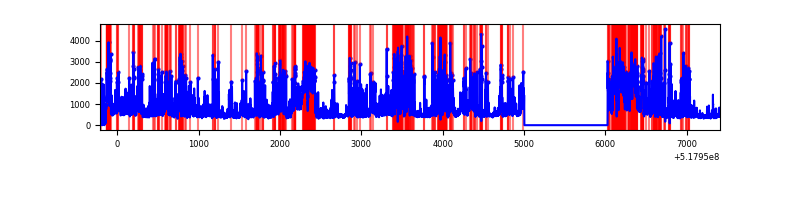 |
| D | 7625 | 6597 | 152 | 152 | 1.99% | 2.30% | 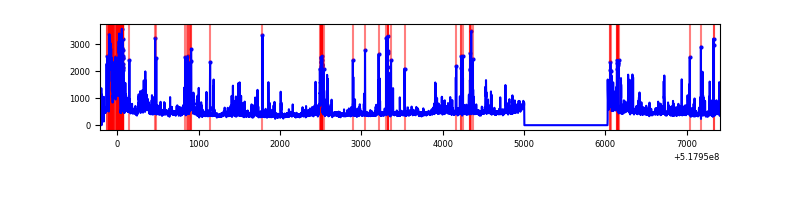 |
Top three noisy pixels from each quadrant. If the there are fewer than three noisy pixels in the level2.evt file, extra rows are filled as -1
| Pixel properties | Quadrant properties | ||||||
|---|---|---|---|---|---|---|---|
| Quadrant | DetID | PixID | Counts | Sigma | Mean | Median | Sigma |
| A | 0 | 12 | 83600 | 476.04 | 702 | 683 | 174.2 |
| A | 3 | 61 | 65959 | 374.76 | 702 | 683 | 174.2 |
| A | 7 | 160 | 42426 | 239.65 | 702 | 683 | 174.2 |
| B | 8 | 128 | 291016 | 1976.27 | 687 | 662 | 146.9 |
| B | 4 | 80 | 275239 | 1868.88 | 687 | 662 | 146.9 |
| B | 4 | 171 | 202869 | 1376.3 | 687 | 662 | 146.9 |
| C | 15 | 224 | 2311065 | 13127.65 | 640 | 637 | 176.0 |
| C | 9 | 38 | 1107782 | 6290.7 | 640 | 637 | 176.0 |
| C | 14 | 254 | 403933 | 2291.49 | 640 | 637 | 176.0 |
| D | 2 | 153 | 683466 | 3593.33 | 667 | 636 | 190.0 |
| D | 2 | 249 | 97224 | 508.29 | 667 | 636 | 190.0 |
| D | 3 | 12 | 95242 | 497.86 | 667 | 636 | 190.0 |
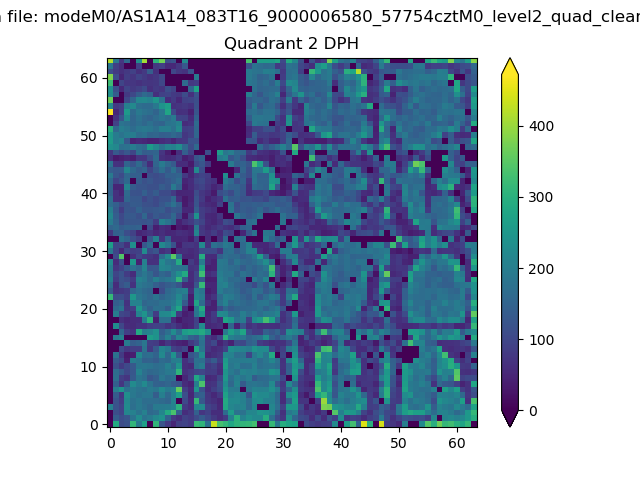
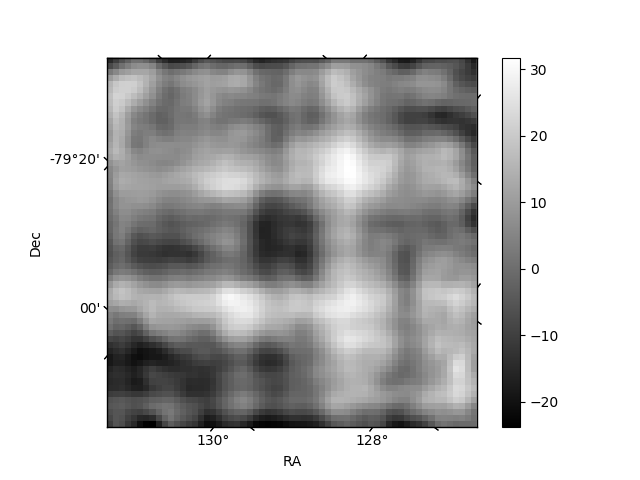
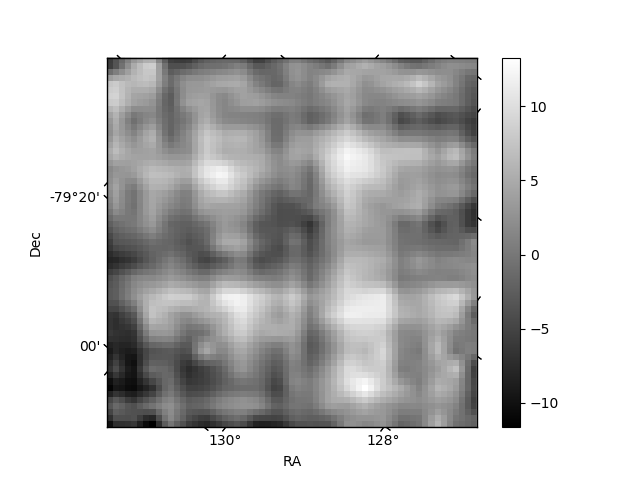
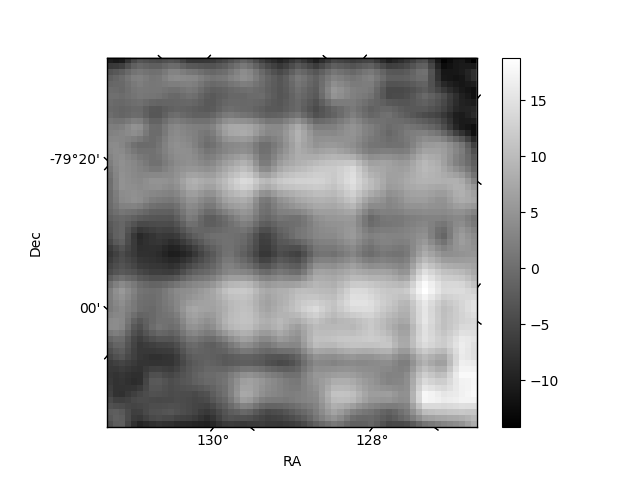
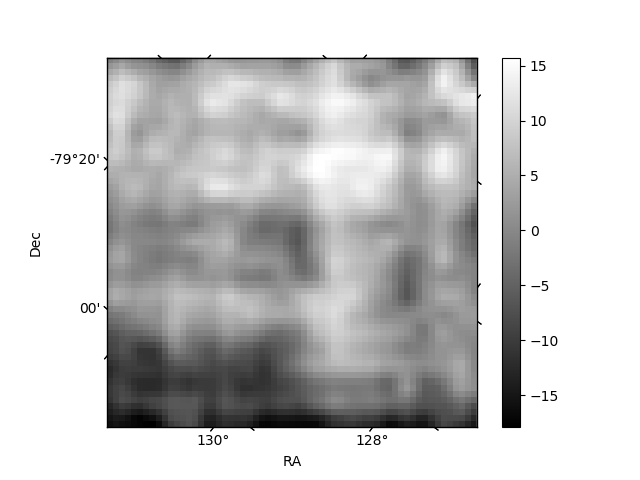
Histogram calculated using DETX and DETY for each event in the final _common_clean file
| Quadrant A | 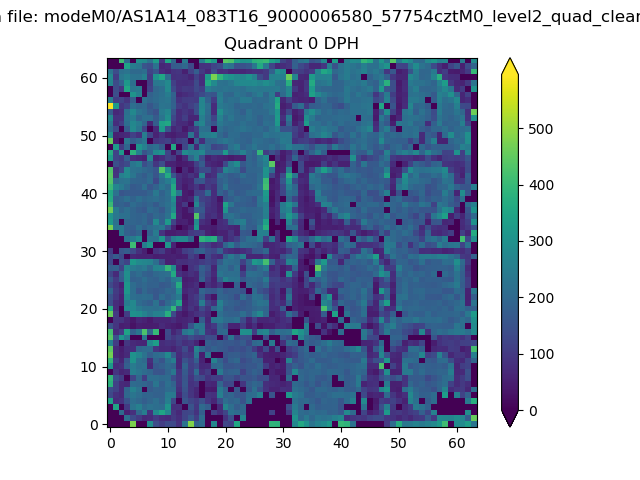 |
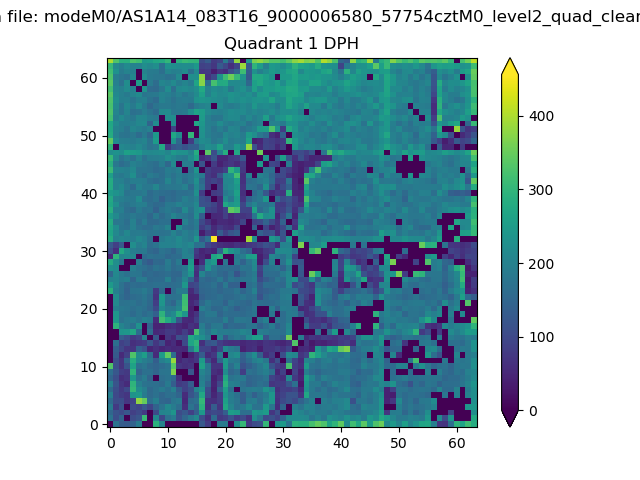 |
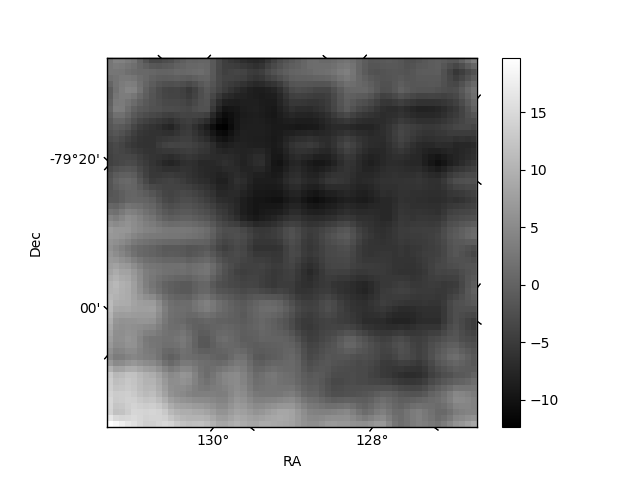
Quadrant B |
|---|---|---|---|
| Quadrant D | 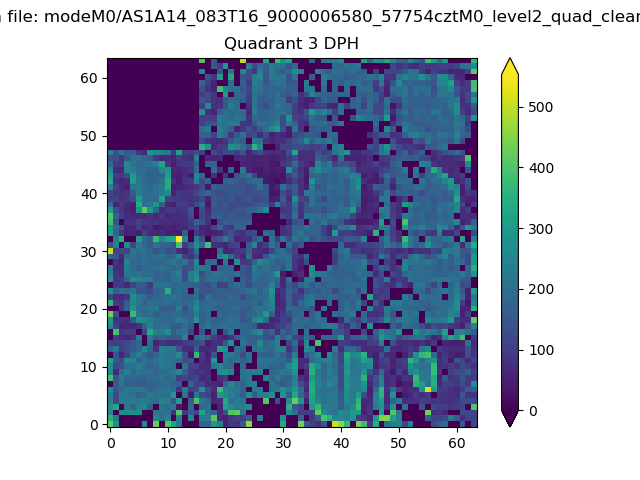 |
 |
Quadrant C |
| Plot type | Count rate plots | Images |
|---|---|---|
| Comparison with Poisson distribution Blue bars denote a histogram of data divided into 1 sec bins. Red curve is a Poisson curve with rate = median count rate of data. |
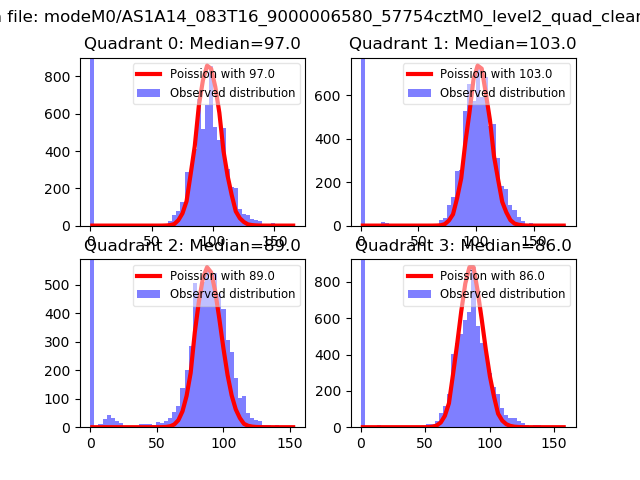 |
 |
| Quadrant-wise count rates Data is divided into 100 sec bins |
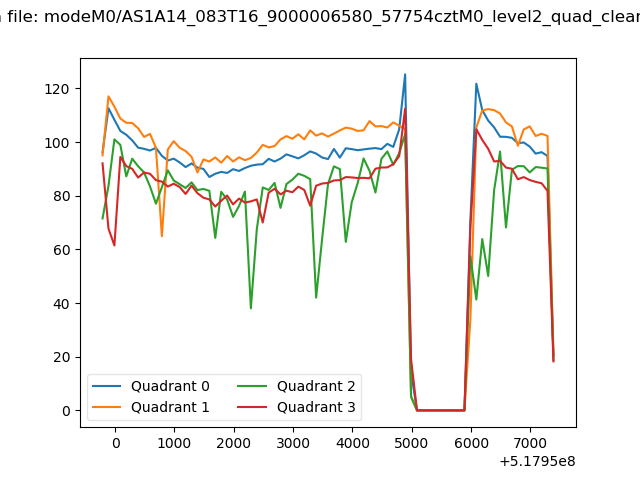 |
|
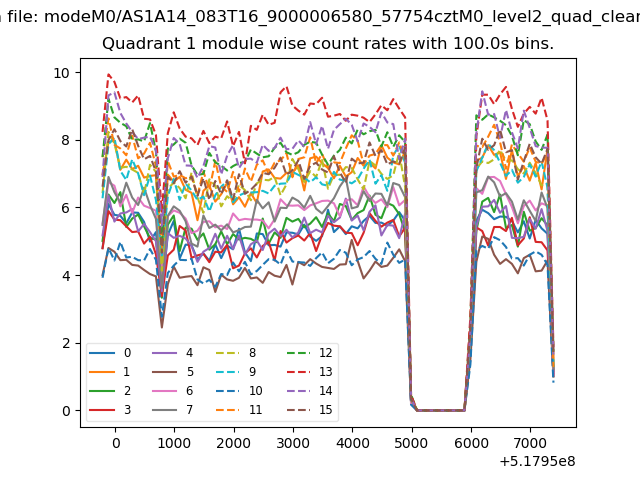
| Module-wise count rates for Quadrant A Data is divided into 100 sec bins |
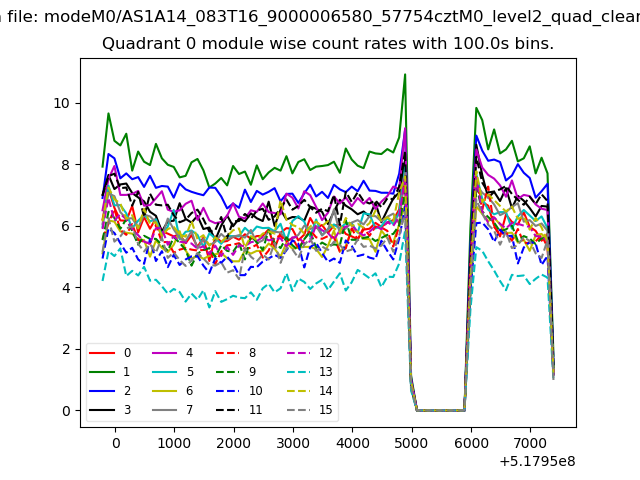 |
 |
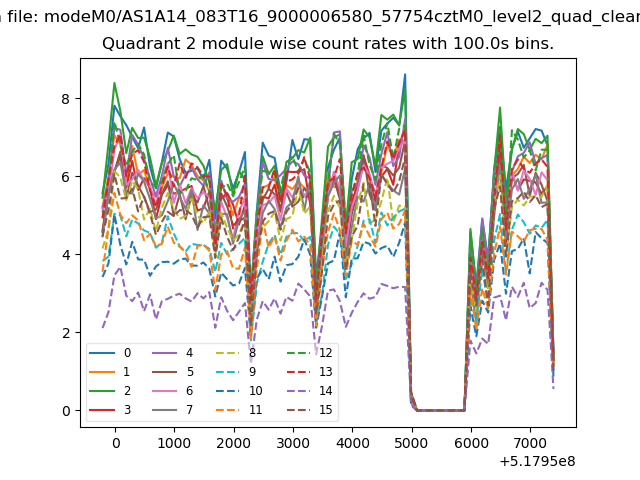
| Module-wise count rates for Quadrant B Data is divided into 100 sec bins |
 |
 |
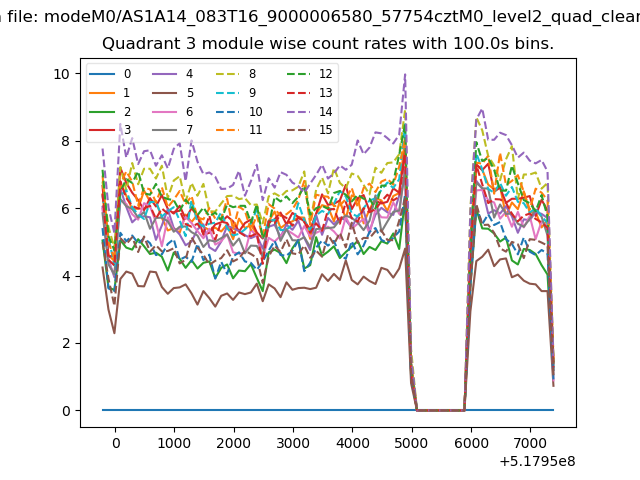
| Module-wise count rates for Quadrant C Data is divided into 100 sec bins |
 |
 |
| Module-wise count rates for Quadrant D Data is divided into 100 sec bins |
 |
 |
| Parameter | Plot |
|---|---|
| CZT HV Monitor | 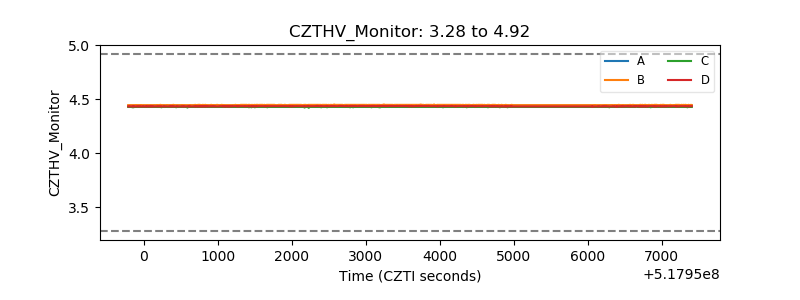 |
| D_VDD | 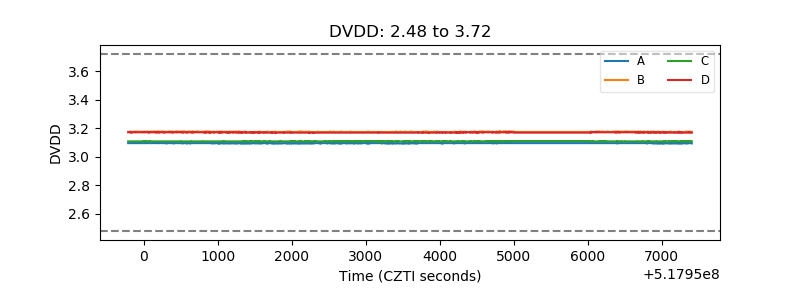 |
| Temperature 1 | 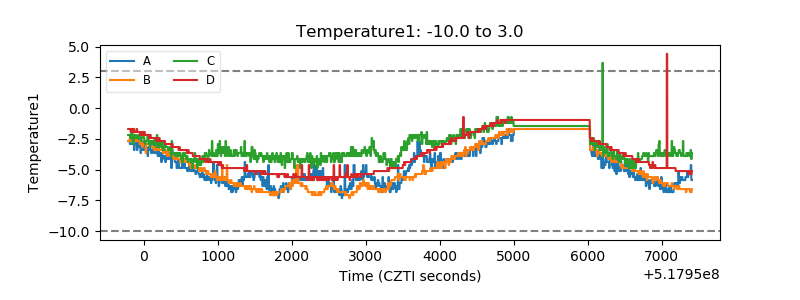 |
| Veto HV Monitor | 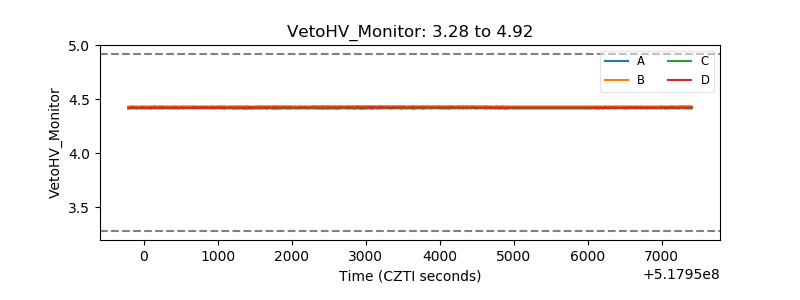 |
| Veto LLD | 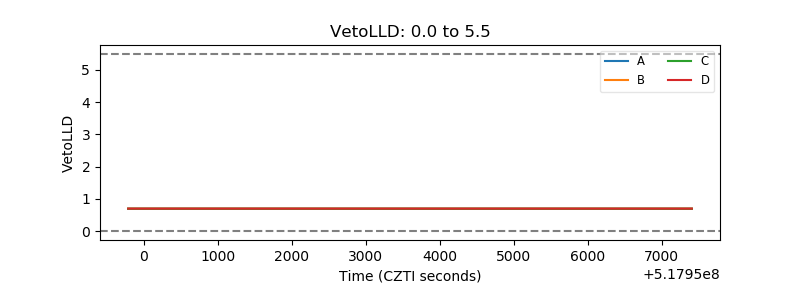 |
| Alpha Counter | 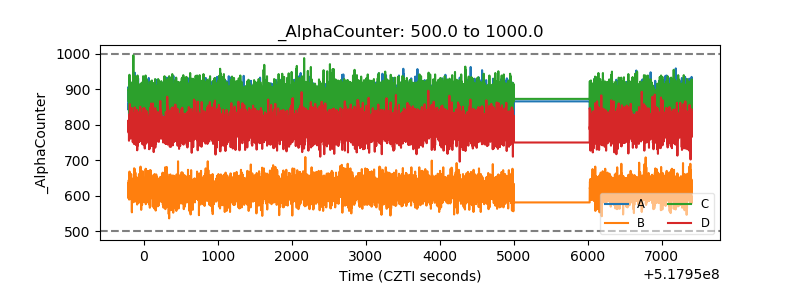 |
| _CPM_Rate | 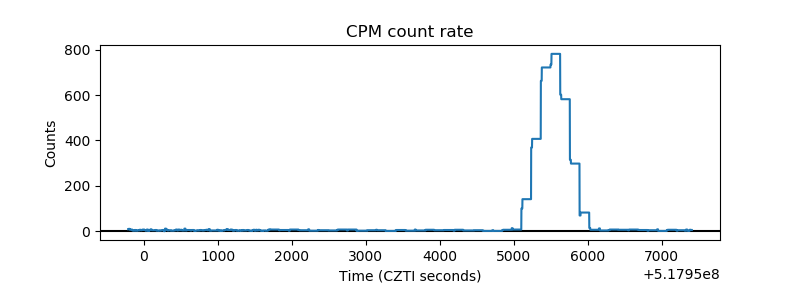 |
| CZT Counter | 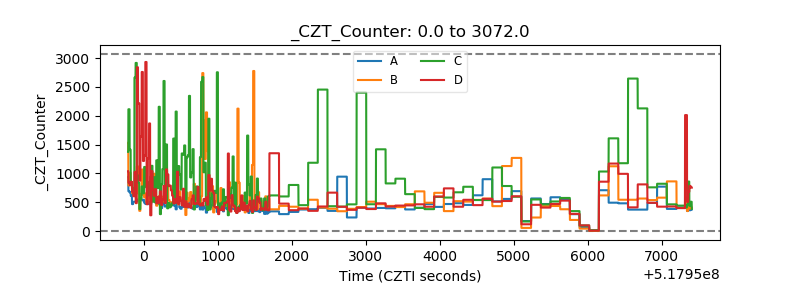 |
| +2.5 Volts monitor |  |
| +5 Volts monitor | 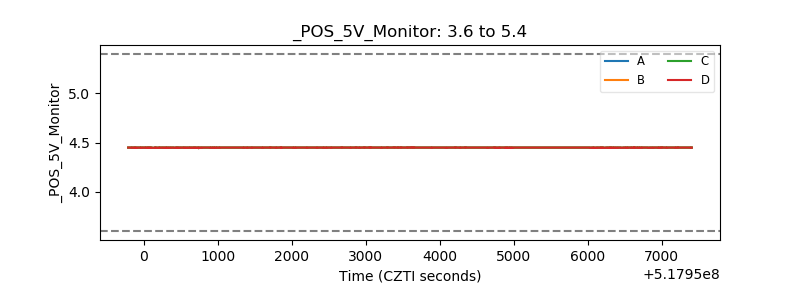 |
| _ROLL_ROT | 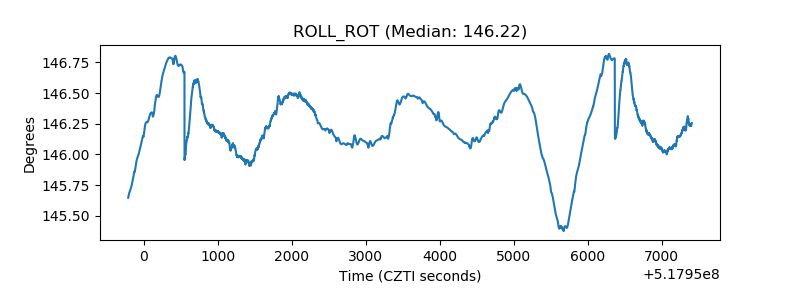 |
| _Roll_DEC | 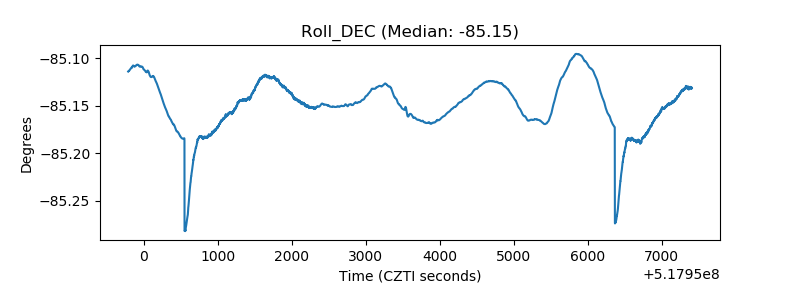 |
| _Roll_RA | 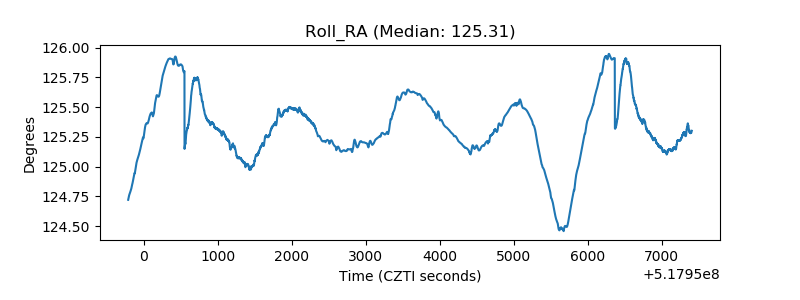 |
| Veto Counter | 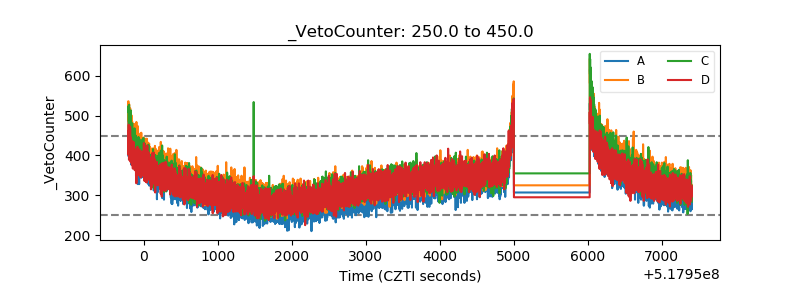 |