| Param | Original file | Final file |
|---|---|---|
| Filename | modeM0/AS1A14_083T16_9000006580_57756cztM0_level2.fits | modeM0/AS1A14_083T16_9000006580_57756cztM0_level2_quad_clean.evt |
| Size (bytes) | 433,117,440 | 95,869,440 |
| Size | 413.1 MB | 91.4 MB |
| Events in quadrant A | 3,438,632 | 629,508 |
| Events in quadrant B | 4,138,201 | 663,645 |
| Events in quadrant C | 4,796,698 | 595,649 |
| Events in quadrant D | 3,165,783 | 571,668 |
| Mode SS | |||
|---|---|---|---|
| Quadrant | BADHDUFLAG | Total packets | Discarded packets |
| A | 0 | 128 | 0 |
| B | 0 | 128 | 0 |
| C | 0 | 128 | 0 |
| D | 0 | 128 | 0 |
| Mode M0 | |||
|---|---|---|---|
| Quadrant | BADHDUFLAG | Total packets | Discarded packets |
| A | 0 | 14496 | 2 |
| B | 0 | 16598 | 2 |
| C | 0 | 18632 | 2 |
| D | 0 | 13922 | 2 |
| Mode M9 | |||
|---|---|---|---|
| Quadrant | BADHDUFLAG | Total packets | Discarded packets |
| A | 0 | 20 | 0 |
| B | 0 | 21 | 0 |
| C | 0 | 21 | 0 |
| D | 0 | 21 | 0 |
| Quadrant | Total seconds | Saturated seconds | Saturation percentage |
|---|---|---|---|
| A | 6343 | 160 | 2.522466% |
| B | 6343 | 341 | 5.376005% |
| C | 6343 | 243 | 3.830995% |
| D | 6343 | 37 | 0.583320% |
Noise dominated data is calculated using 1-second bins in cleaned event files. If a bin has >2000 counts, and if more than 50% of those come from <1% of pixels, then it is considered to be noise-dominated and hence unusable.
| Quadrant | # 1 sec bins | Bins with >0 counts | Bins with >2000 counts | High rate bins dominated by noise | Noise dominated (total time) | Noise dominated (detector-on time) | Marked lightcurve |
|---|---|---|---|---|---|---|---|
| A | 7593 | 6344 | 111 | 111 | 1.46% | 1.75% | 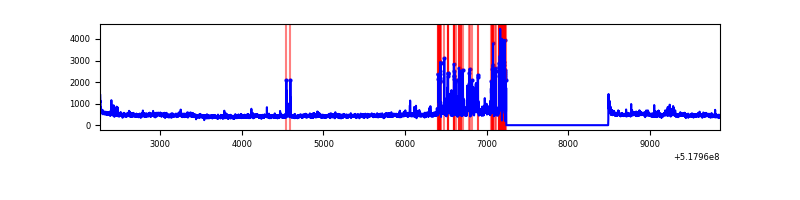 |
| B | 7593 | 6344 | 159 | 159 | 2.09% | 2.51% | 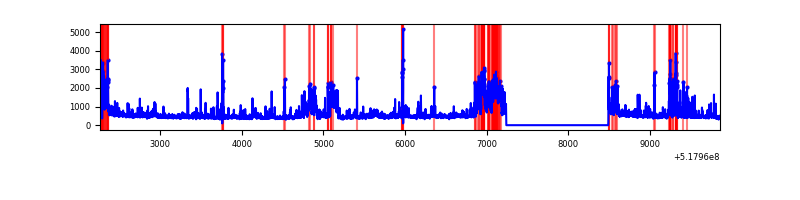 |
| C | 7593 | 6344 | 220 | 220 | 2.90% | 3.47% | 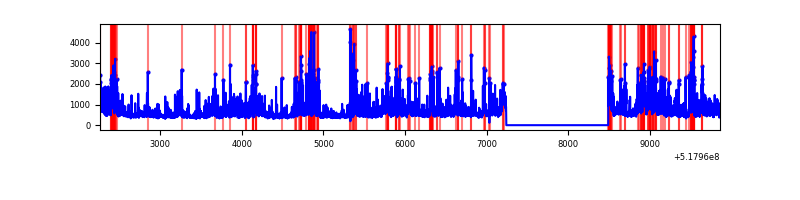 |
| D | 7593 | 6344 | 27 | 27 | 0.36% | 0.43% | 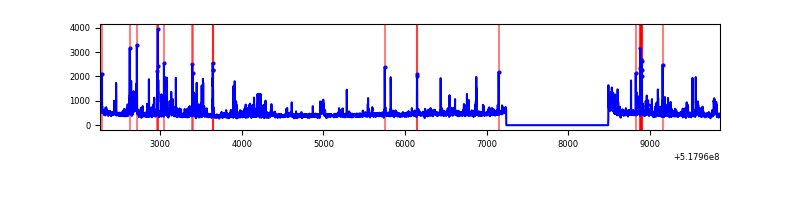 |
Top three noisy pixels from each quadrant. If the there are fewer than three noisy pixels in the level2.evt file, extra rows are filled as -1
| Pixel properties | Quadrant properties | ||||||
|---|---|---|---|---|---|---|---|
| Quadrant | DetID | PixID | Counts | Sigma | Mean | Median | Sigma |
| A | 13 | 248 | 499057 | 2963.85 | 674 | 657 | 168.2 |
| A | 3 | 128 | 200339 | 1187.46 | 674 | 657 | 168.2 |
| A | 3 | 61 | 55219 | 324.47 | 674 | 657 | 168.2 |
| B | 10 | 16 | 523800 | 3735.23 | 668 | 645 | 140.1 |
| B | 5 | 185 | 346895 | 2472.16 | 668 | 645 | 140.1 |
| B | 4 | 158 | 200016 | 1423.47 | 668 | 645 | 140.1 |
| C | 15 | 224 | 1168265 | 6514.59 | 657 | 651 | 179.2 |
| C | 9 | 38 | 764390 | 4261.21 | 657 | 651 | 179.2 |
| C | 14 | 254 | 163483 | 908.51 | 657 | 651 | 179.2 |
| D | 3 | 12 | 153704 | 820.35 | 656 | 625 | 186.6 |
| D | 2 | 31 | 82295 | 437.67 | 656 | 625 | 186.6 |
| D | 8 | 240 | 72761 | 386.57 | 656 | 625 | 186.6 |
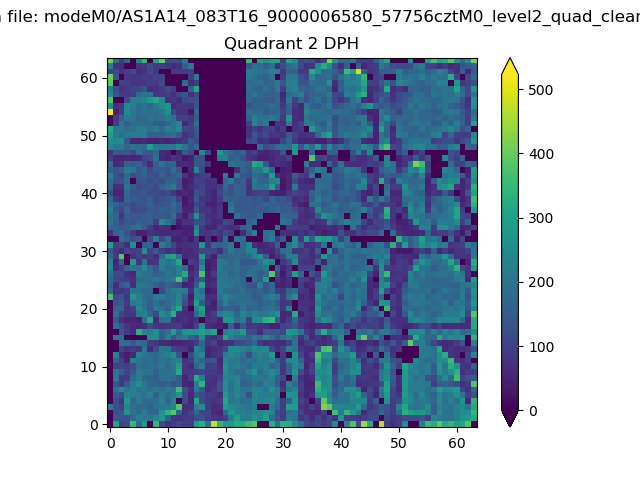
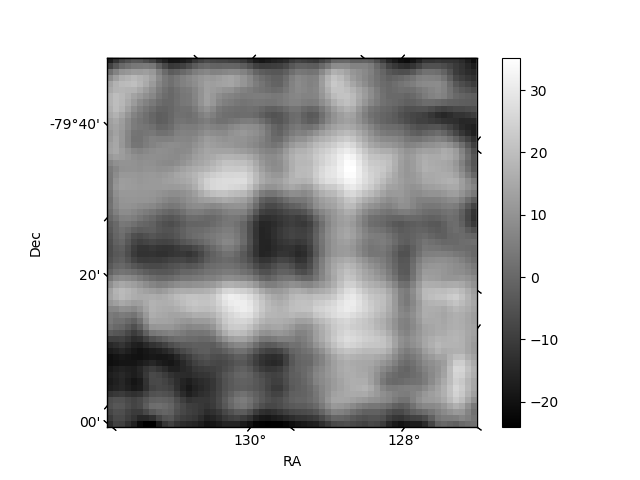
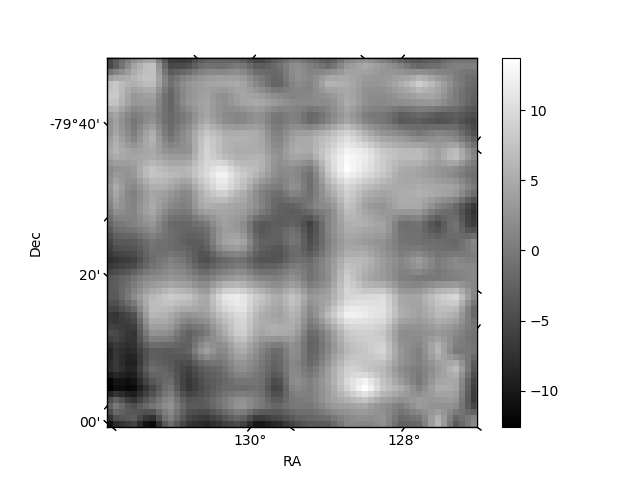
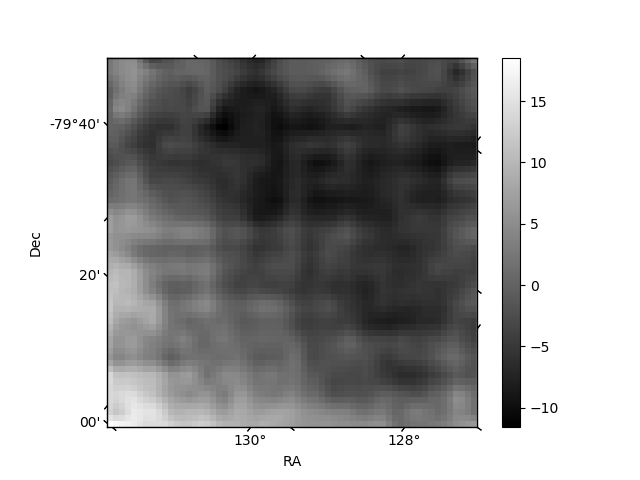
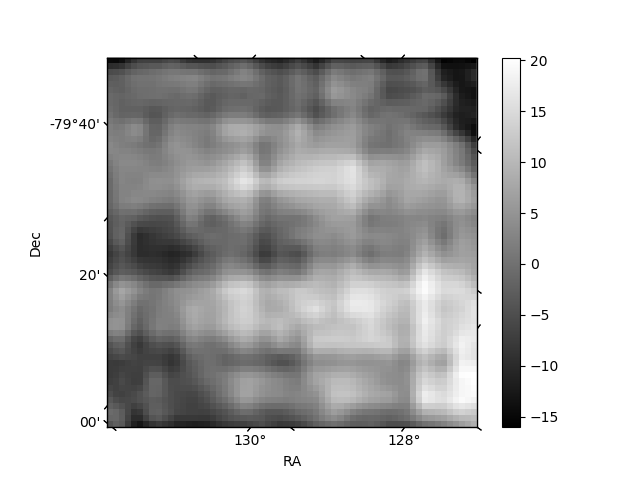
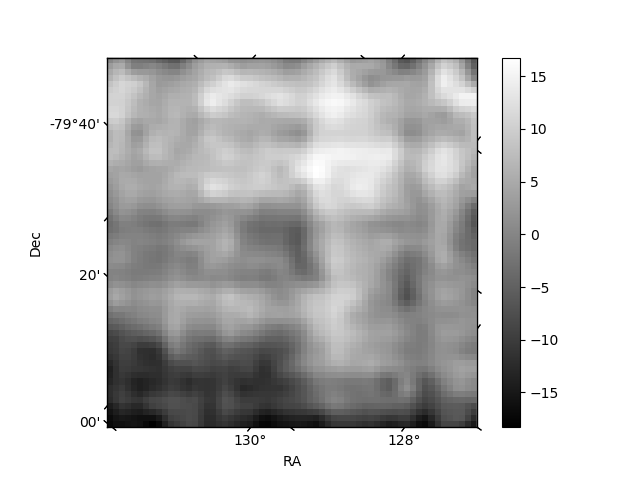
Histogram calculated using DETX and DETY for each event in the final _common_clean file
| Quadrant A | 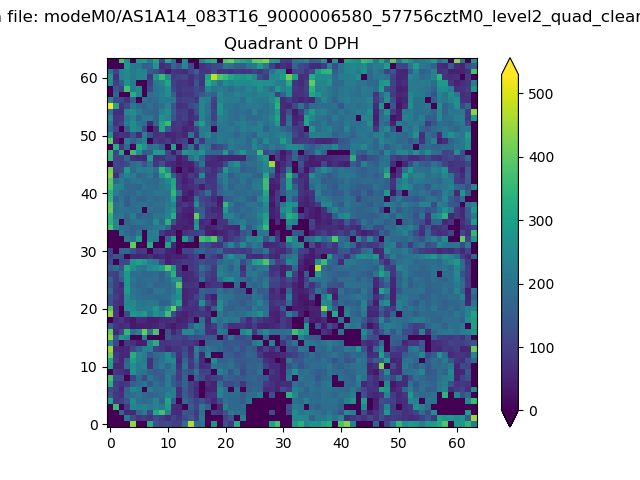 |
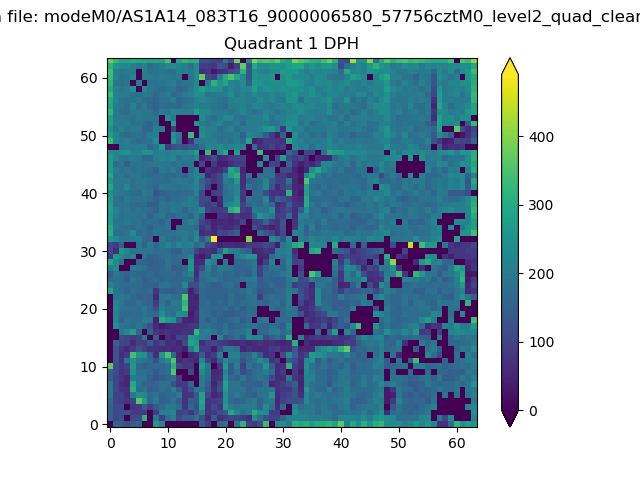 |
Quadrant B |
|---|---|---|---|
| Quadrant D | 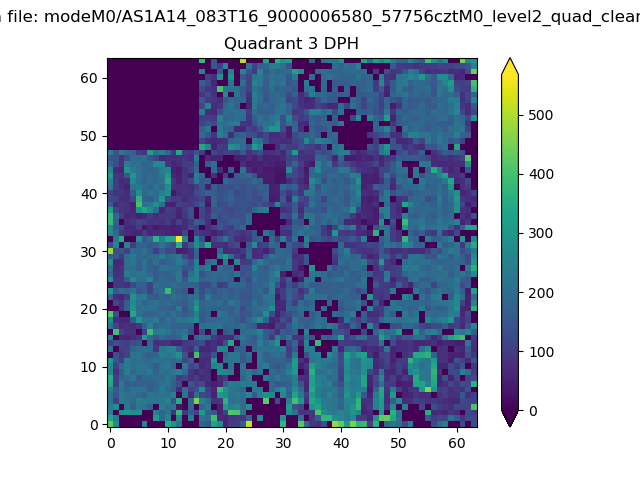 |
 |
Quadrant C |
| Plot type | Count rate plots | Images |
|---|---|---|
| Comparison with Poisson distribution Blue bars denote a histogram of data divided into 1 sec bins. Red curve is a Poisson curve with rate = median count rate of data. |
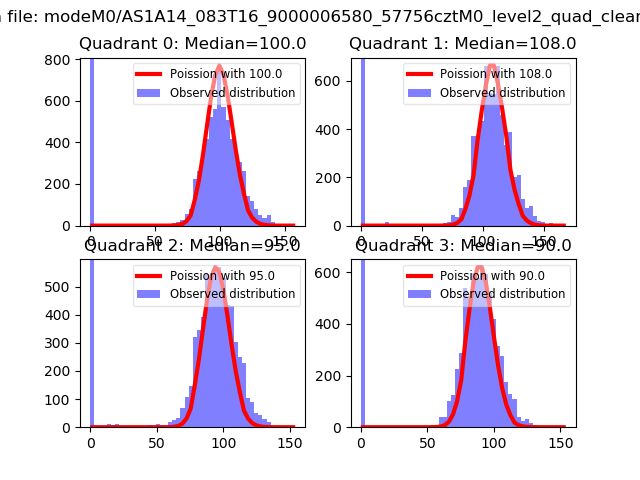 |
 |
| Quadrant-wise count rates Data is divided into 100 sec bins |
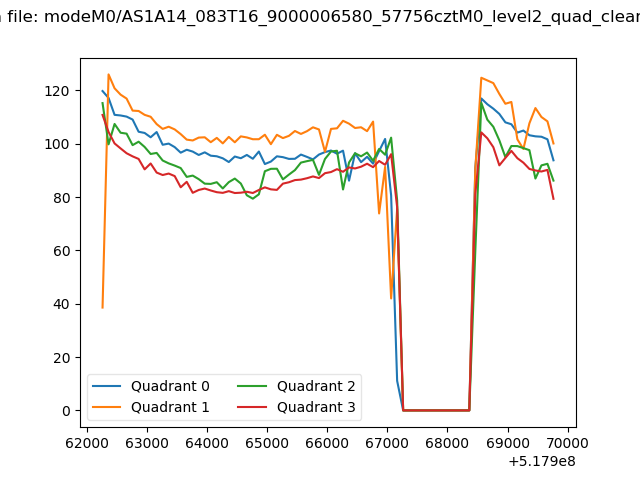 |
|
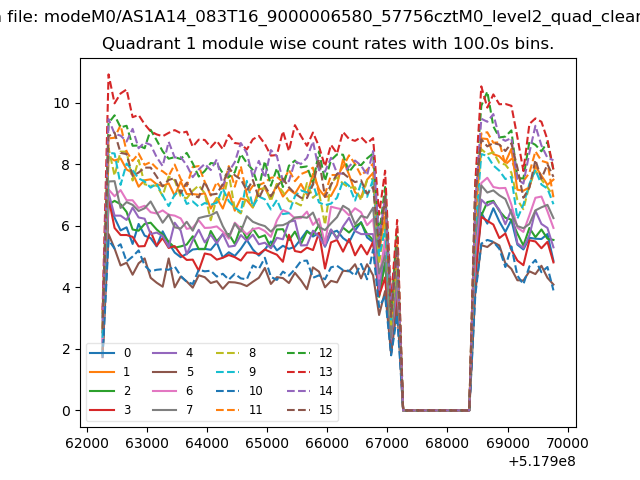
| Module-wise count rates for Quadrant A Data is divided into 100 sec bins |
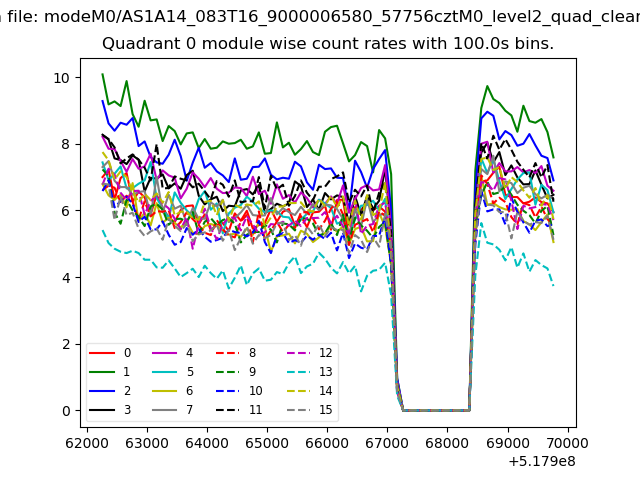 |
 |
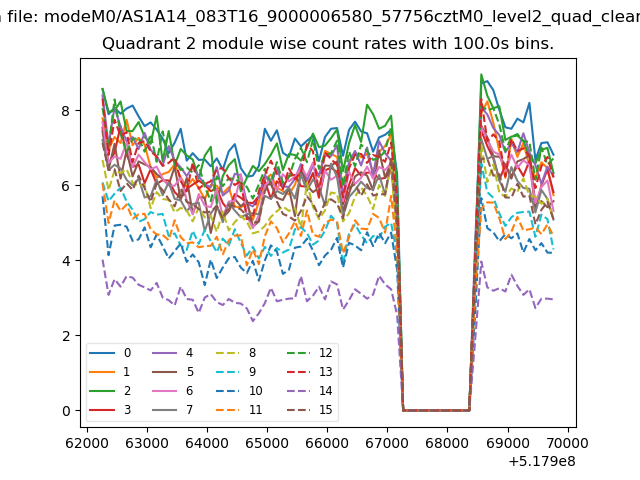
| Module-wise count rates for Quadrant B Data is divided into 100 sec bins |
 |
 |
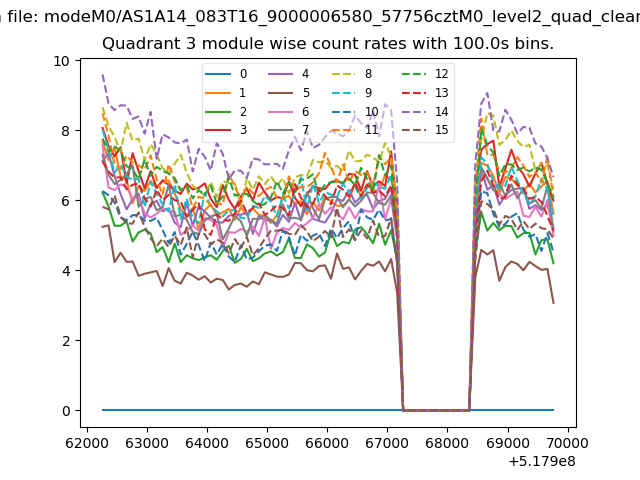
| Module-wise count rates for Quadrant C Data is divided into 100 sec bins |
 |
 |
| Module-wise count rates for Quadrant D Data is divided into 100 sec bins |
 |
 |
| Parameter | Plot |
|---|---|
| CZT HV Monitor | 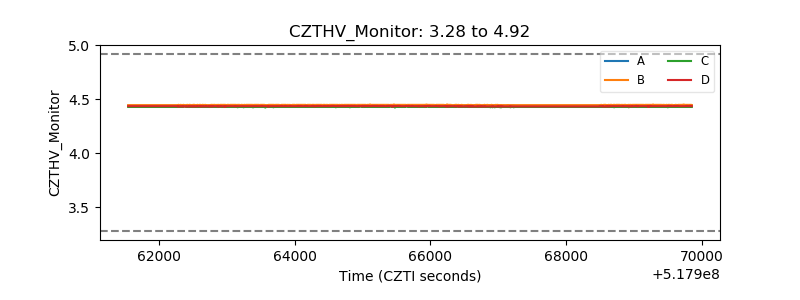 |
| D_VDD | 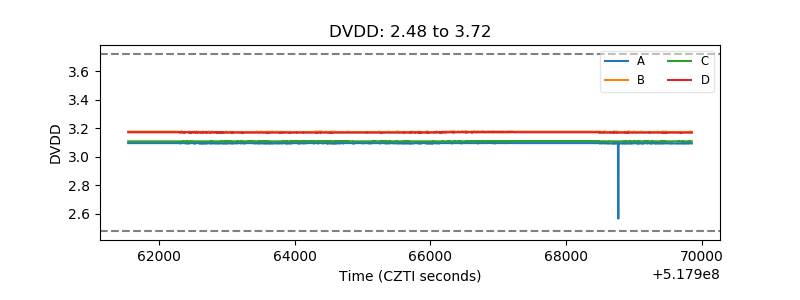 |
| Temperature 1 | 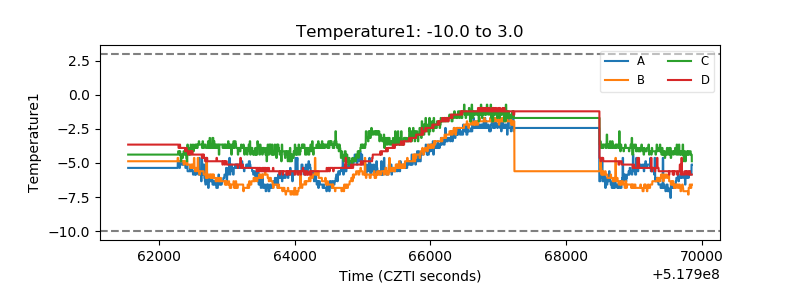 |
| Veto HV Monitor | 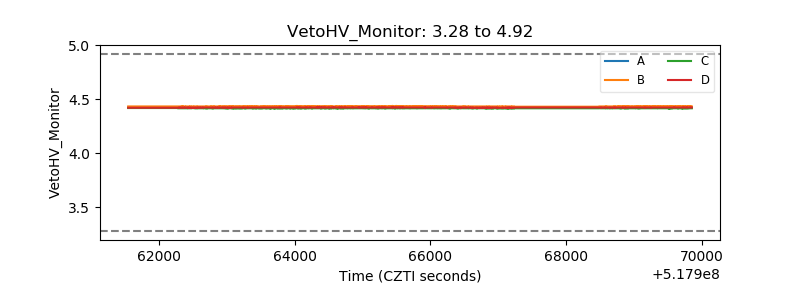 |
| Veto LLD | 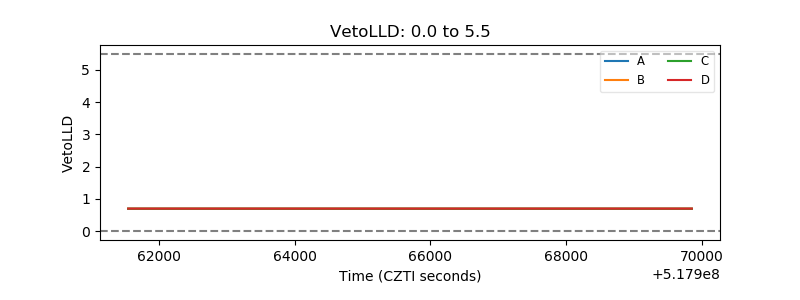 |
| Alpha Counter | 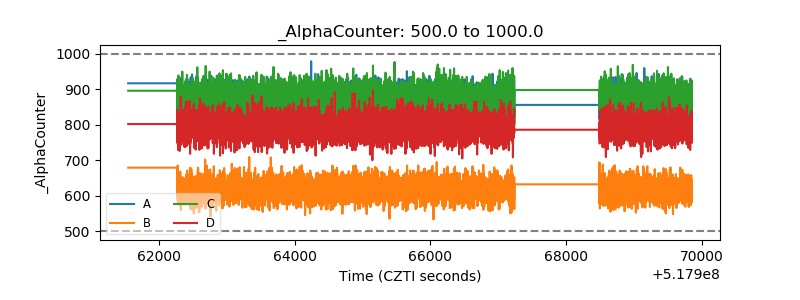 |
| _CPM_Rate | 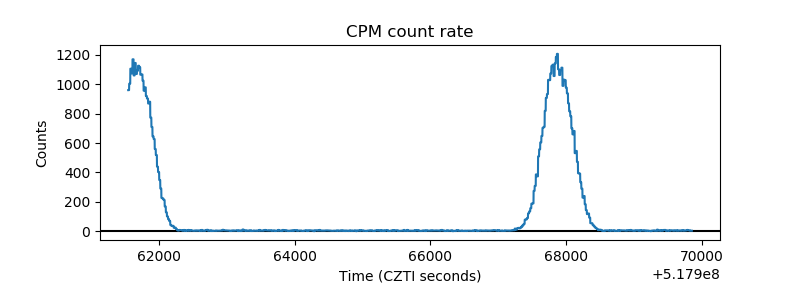 |
| CZT Counter | 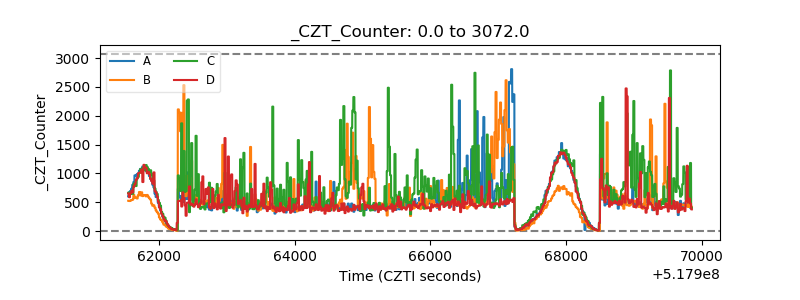 |
| +2.5 Volts monitor | 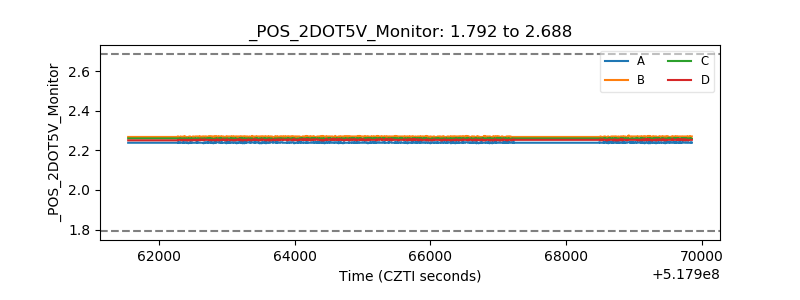 |
| +5 Volts monitor | 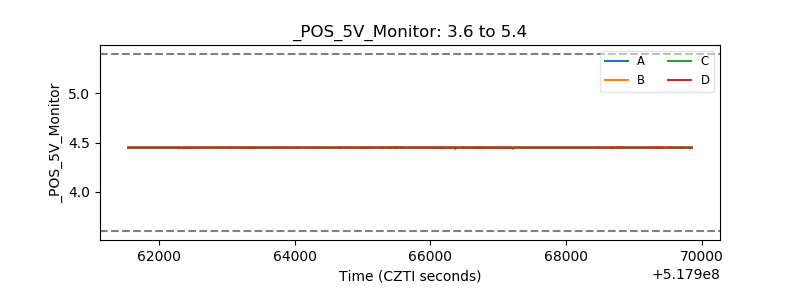 |
| _ROLL_ROT | 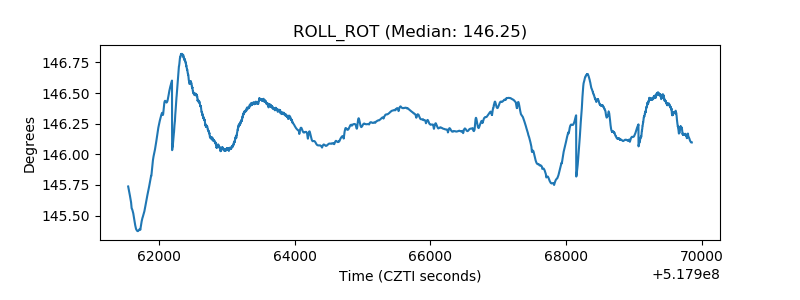 |
| _Roll_DEC | 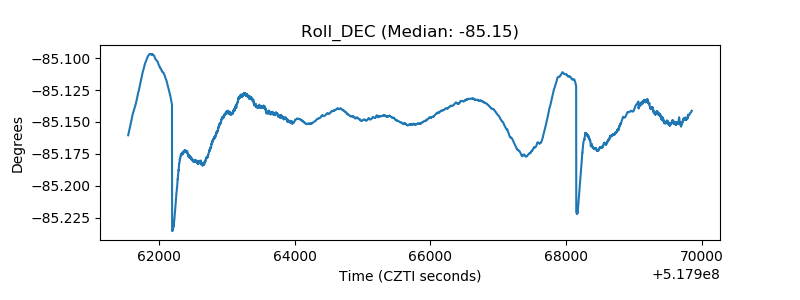 |
| _Roll_RA | 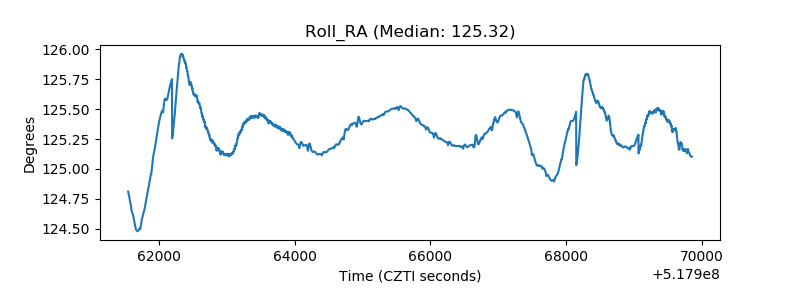 |
| Veto Counter | 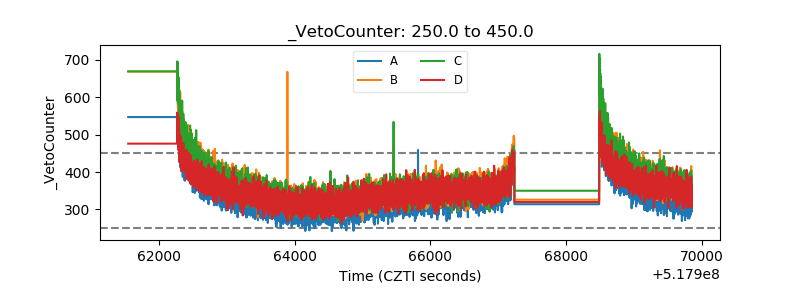 |