| Param | Original file | Final file |
|---|---|---|
| Filename | modeM0/AS1A14_083T16_9000006580_57757cztM0_level2.fits | modeM0/AS1A14_083T16_9000006580_57757cztM0_level2_quad_clean.evt |
| Size (bytes) | 485,524,800 | 100,523,520 |
| Size | 463.0 MB | 95.9 MB |
| Events in quadrant A | 3,582,510 | 665,035 |
| Events in quadrant B | 3,989,932 | 715,475 |
| Events in quadrant C | 6,265,543 | 613,887 |
| Events in quadrant D | 3,618,196 | 585,771 |
| Mode SS | |||
|---|---|---|---|
| Quadrant | BADHDUFLAG | Total packets | Discarded packets |
| A | 0 | 136 | 0 |
| B | 0 | 136 | 0 |
| C | 0 | 136 | 0 |
| D | 0 | 136 | 0 |
| Mode M0 | |||
|---|---|---|---|
| Quadrant | BADHDUFLAG | Total packets | Discarded packets |
| A | 0 | 15172 | 2 |
| B | 0 | 16432 | 2 |
| C | 0 | 23209 | 2 |
| D | 0 | 15558 | 2 |
| Mode M9 | |||
|---|---|---|---|
| Quadrant | BADHDUFLAG | Total packets | Discarded packets |
| A | 0 | 15 | 0 |
| B | 0 | 16 | 0 |
| C | 0 | 16 | 0 |
| D | 0 | 16 | 0 |
| Quadrant | Total seconds | Saturated seconds | Saturation percentage |
|---|---|---|---|
| A | 6649 | 150 | 2.255978% |
| B | 6649 | 217 | 3.263649% |
| C | 6649 | 464 | 6.978493% |
| D | 6649 | 162 | 2.436457% |
Noise dominated data is calculated using 1-second bins in cleaned event files. If a bin has >2000 counts, and if more than 50% of those come from <1% of pixels, then it is considered to be noise-dominated and hence unusable.
| Quadrant | # 1 sec bins | Bins with >0 counts | Bins with >2000 counts | High rate bins dominated by noise | Noise dominated (total time) | Noise dominated (detector-on time) | Marked lightcurve |
|---|---|---|---|---|---|---|---|
| A | 7874 | 6650 | 96 | 96 | 1.22% | 1.44% | 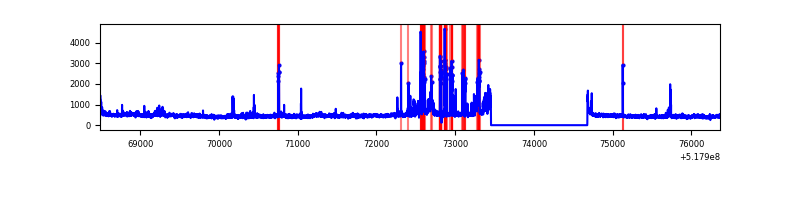 |
| B | 7874 | 6650 | 116 | 116 | 1.47% | 1.74% | 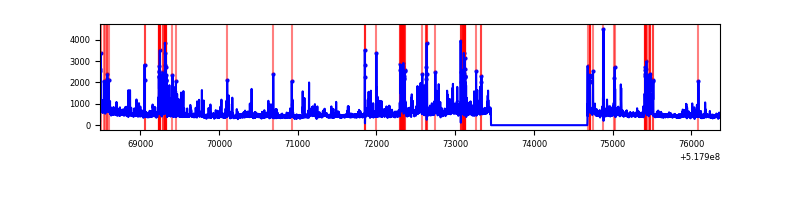 |
| C | 7874 | 6650 | 351 | 351 | 4.46% | 5.28% | 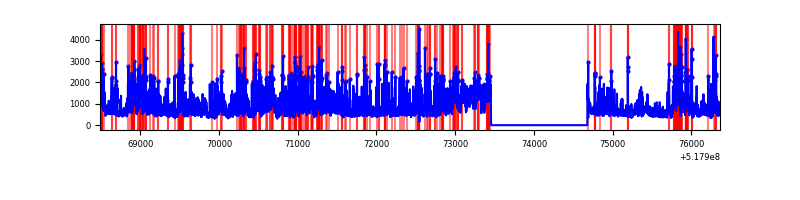 |
| D | 7874 | 6650 | 139 | 139 | 1.77% | 2.09% | 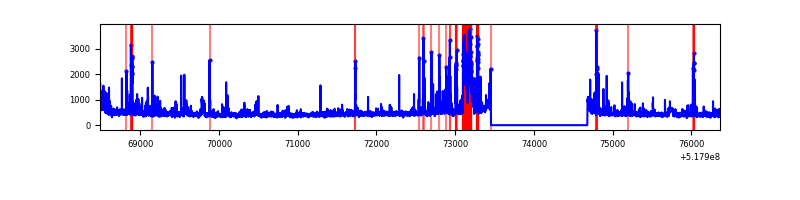 |
Top three noisy pixels from each quadrant. If the there are fewer than three noisy pixels in the level2.evt file, extra rows are filled as -1
| Pixel properties | Quadrant properties | ||||||
|---|---|---|---|---|---|---|---|
| Quadrant | DetID | PixID | Counts | Sigma | Mean | Median | Sigma |
| A | 13 | 248 | 485205 | 2766.36 | 708 | 692 | 175.1 |
| A | 3 | 128 | 201210 | 1144.87 | 708 | 692 | 175.1 |
| A | 4 | 236 | 57361 | 323.56 | 708 | 692 | 175.1 |
| B | 4 | 158 | 430864 | 2866.93 | 707 | 680 | 150.1 |
| B | 4 | 80 | 180492 | 1198.34 | 707 | 680 | 150.1 |
| B | 10 | 16 | 139570 | 925.62 | 707 | 680 | 150.1 |
| C | 15 | 224 | 1488571 | 7925.87 | 686 | 681 | 187.7 |
| C | 9 | 38 | 1485334 | 7908.63 | 686 | 681 | 187.7 |
| C | 12 | 252 | 361814 | 1923.73 | 686 | 681 | 187.7 |
| D | 2 | 153 | 346667 | 1788.24 | 686 | 652 | 193.5 |
| D | 3 | 12 | 137806 | 708.83 | 686 | 652 | 193.5 |
| D | 2 | 249 | 106118 | 545.06 | 686 | 652 | 193.5 |
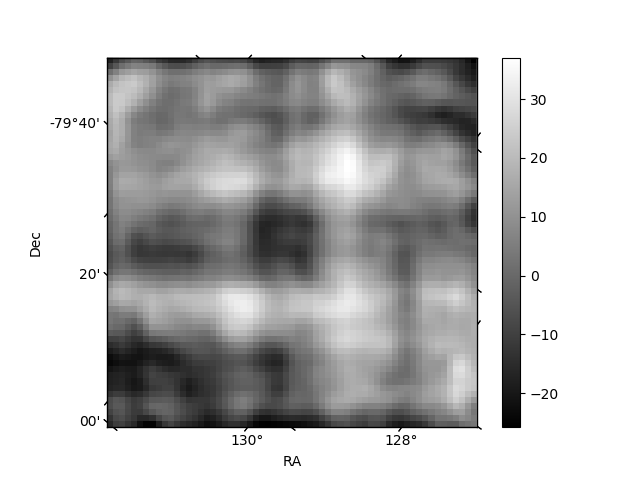
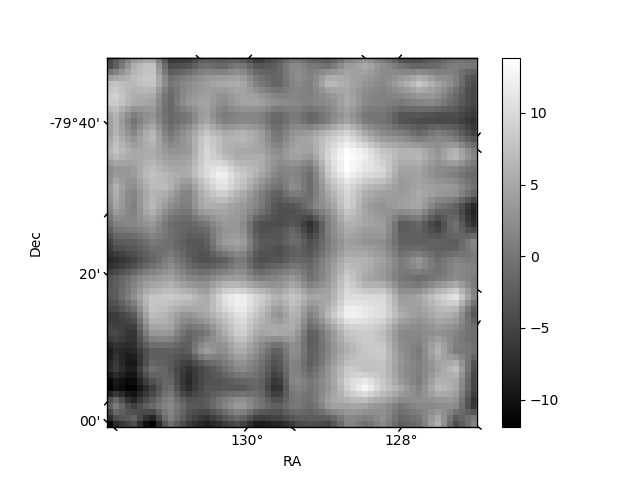
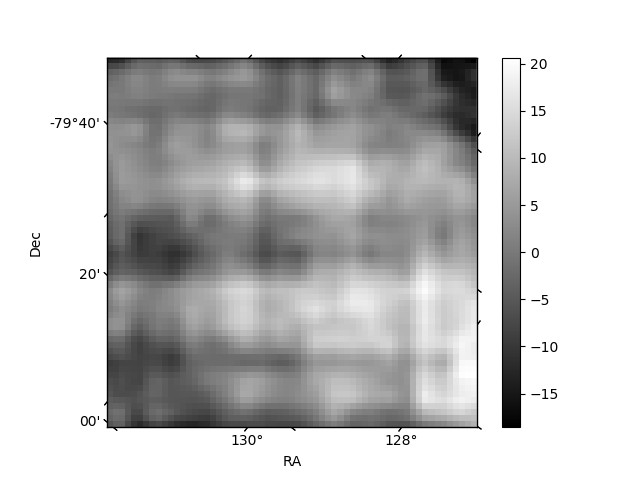
Histogram calculated using DETX and DETY for each event in the final _common_clean file
| Quadrant A | 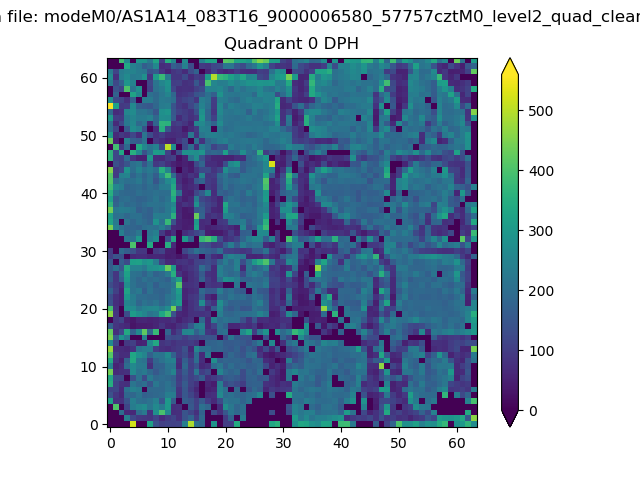 |
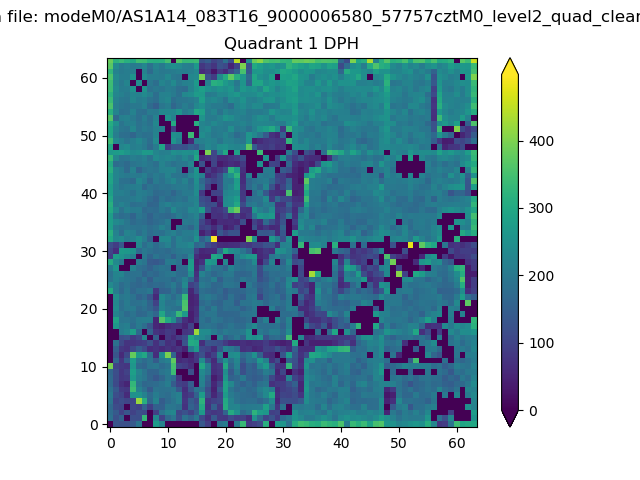 |
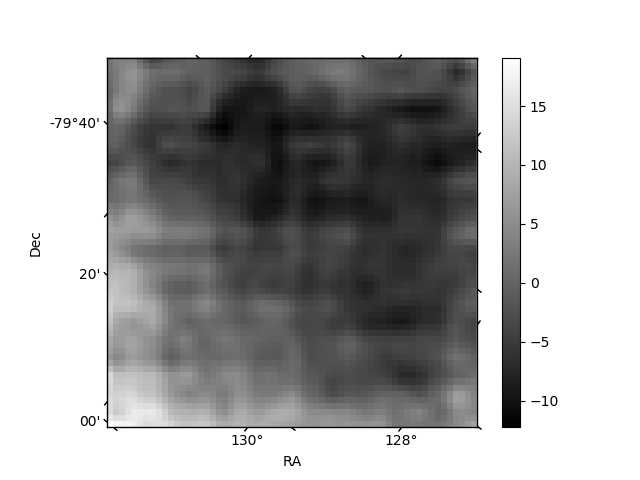
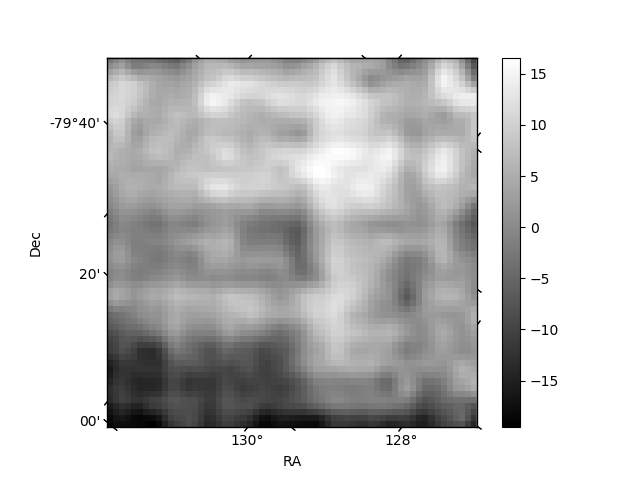
Quadrant B |
|---|---|---|---|
| Quadrant D | 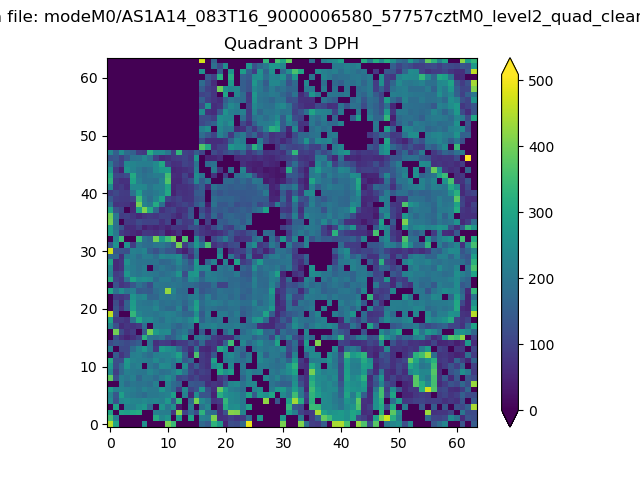 |
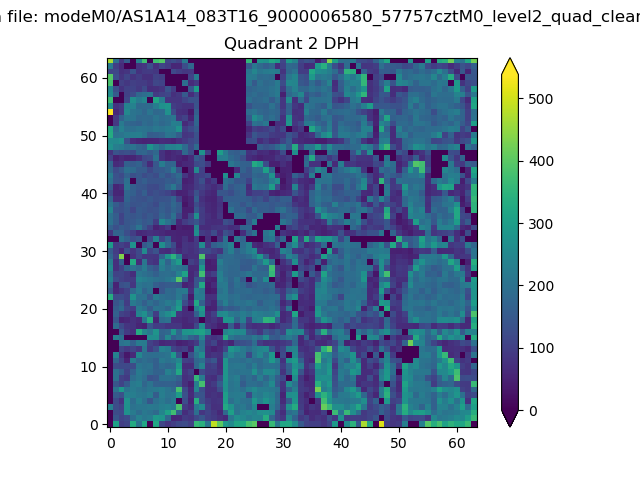 |
Quadrant C |
| Plot type | Count rate plots | Images |
|---|---|---|
| Comparison with Poisson distribution Blue bars denote a histogram of data divided into 1 sec bins. Red curve is a Poisson curve with rate = median count rate of data. |
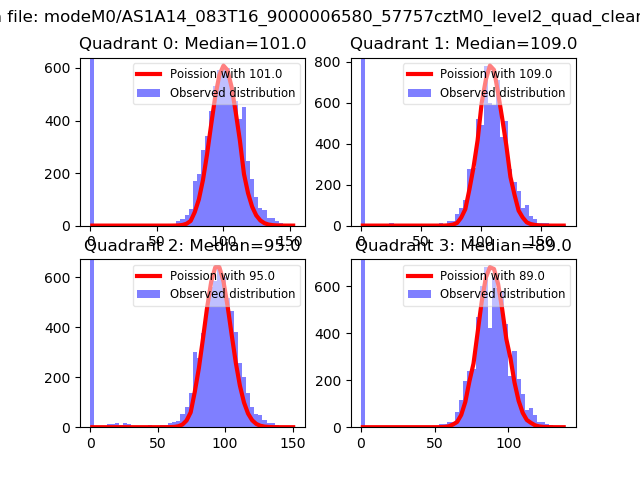 |
 |
| Quadrant-wise count rates Data is divided into 100 sec bins |
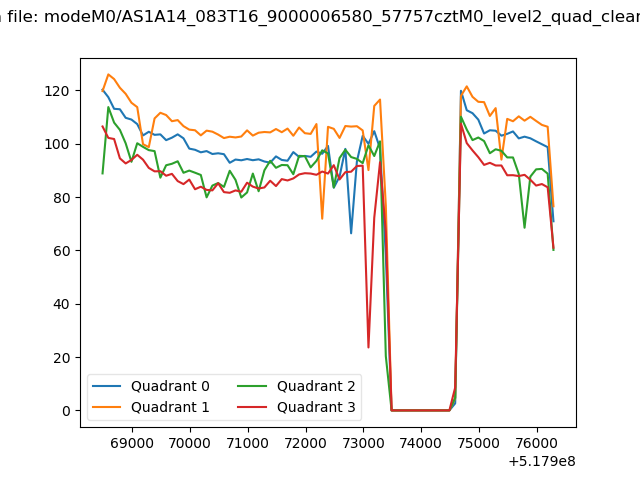 |
|
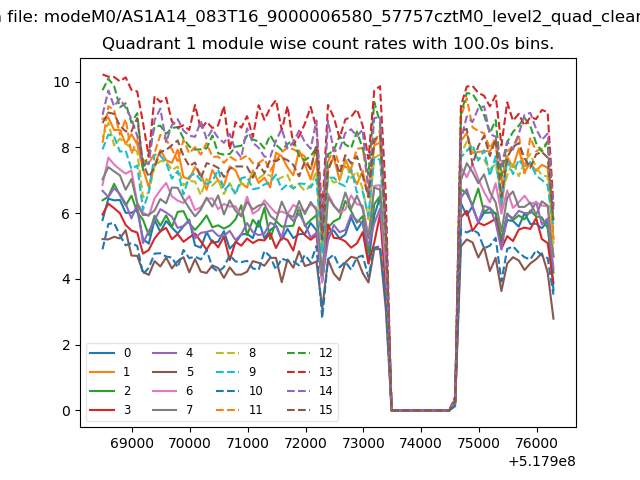
| Module-wise count rates for Quadrant A Data is divided into 100 sec bins |
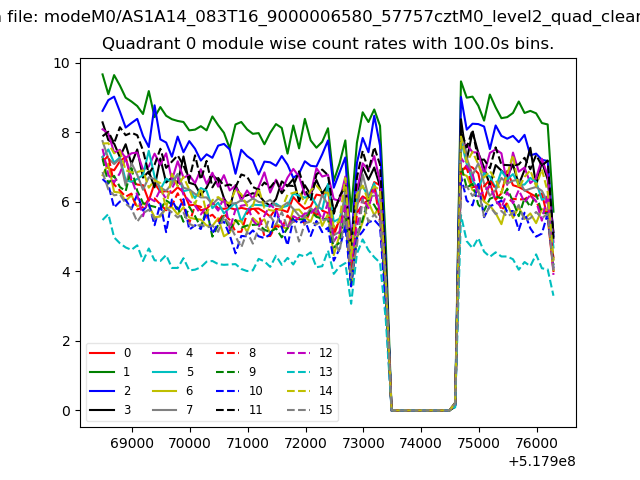 |
 |
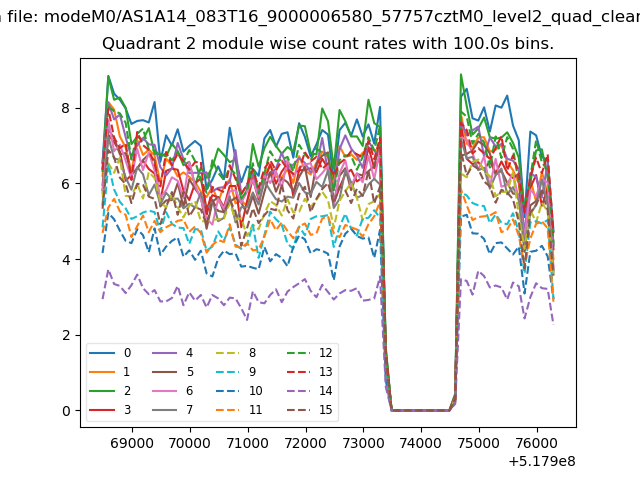
| Module-wise count rates for Quadrant B Data is divided into 100 sec bins |
 |
 |
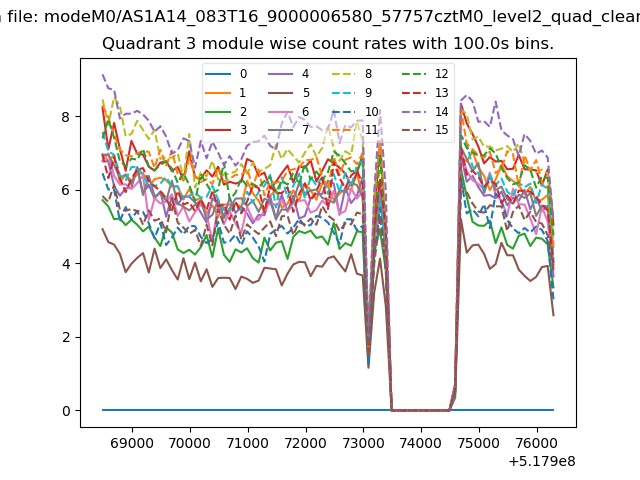
| Module-wise count rates for Quadrant C Data is divided into 100 sec bins |
 |
 |
| Module-wise count rates for Quadrant D Data is divided into 100 sec bins |
 |
 |
| Parameter | Plot |
|---|---|
| CZT HV Monitor | 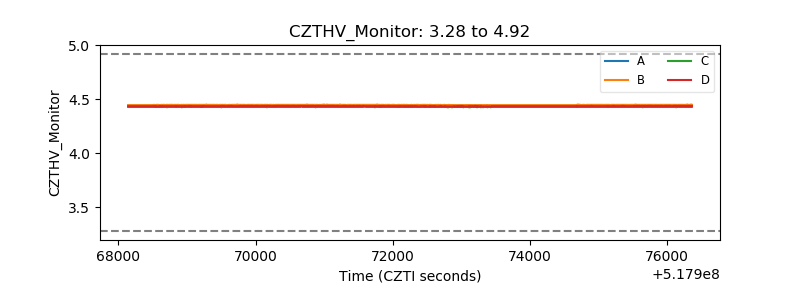 |
| D_VDD | 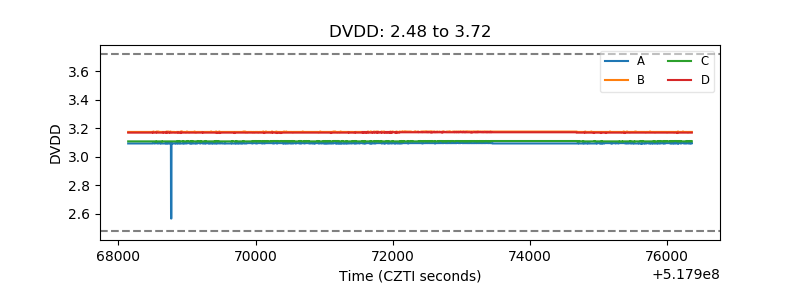 |
| Temperature 1 | 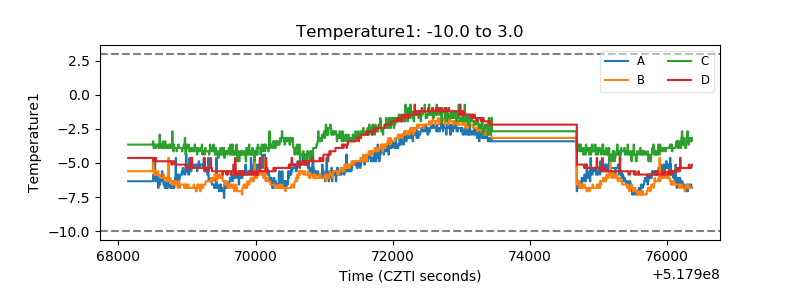 |
| Veto HV Monitor | 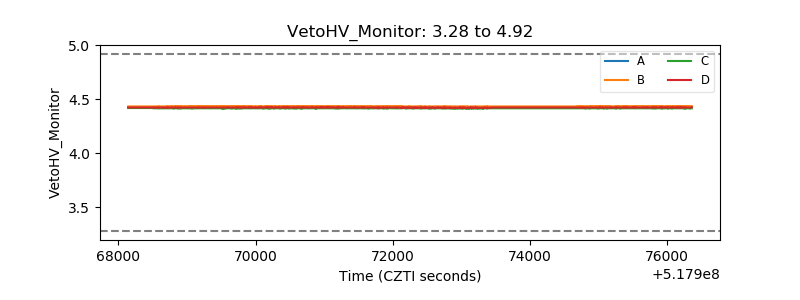 |
| Veto LLD | 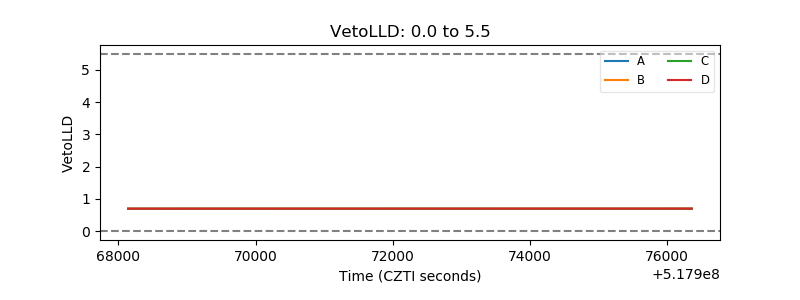 |
| Alpha Counter | 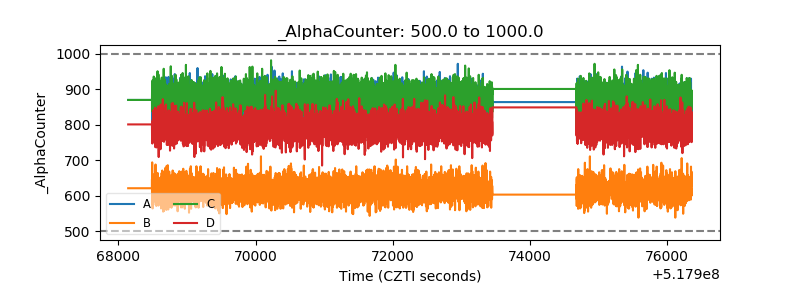 |
| _CPM_Rate | 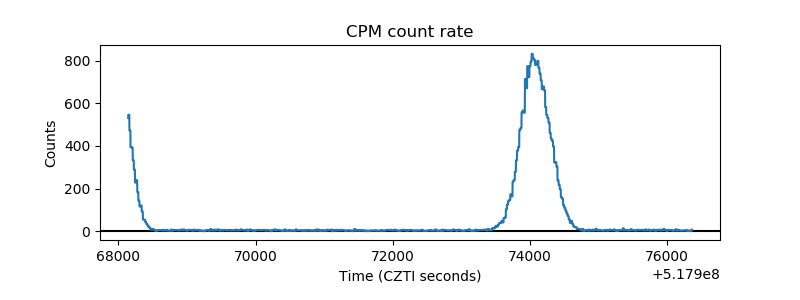 |
| CZT Counter | 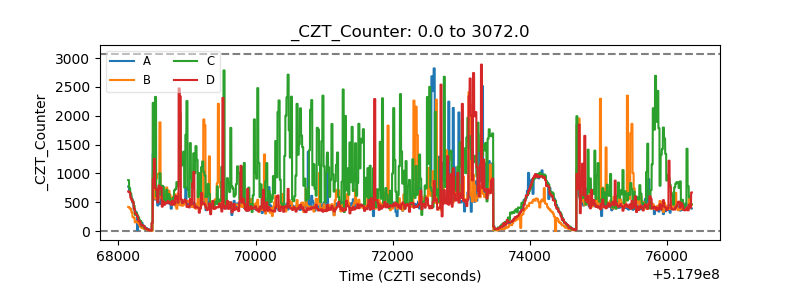 |
| +2.5 Volts monitor | 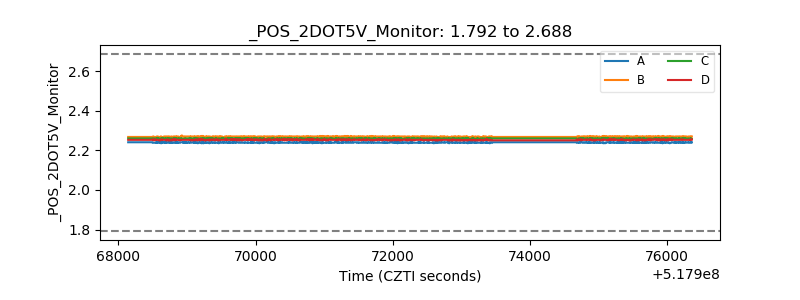 |
| +5 Volts monitor |  |
| _ROLL_ROT | 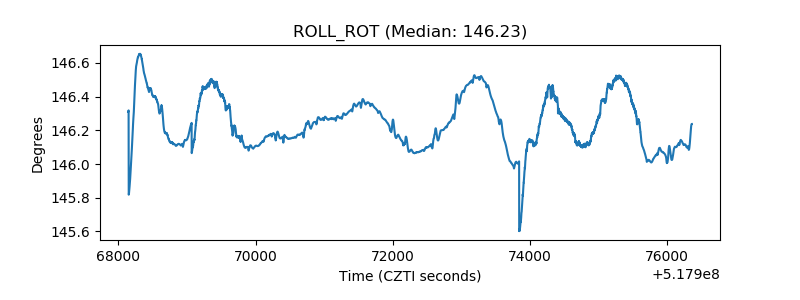 |
| _Roll_DEC | 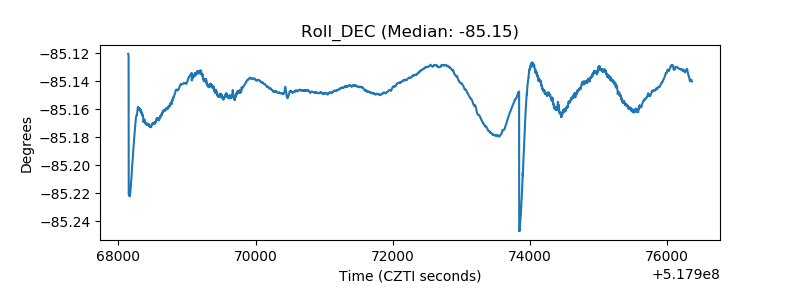 |
| _Roll_RA | 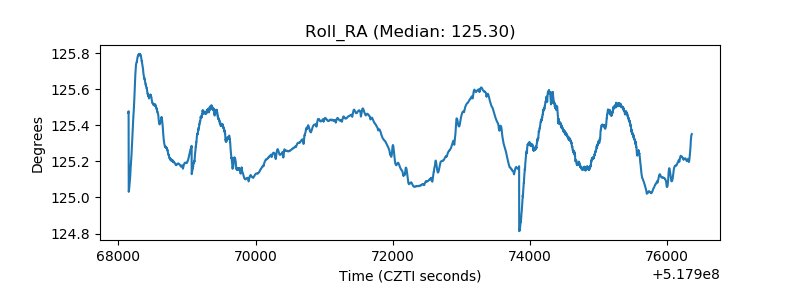 |
| Veto Counter | 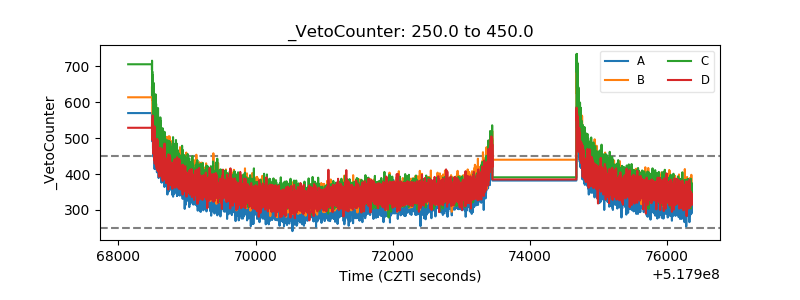 |