| Param | Original file | Final file |
|---|---|---|
| Filename | modeM0/AS1A14_083T16_9000006580_57758cztM0_level2.fits | modeM0/AS1A14_083T16_9000006580_57758cztM0_level2_quad_clean.evt |
| Size (bytes) | 467,668,800 | 95,768,640 |
| Size | 446.0 MB | 91.3 MB |
| Events in quadrant A | 3,021,490 | 644,051 |
| Events in quadrant B | 3,653,902 | 683,943 |
| Events in quadrant C | 6,348,185 | 556,540 |
| Events in quadrant D | 3,781,291 | 560,588 |
| Mode SS | |||
|---|---|---|---|
| Quadrant | BADHDUFLAG | Total packets | Discarded packets |
| A | 0 | 132 | 0 |
| B | 0 | 132 | 0 |
| C | 0 | 132 | 0 |
| D | 0 | 132 | 0 |
| Mode M0 | |||
|---|---|---|---|
| Quadrant | BADHDUFLAG | Total packets | Discarded packets |
| A | 0 | 13735 | 1 |
| B | 0 | 15319 | 1 |
| C | 0 | 23299 | 1 |
| D | 0 | 15956 | 1 |
| Mode M9 | |||
|---|---|---|---|
| Quadrant | BADHDUFLAG | Total packets | Discarded packets |
| A | 0 | 11 | 0 |
| B | 0 | 11 | 0 |
| C | 0 | 11 | 0 |
| D | 0 | 11 | 0 |
| Quadrant | Total seconds | Saturated seconds | Saturation percentage |
|---|---|---|---|
| A | 6519 | 52 | 0.797668% |
| B | 6519 | 173 | 2.653781% |
| C | 6520 | 760 | 11.656442% |
| D | 6520 | 213 | 3.266871% |
Noise dominated data is calculated using 1-second bins in cleaned event files. If a bin has >2000 counts, and if more than 50% of those come from <1% of pixels, then it is considered to be noise-dominated and hence unusable.
| Quadrant | # 1 sec bins | Bins with >0 counts | Bins with >2000 counts | High rate bins dominated by noise | Noise dominated (total time) | Noise dominated (detector-on time) | Marked lightcurve |
|---|---|---|---|---|---|---|---|
| A | 7649 | 6521 | 26 | 26 | 0.34% | 0.40% | 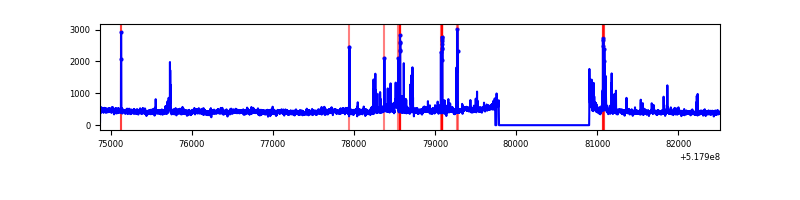 |
| B | 7649 | 6521 | 69 | 69 | 0.90% | 1.06% | 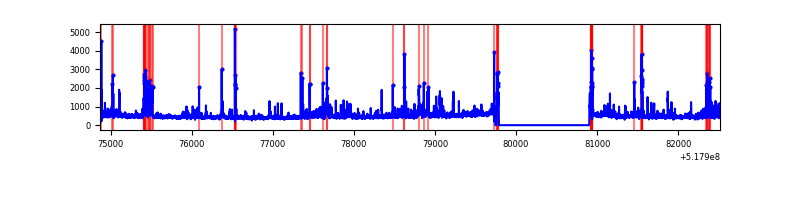 |
| C | 7650 | 6522 | 586 | 586 | 7.66% | 8.98% | 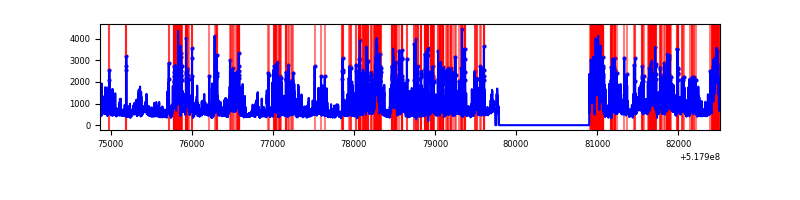 |
| D | 7650 | 6522 | 155 | 155 | 2.03% | 2.38% | 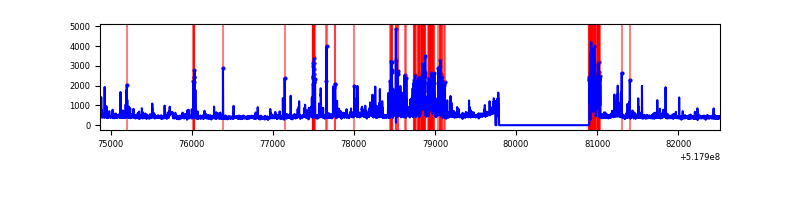 |
Top three noisy pixels from each quadrant. If the there are fewer than three noisy pixels in the level2.evt file, extra rows are filled as -1
| Pixel properties | Quadrant properties | ||||||
|---|---|---|---|---|---|---|---|
| Quadrant | DetID | PixID | Counts | Sigma | Mean | Median | Sigma |
| A | 13 | 248 | 165932 | 963.08 | 692 | 675 | 171.6 |
| A | 3 | 128 | 99529 | 576.1 | 692 | 675 | 171.6 |
| A | 3 | 245 | 34021 | 194.33 | 692 | 675 | 171.6 |
| B | 4 | 158 | 175219 | 1198.64 | 686 | 660 | 145.6 |
| B | 4 | 80 | 133377 | 911.32 | 686 | 660 | 145.6 |
| B | 0 | 213 | 83599 | 569.51 | 686 | 660 | 145.6 |
| C | 15 | 224 | 2335387 | 13051.92 | 654 | 646 | 178.9 |
| C | 9 | 38 | 790960 | 4418.1 | 654 | 646 | 178.9 |
| C | 15 | 208 | 295357 | 1647.53 | 654 | 646 | 178.9 |
| D | 8 | 240 | 322936 | 1717.08 | 666 | 635 | 187.7 |
| D | 2 | 249 | 237783 | 1263.42 | 666 | 635 | 187.7 |
| D | 13 | 138 | 226843 | 1205.14 | 666 | 635 | 187.7 |
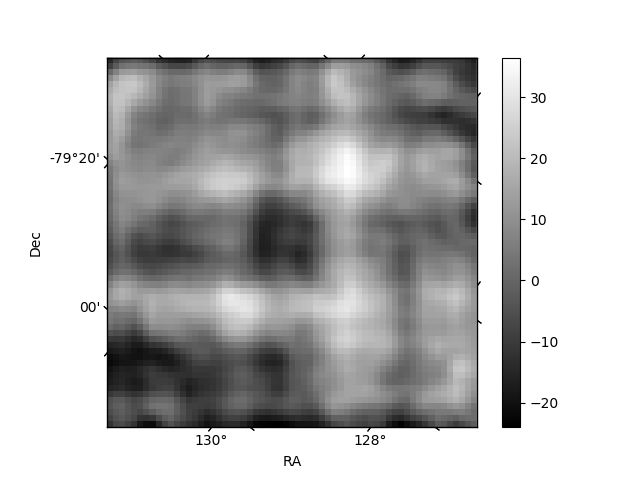
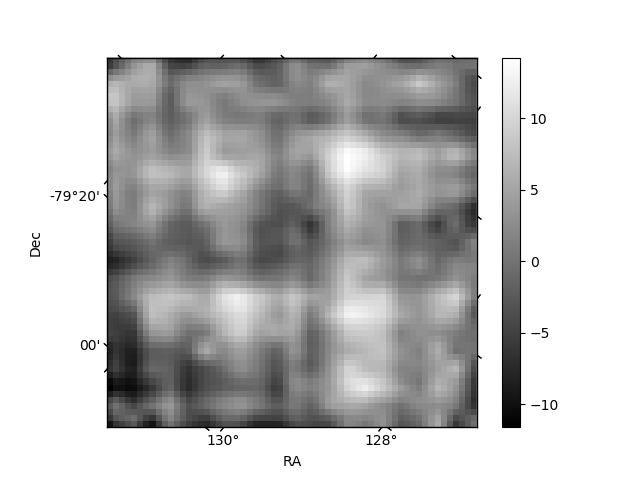
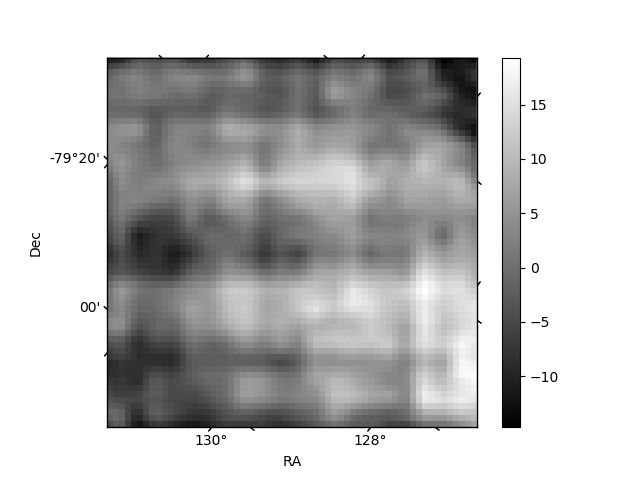
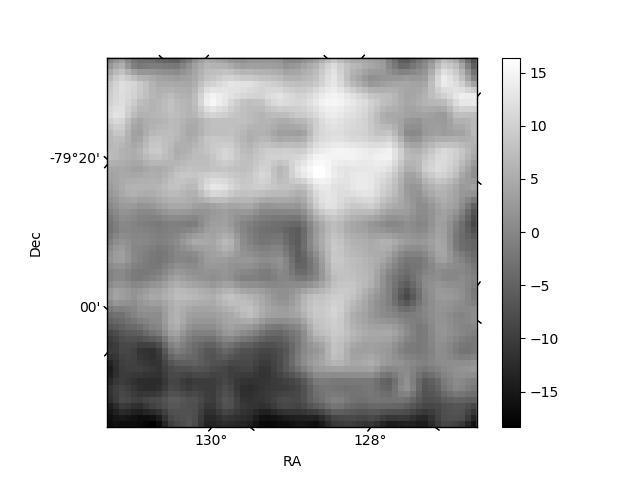
Histogram calculated using DETX and DETY for each event in the final _common_clean file
| Quadrant A | 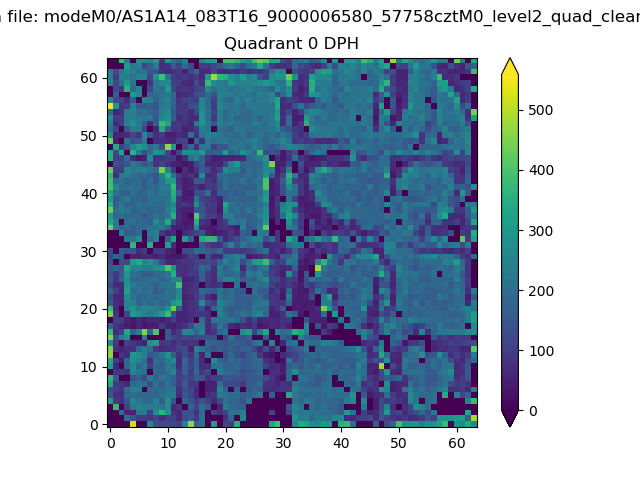 |
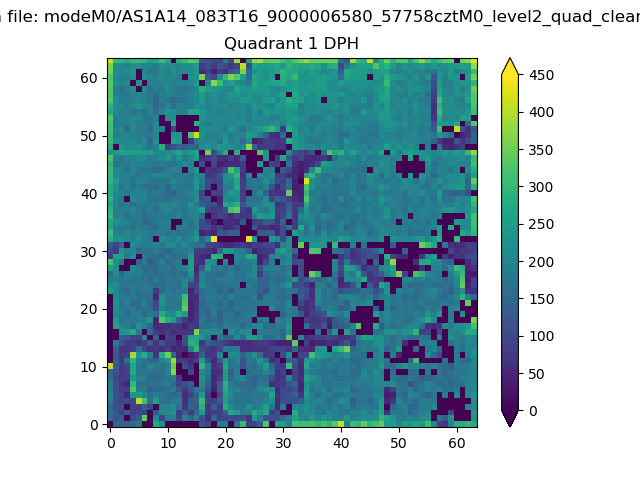 |
Quadrant B |
|---|---|---|---|
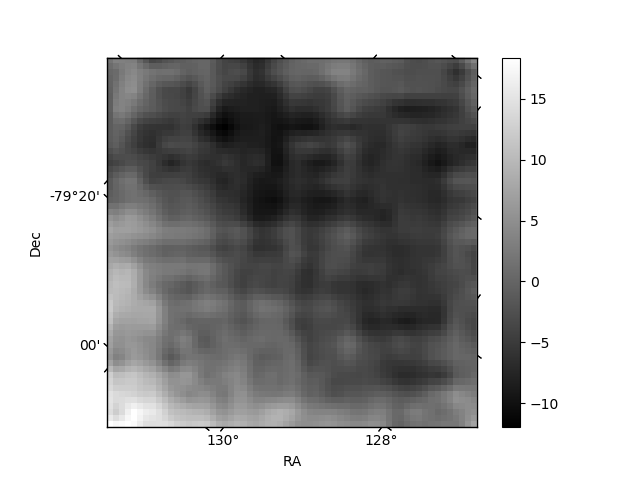
| Quadrant D | 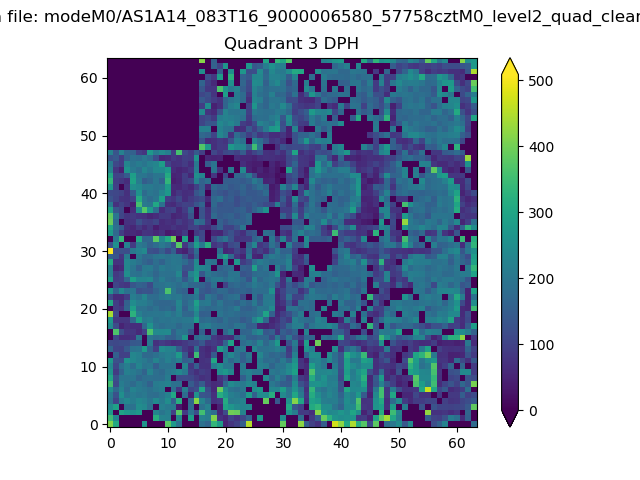 |
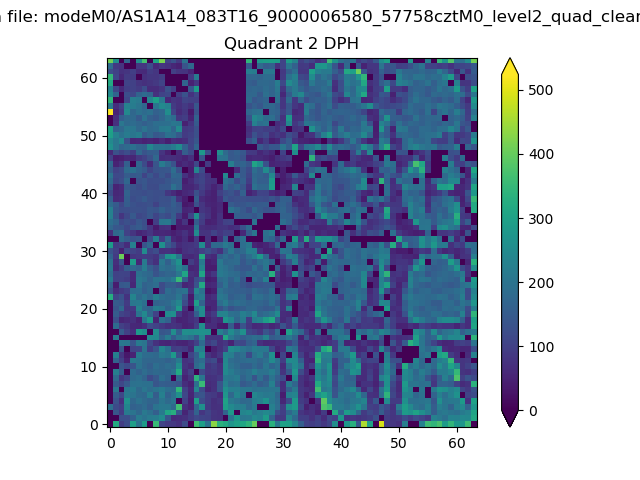 |
Quadrant C |
| Plot type | Count rate plots | Images |
|---|---|---|
| Comparison with Poisson distribution Blue bars denote a histogram of data divided into 1 sec bins. Red curve is a Poisson curve with rate = median count rate of data. |
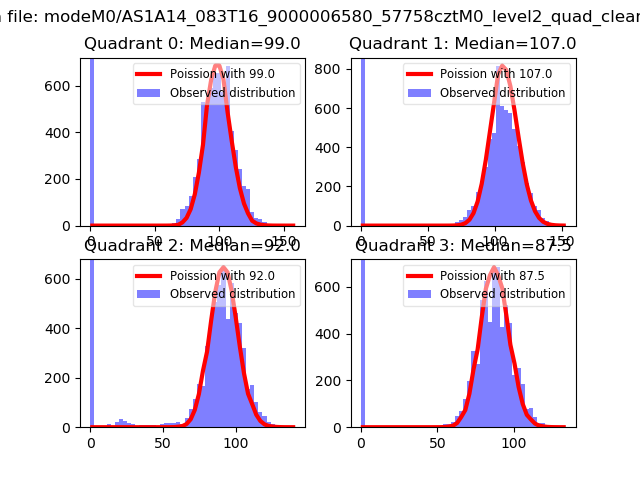 |
 |
| Quadrant-wise count rates Data is divided into 100 sec bins |
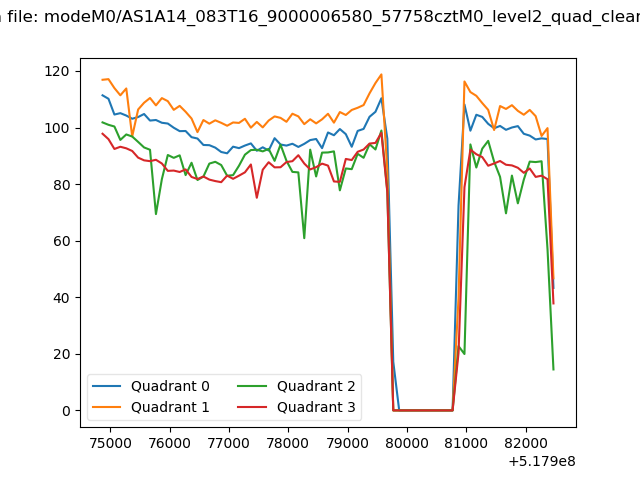 |
|
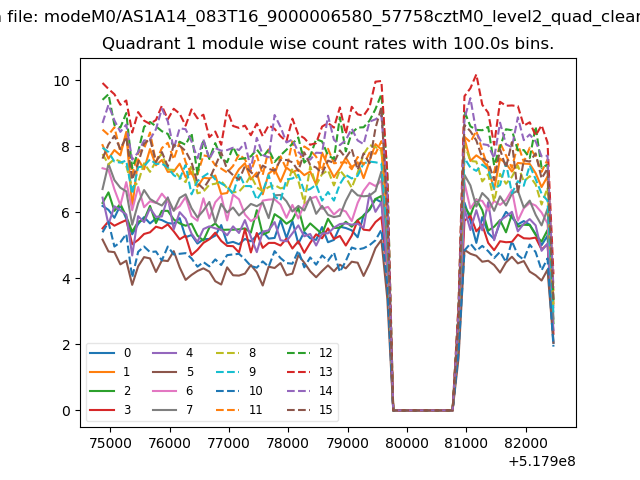
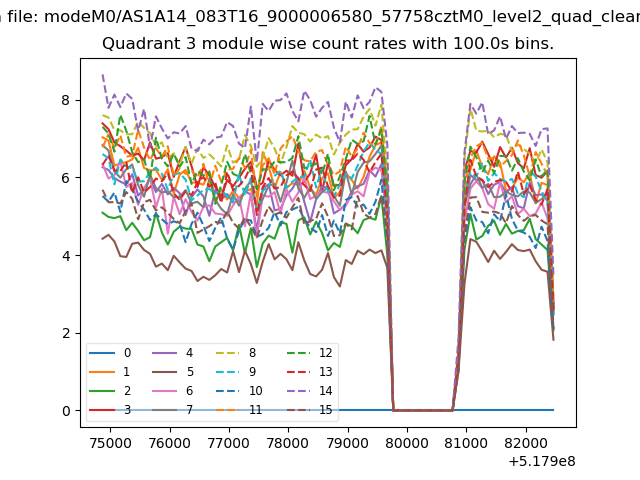
| Module-wise count rates for Quadrant A Data is divided into 100 sec bins |
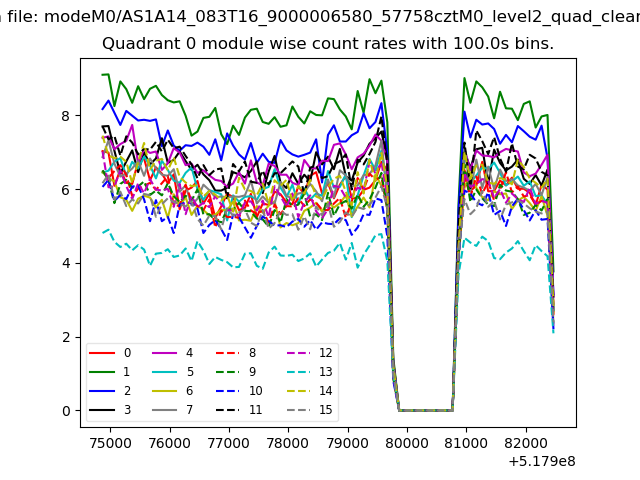 |
 |
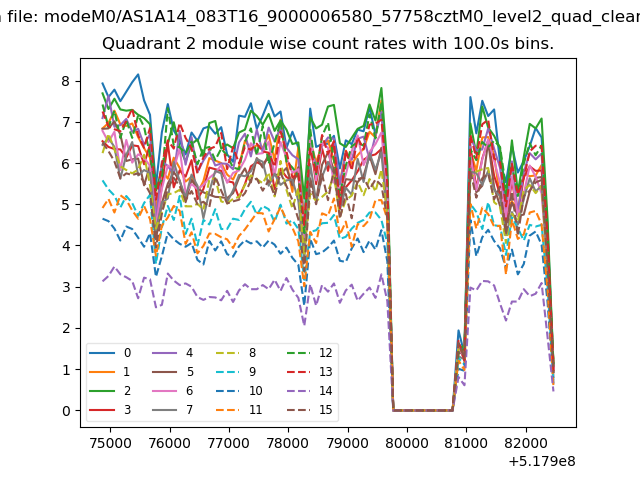
| Module-wise count rates for Quadrant B Data is divided into 100 sec bins |
 |
 |
| Module-wise count rates for Quadrant C Data is divided into 100 sec bins |
 |
 |
| Module-wise count rates for Quadrant D Data is divided into 100 sec bins |
 |
 |
| Parameter | Plot |
|---|---|
| CZT HV Monitor | 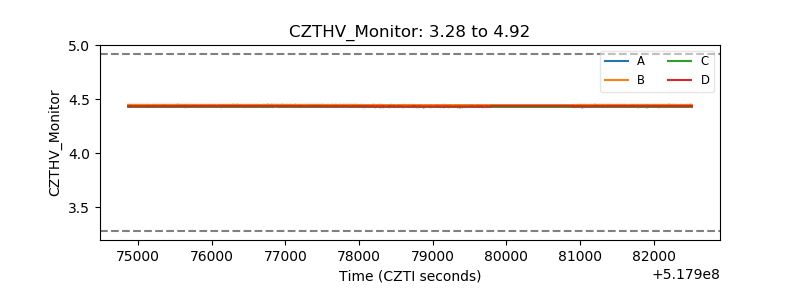 |
| D_VDD | 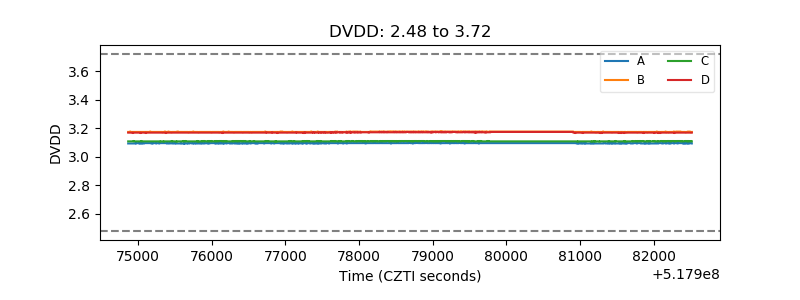 |
| Temperature 1 | 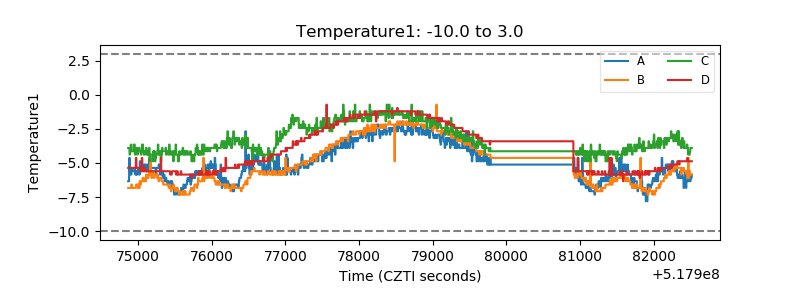 |
| Veto HV Monitor |  |
| Veto LLD | 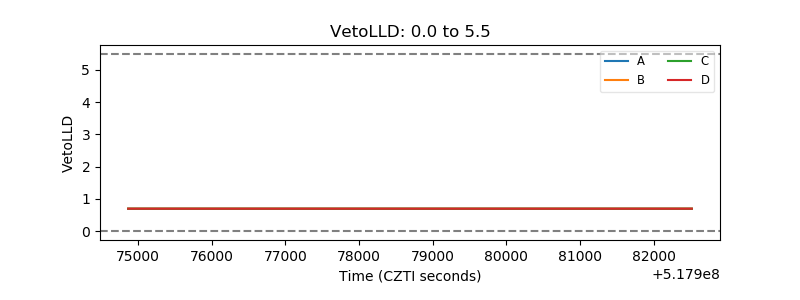 |
| Alpha Counter | 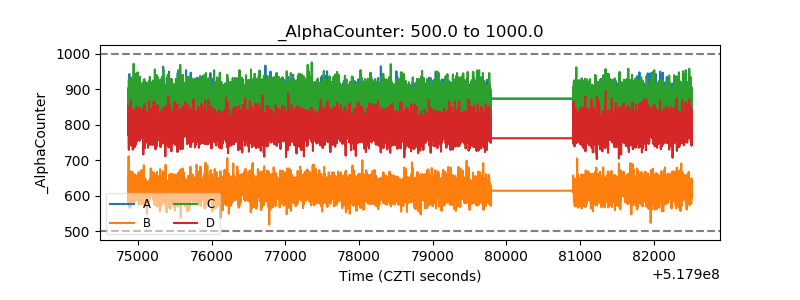 |
| _CPM_Rate | 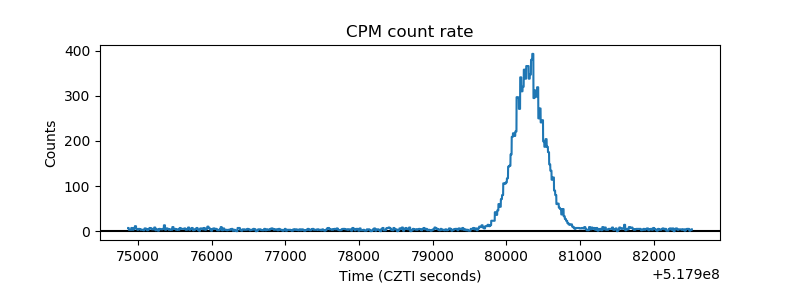 |
| CZT Counter | 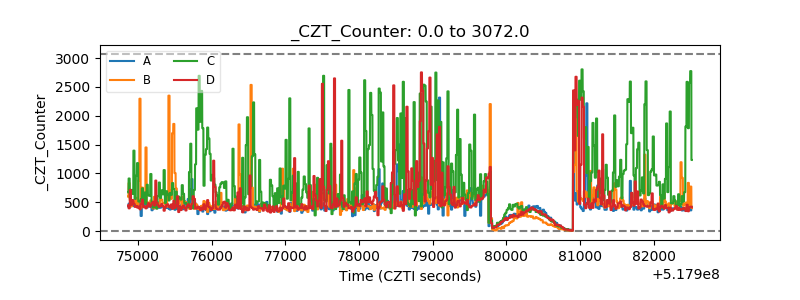 |
| +2.5 Volts monitor | 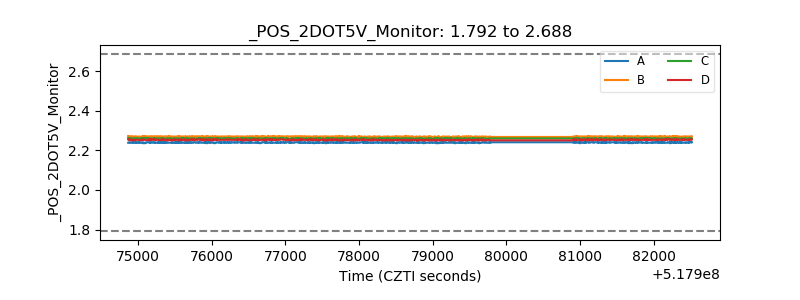 |
| +5 Volts monitor | 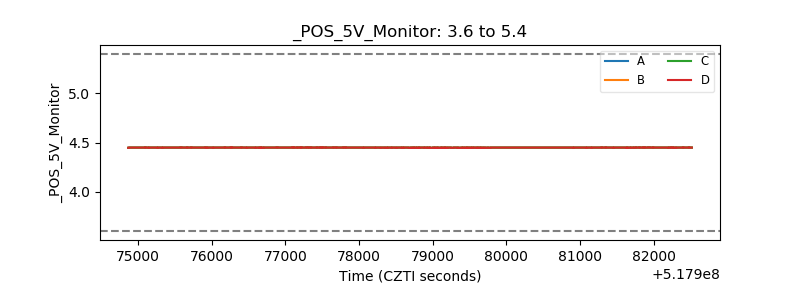 |
| _ROLL_ROT | 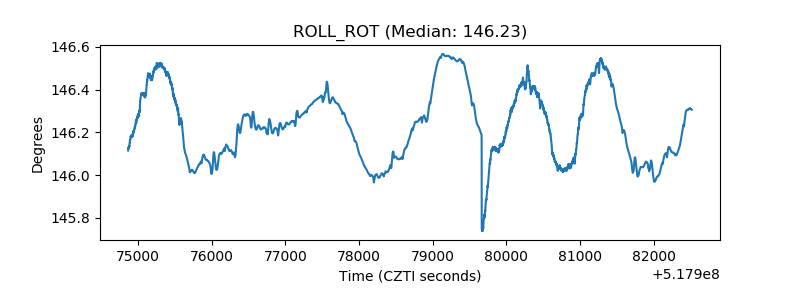 |
| _Roll_DEC | 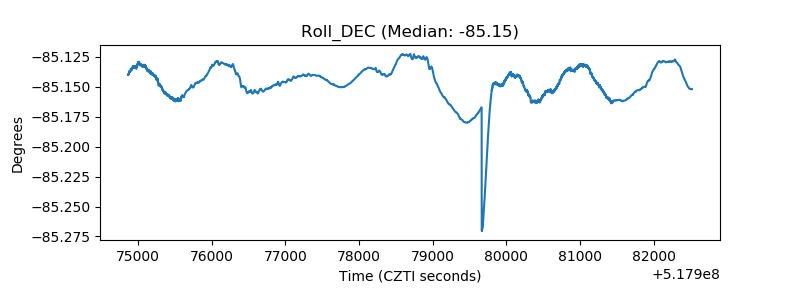 |
| _Roll_RA | 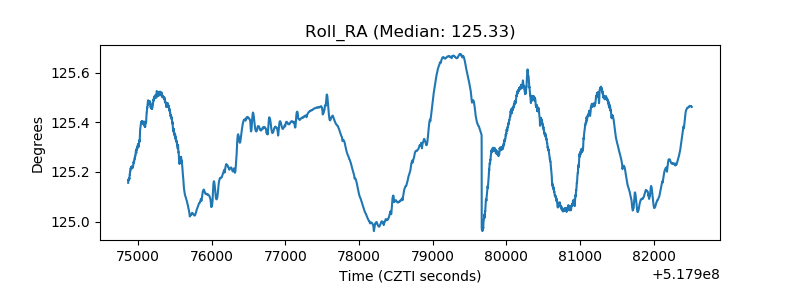 |
| Veto Counter | 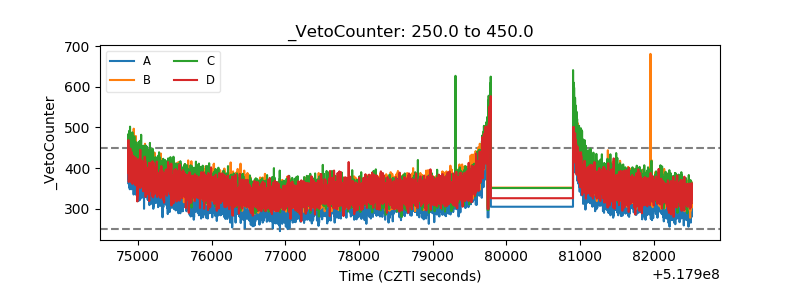 |