| Param | Original file | Final file |
|---|---|---|
| Filename | modeM0/AS1A14_083T16_9000006580_57759cztM0_level2.fits | modeM0/AS1A14_083T16_9000006580_57759cztM0_level2_quad_clean.evt |
| Size (bytes) | 461,306,880 | 86,785,920 |
| Size | 439.9 MB | 82.8 MB |
| Events in quadrant A | 2,591,638 | 580,690 |
| Events in quadrant B | 3,917,545 | 616,552 |
| Events in quadrant C | 6,986,726 | 486,662 |
| Events in quadrant D | 3,107,485 | 518,853 |
| Mode SS | |||
|---|---|---|---|
| Quadrant | BADHDUFLAG | Total packets | Discarded packets |
| A | 0 | 124 | 0 |
| B | 0 | 124 | 0 |
| C | 0 | 126 | 0 |
| D | 0 | 126 | 0 |
| Mode M0 | |||
|---|---|---|---|
| Quadrant | BADHDUFLAG | Total packets | Discarded packets |
| A | 0 | 12448 | 1 |
| B | 0 | 15896 | 1 |
| C | 0 | 25030 | 1 |
| D | 0 | 13800 | 1 |
| Mode M9 | |||
|---|---|---|---|
| Quadrant | BADHDUFLAG | Total packets | Discarded packets |
| A | 0 | 8 | 0 |
| B | 0 | 8 | 0 |
| C | 0 | 8 | 0 |
| D | 0 | 8 | 0 |
| Quadrant | Total seconds | Saturated seconds | Saturation percentage |
|---|---|---|---|
| A | 6085 | 80 | 1.314708% |
| B | 6085 | 243 | 3.993426% |
| C | 6085 | 968 | 15.907970% |
| D | 6086 | 117 | 1.922445% |
Noise dominated data is calculated using 1-second bins in cleaned event files. If a bin has >2000 counts, and if more than 50% of those come from <1% of pixels, then it is considered to be noise-dominated and hence unusable.
| Quadrant | # 1 sec bins | Bins with >0 counts | Bins with >2000 counts | High rate bins dominated by noise | Noise dominated (total time) | Noise dominated (detector-on time) | Marked lightcurve |
|---|---|---|---|---|---|---|---|
| A | 6945 | 6086 | 3 | 3 | 0.04% | 0.05% | 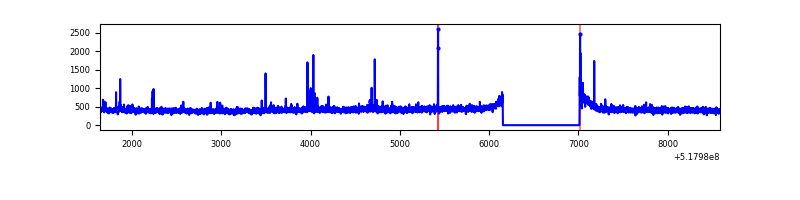 |
| B | 6945 | 6086 | 69 | 69 | 0.99% | 1.13% | 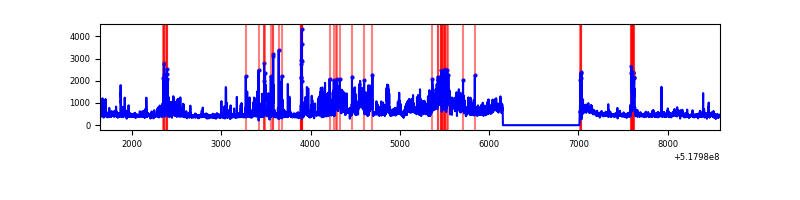 |
| C | 6945 | 6086 | 785 | 785 | 11.30% | 12.90% | 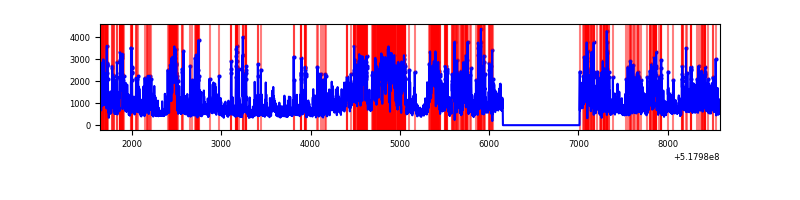 |
| D | 6945 | 6086 | 51 | 51 | 0.73% | 0.84% | 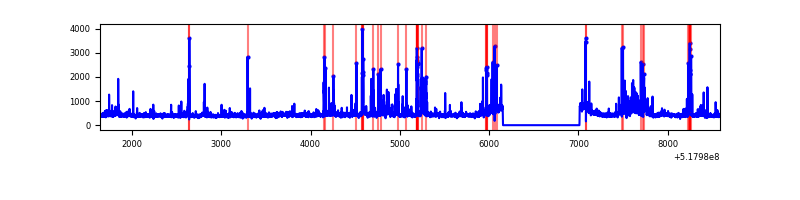 |
Top three noisy pixels from each quadrant. If the there are fewer than three noisy pixels in the level2.evt file, extra rows are filled as -1
| Pixel properties | Quadrant properties | ||||||
|---|---|---|---|---|---|---|---|
| Quadrant | DetID | PixID | Counts | Sigma | Mean | Median | Sigma |
| A | 13 | 248 | 19415 | 117.29 | 646 | 629 | 160.2 |
| A | 3 | 128 | 18882 | 113.96 | 646 | 629 | 160.2 |
| A | 3 | 245 | 17251 | 103.78 | 646 | 629 | 160.2 |
| B | 4 | 80 | 522423 | 3871.11 | 634 | 610 | 134.8 |
| B | 4 | 171 | 227904 | 1686.2 | 634 | 610 | 134.8 |
| B | 4 | 158 | 151479 | 1119.23 | 634 | 610 | 134.8 |
| C | 15 | 224 | 1852872 | 11391.13 | 596 | 588 | 162.6 |
| C | 12 | 254 | 1153835 | 7092.21 | 596 | 588 | 162.6 |
| C | 15 | 208 | 1003586 | 6168.21 | 596 | 588 | 162.6 |
| D | 8 | 240 | 137799 | 780.63 | 626 | 598 | 175.8 |
| D | 2 | 153 | 137656 | 779.82 | 626 | 598 | 175.8 |
| D | 3 | 12 | 135568 | 767.94 | 626 | 598 | 175.8 |
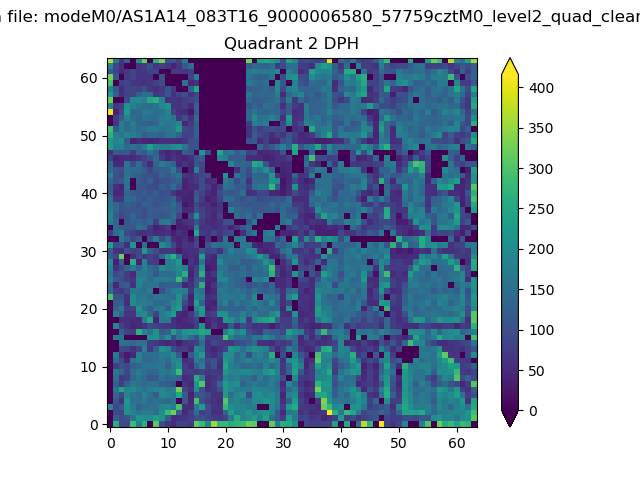
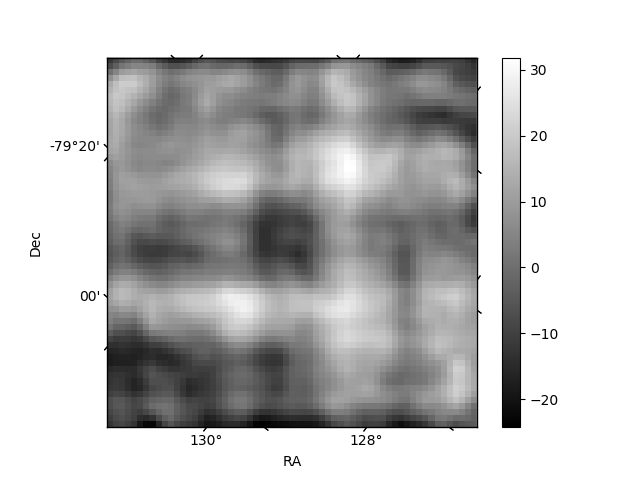
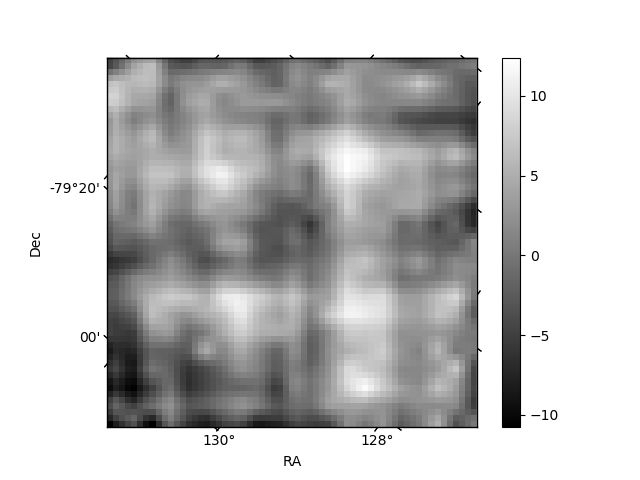
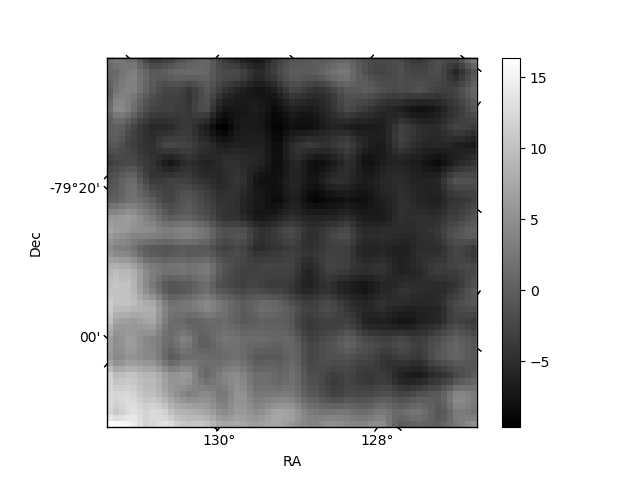
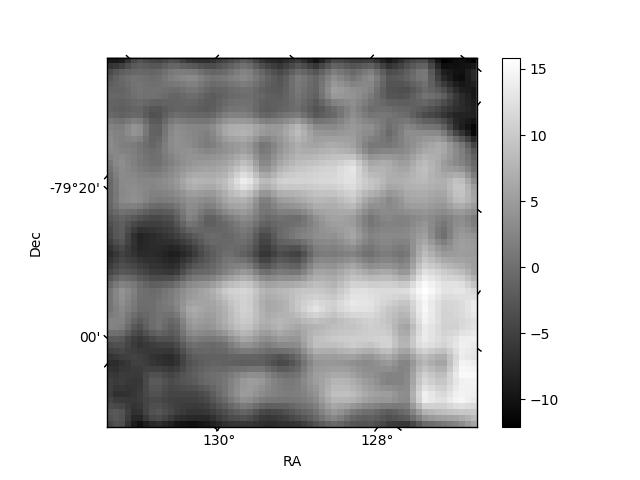
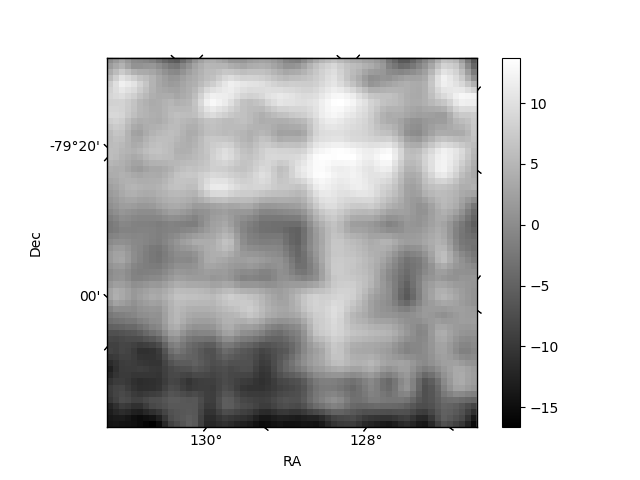
Histogram calculated using DETX and DETY for each event in the final _common_clean file
| Quadrant A | 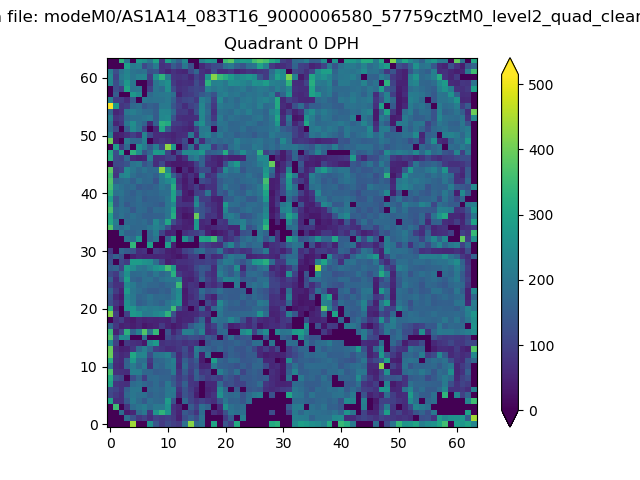 |
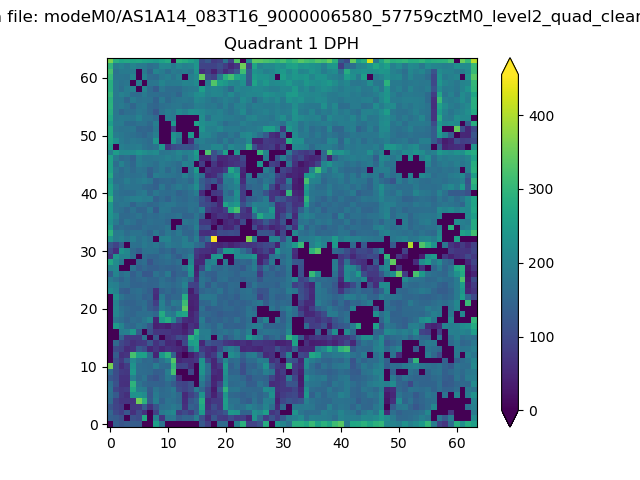 |
Quadrant B |
|---|---|---|---|
| Quadrant D | 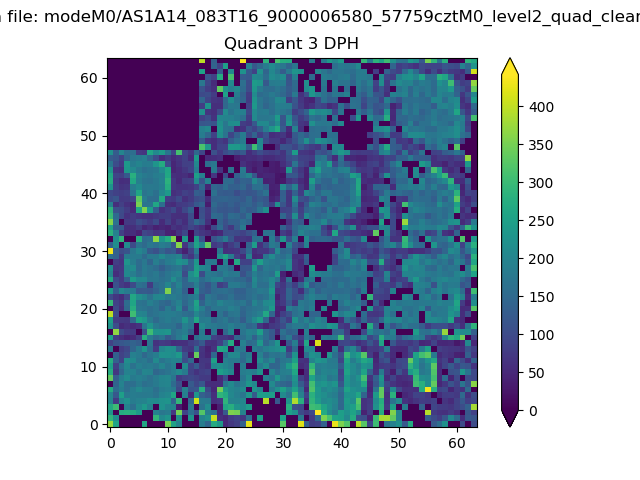 |
 |
Quadrant C |
| Plot type | Count rate plots | Images |
|---|---|---|
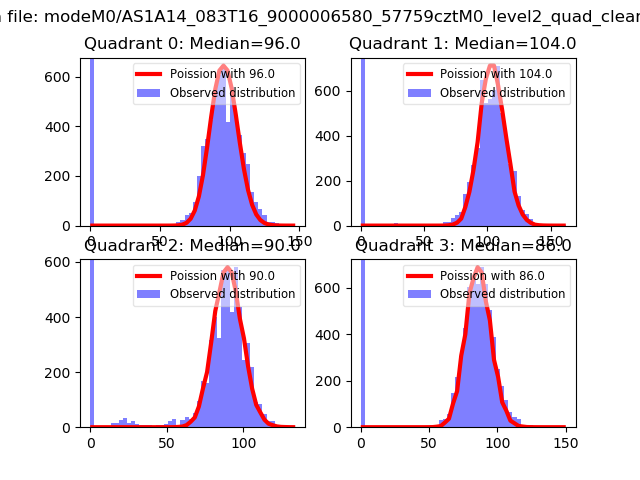
| Comparison with Poisson distribution Blue bars denote a histogram of data divided into 1 sec bins. Red curve is a Poisson curve with rate = median count rate of data. |
 |
 |
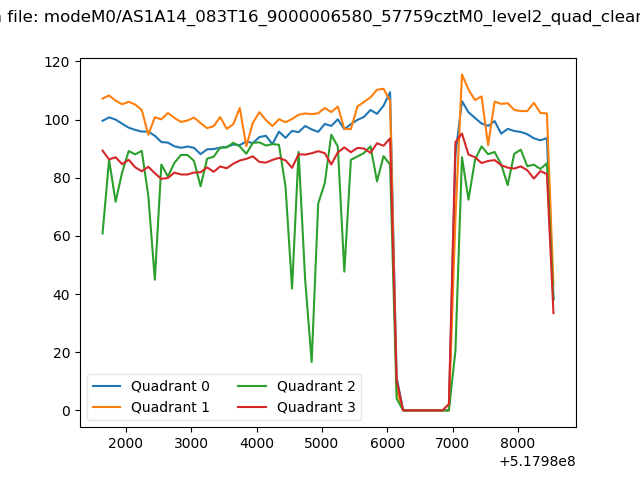
| Quadrant-wise count rates Data is divided into 100 sec bins |
 |
|
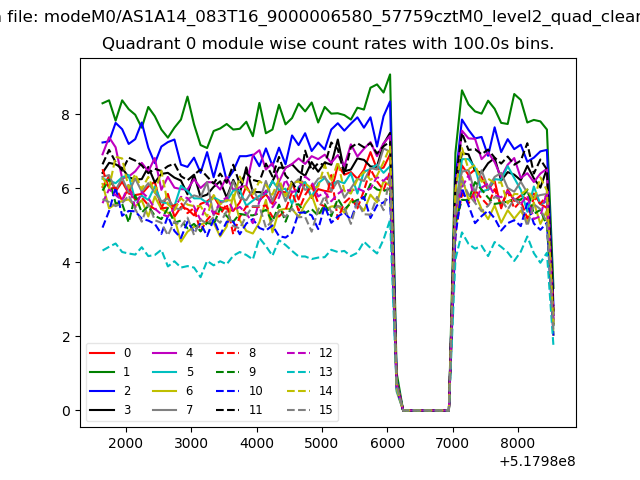
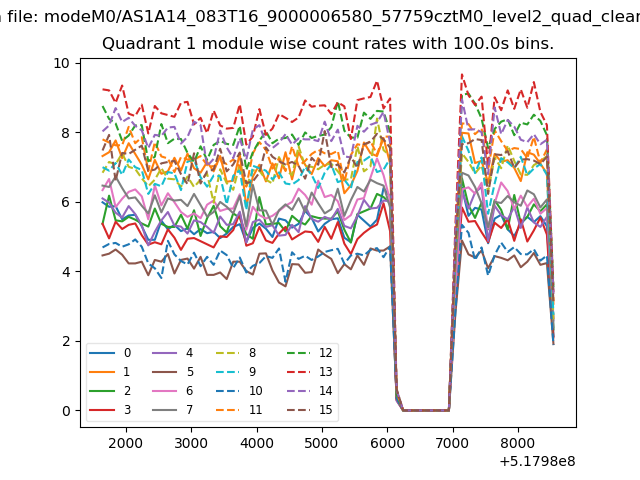
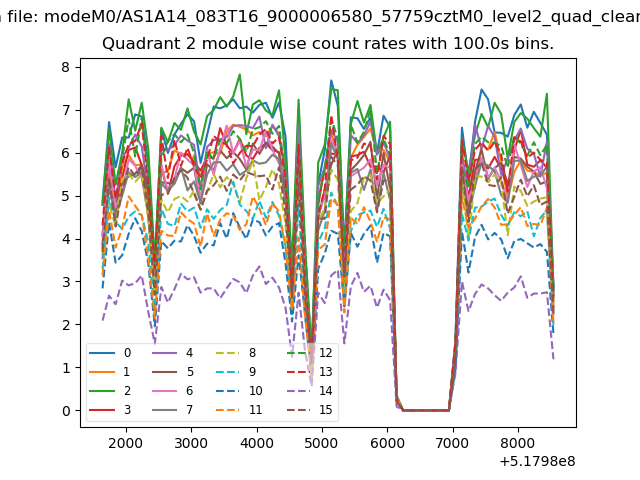
| Module-wise count rates for Quadrant A Data is divided into 100 sec bins |
 |
 |
| Module-wise count rates for Quadrant B Data is divided into 100 sec bins |
 |
 |
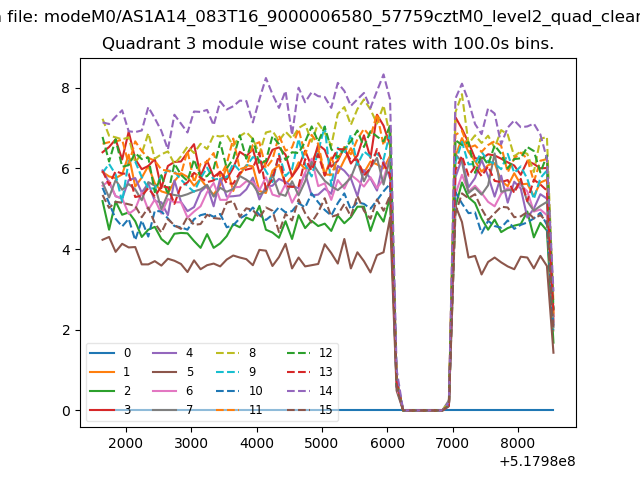
| Module-wise count rates for Quadrant C Data is divided into 100 sec bins |
 |
 |
| Module-wise count rates for Quadrant D Data is divided into 100 sec bins |
 |
 |
| Parameter | Plot |
|---|---|
| CZT HV Monitor | 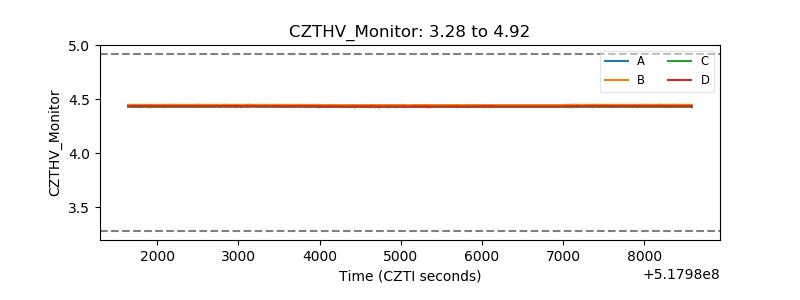 |
| D_VDD | 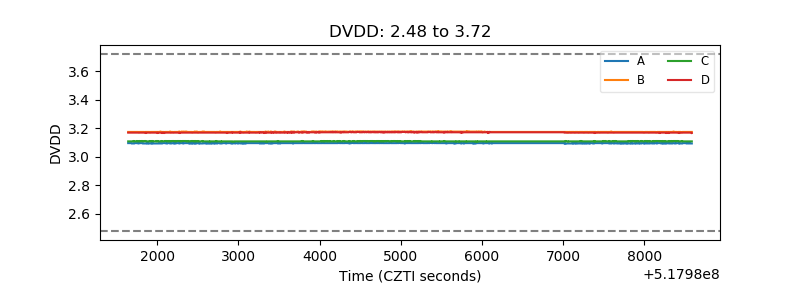 |
| Temperature 1 | 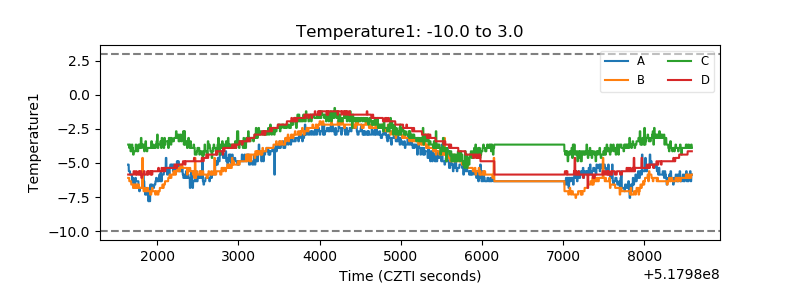 |
| Veto HV Monitor |  |
| Veto LLD | 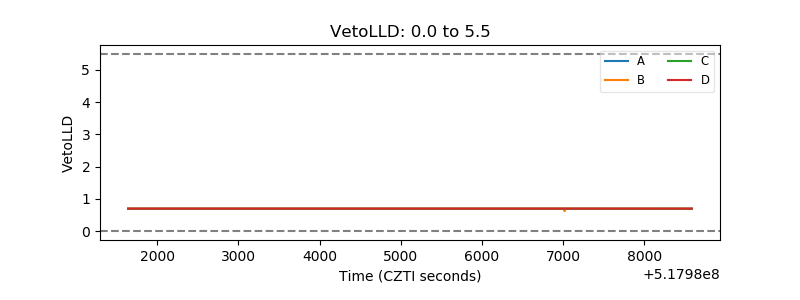 |
| Alpha Counter | 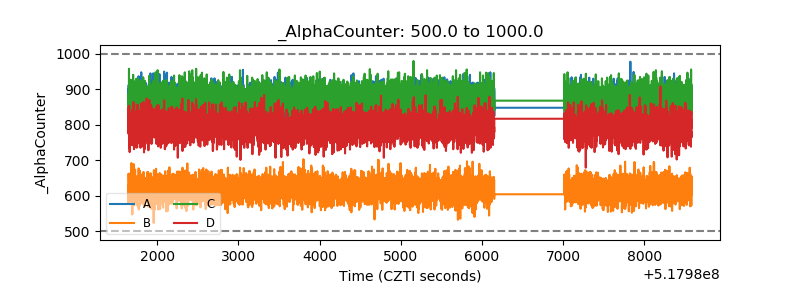 |
| _CPM_Rate | 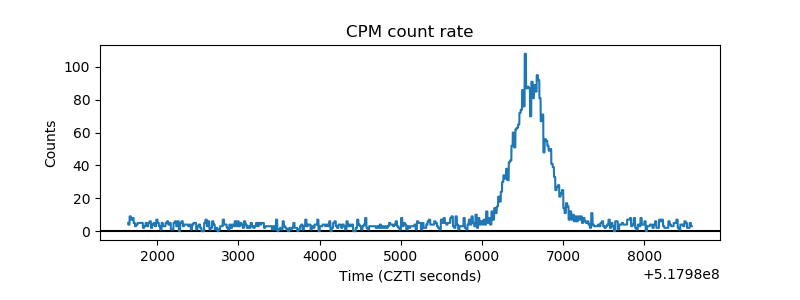 |
| CZT Counter | 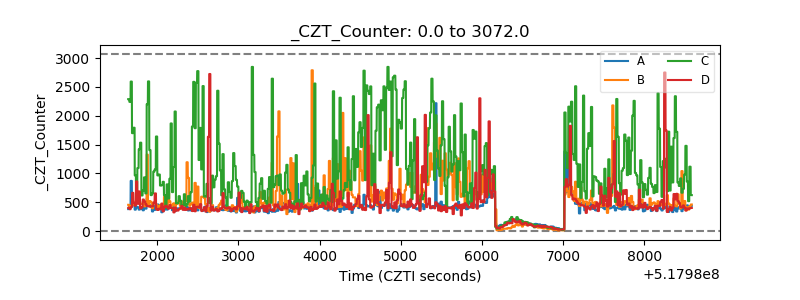 |
| +2.5 Volts monitor | 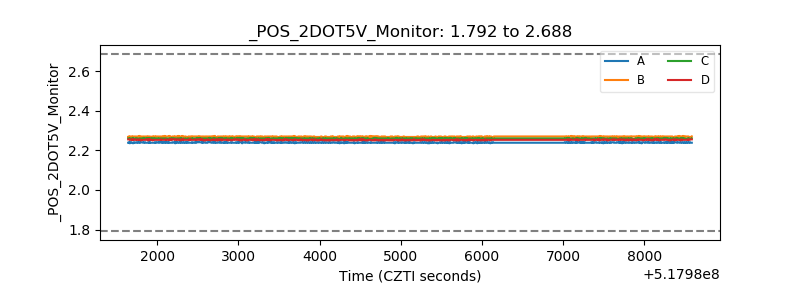 |
| +5 Volts monitor |  |
| _ROLL_ROT | 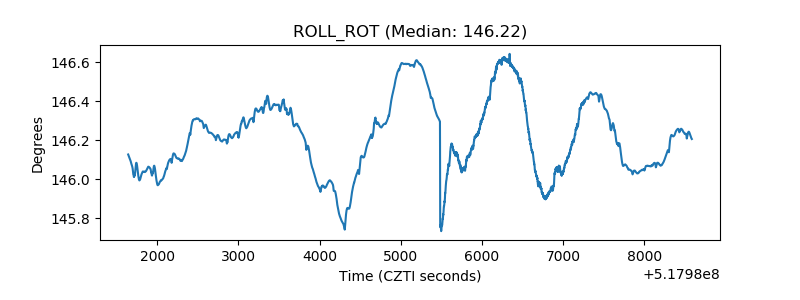 |
| _Roll_DEC | 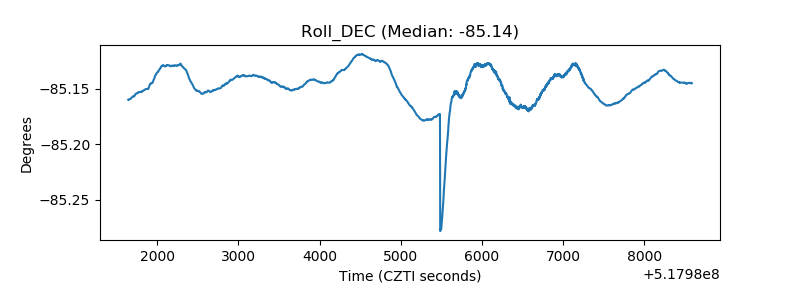 |
| _Roll_RA | 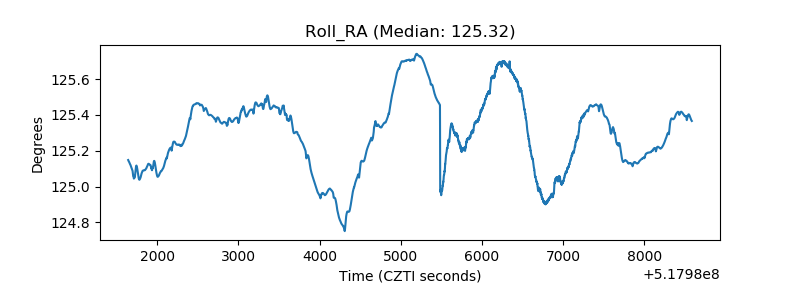 |
| Veto Counter | 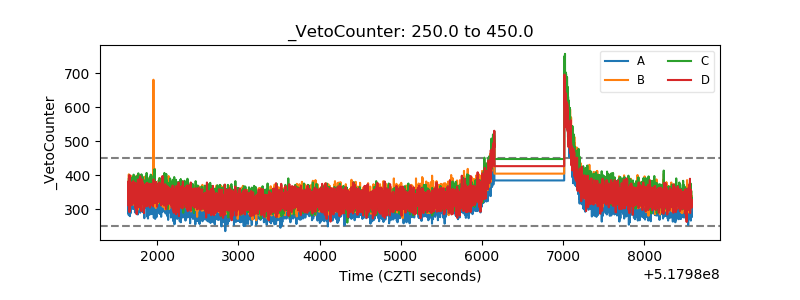 |