| Param | Original file | Final file |
|---|---|---|
| Filename | modeM0/AS1A14_083T16_9000006580_57760cztM0_level2.fits | modeM0/AS1A14_083T16_9000006580_57760cztM0_level2_quad_clean.evt |
| Size (bytes) | 538,441,920 | 93,144,960 |
| Size | 513.5 MB | 88.8 MB |
| Events in quadrant A | 3,060,473 | 616,995 |
| Events in quadrant B | 5,478,472 | 625,273 |
| Events in quadrant C | 6,120,352 | 573,323 |
| Events in quadrant D | 4,751,272 | 536,927 |
| Mode SS | |||
|---|---|---|---|
| Quadrant | BADHDUFLAG | Total packets | Discarded packets |
| A | 0 | 136 | 0 |
| B | 0 | 136 | 0 |
| C | 0 | 136 | 0 |
| D | 0 | 136 | 0 |
| Mode M0 | |||
|---|---|---|---|
| Quadrant | BADHDUFLAG | Total packets | Discarded packets |
| A | 0 | 14271 | 1 |
| B | 0 | 21062 | 1 |
| C | 0 | 22911 | 1 |
| D | 0 | 18993 | 1 |
| Mode M9 | |||
|---|---|---|---|
| Quadrant | BADHDUFLAG | Total packets | Discarded packets |
| A | 0 | 3 | 0 |
| B | 0 | 3 | 0 |
| C | 0 | 3 | 0 |
| D | 0 | 3 | 0 |
| Quadrant | Total seconds | Saturated seconds | Saturation percentage |
|---|---|---|---|
| A | 6710 | 226 | 3.368107% |
| B | 6710 | 686 | 10.223547% |
| C | 6710 | 533 | 7.943368% |
| D | 6710 | 536 | 7.988077% |
Noise dominated data is calculated using 1-second bins in cleaned event files. If a bin has >2000 counts, and if more than 50% of those come from <1% of pixels, then it is considered to be noise-dominated and hence unusable.
| Quadrant | # 1 sec bins | Bins with >0 counts | Bins with >2000 counts | High rate bins dominated by noise | Noise dominated (total time) | Noise dominated (detector-on time) | Marked lightcurve |
|---|---|---|---|---|---|---|---|
| A | 6995 | 6711 | 11 | 11 | 0.16% | 0.16% | 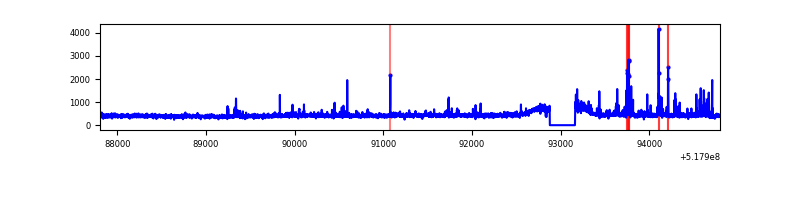 |
| B | 6995 | 6711 | 281 | 281 | 4.02% | 4.19% | 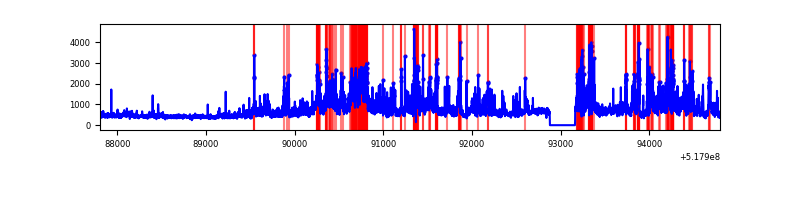 |
| C | 6995 | 6711 | 268 | 268 | 3.83% | 3.99% | 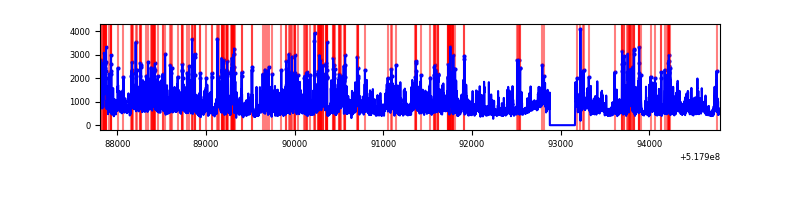 |
| D | 6995 | 6711 | 356 | 356 | 5.09% | 5.30% | 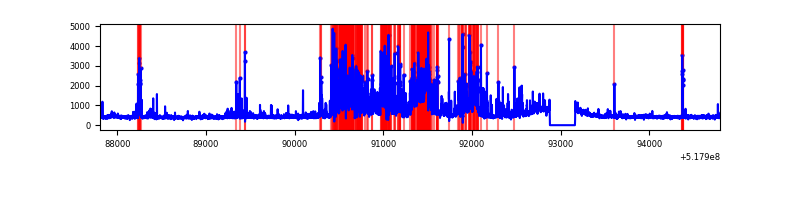 |
Top three noisy pixels from each quadrant. If the there are fewer than three noisy pixels in the level2.evt file, extra rows are filled as -1
| Pixel properties | Quadrant properties | ||||||
|---|---|---|---|---|---|---|---|
| Quadrant | DetID | PixID | Counts | Sigma | Mean | Median | Sigma |
| A | 3 | 61 | 116346 | 649.24 | 721 | 700 | 178.1 |
| A | 3 | 245 | 67090 | 372.72 | 721 | 700 | 178.1 |
| A | 3 | 128 | 38269 | 210.91 | 721 | 700 | 178.1 |
| B | 10 | 16 | 948554 | 6368.16 | 691 | 665 | 148.8 |
| B | 4 | 80 | 572268 | 3840.17 | 691 | 665 | 148.8 |
| B | 4 | 142 | 512466 | 3438.41 | 691 | 665 | 148.8 |
| C | 15 | 224 | 1403327 | 7493.76 | 691 | 683 | 187.2 |
| C | 9 | 38 | 958294 | 5116.13 | 691 | 683 | 187.2 |
| C | 12 | 254 | 828387 | 4422.09 | 691 | 683 | 187.2 |
| D | 2 | 153 | 758372 | 3944.62 | 690 | 659 | 192.1 |
| D | 2 | 31 | 604131 | 3141.65 | 690 | 659 | 192.1 |
| D | 3 | 12 | 342178 | 1777.93 | 690 | 659 | 192.1 |
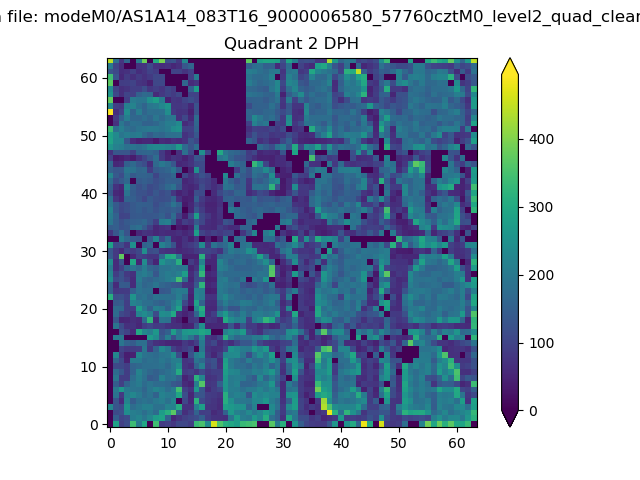
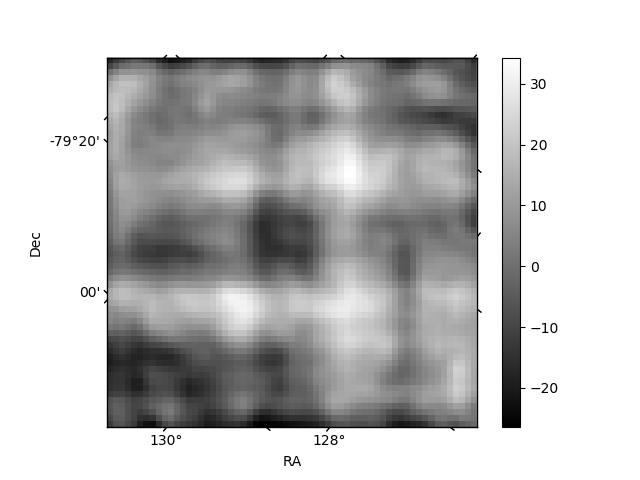
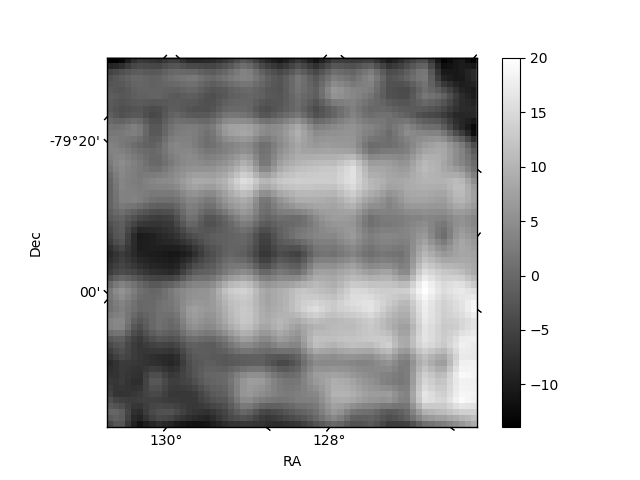
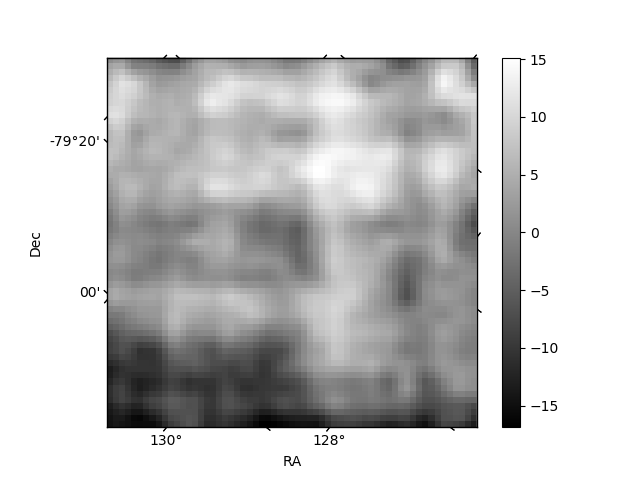
Histogram calculated using DETX and DETY for each event in the final _common_clean file
| Quadrant A | 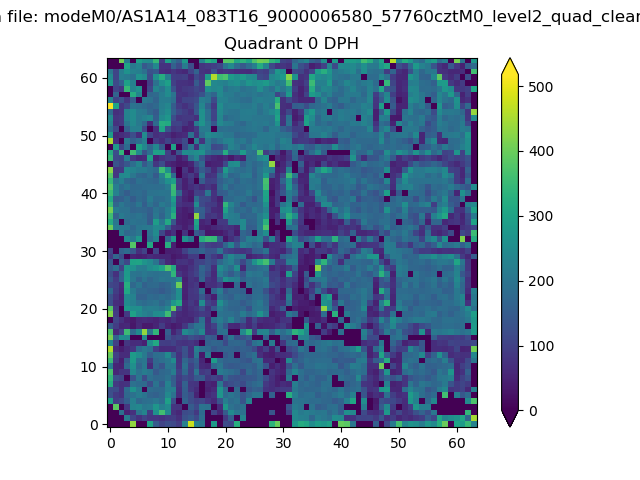 |
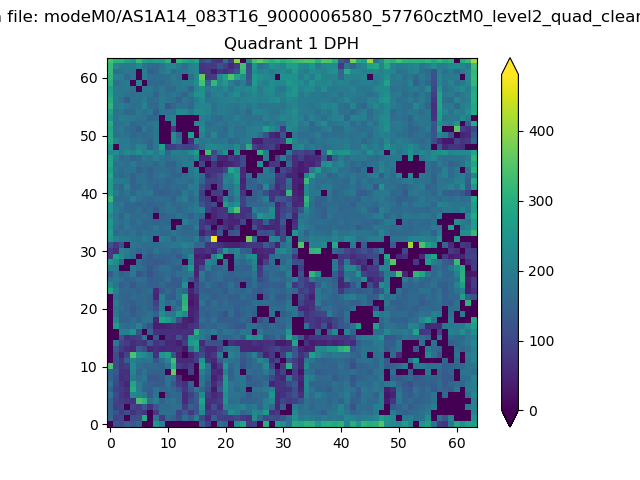 |
Quadrant B |
|---|---|---|---|
| Quadrant D | 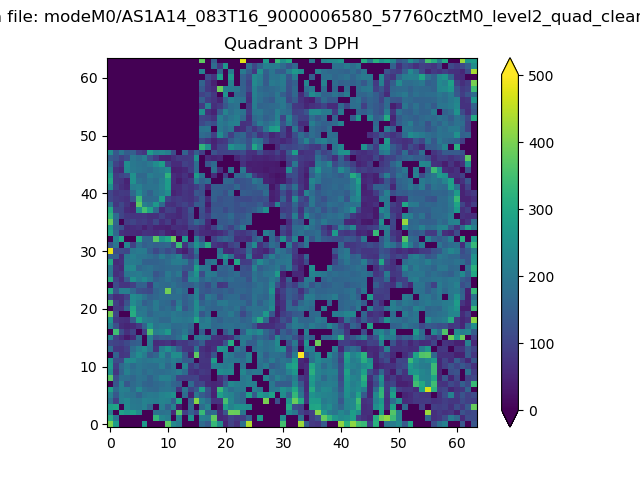 |
 |
Quadrant C |
| Plot type | Count rate plots | Images |
|---|---|---|
| Comparison with Poisson distribution Blue bars denote a histogram of data divided into 1 sec bins. Red curve is a Poisson curve with rate = median count rate of data. |
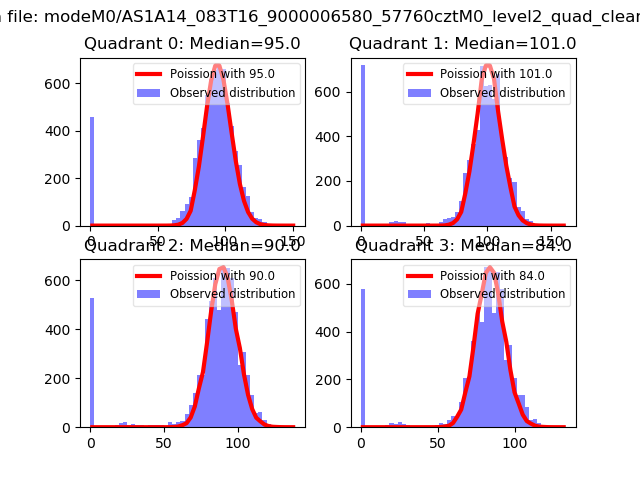 |
 |
| Quadrant-wise count rates Data is divided into 100 sec bins |
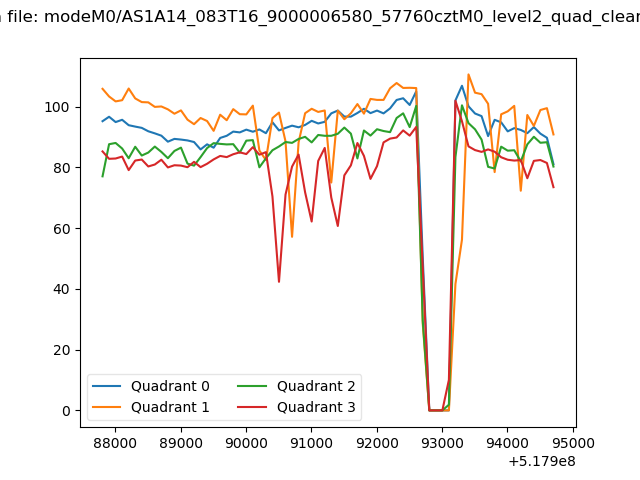 |
|
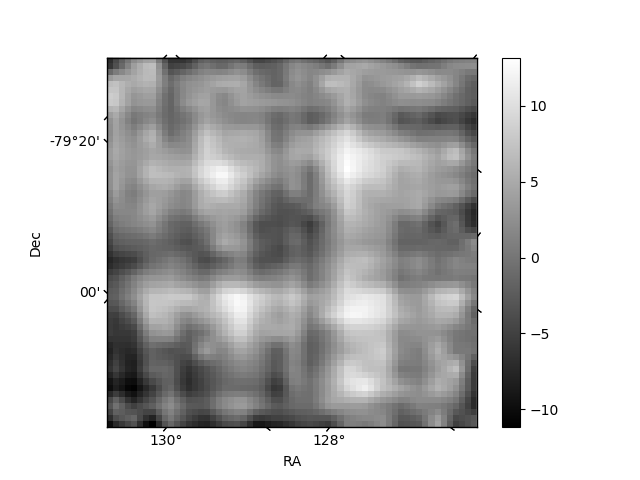
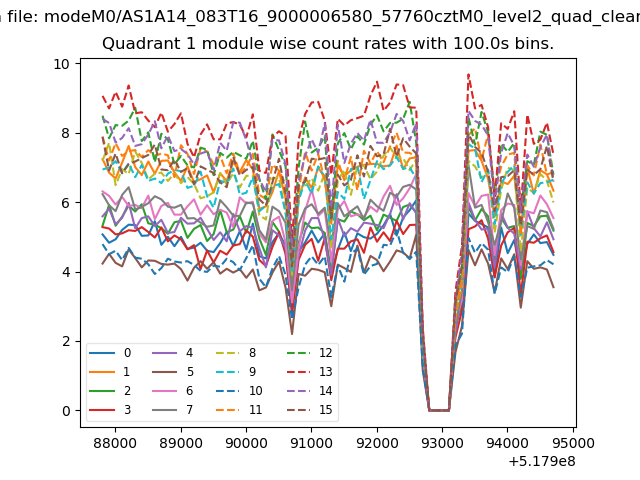
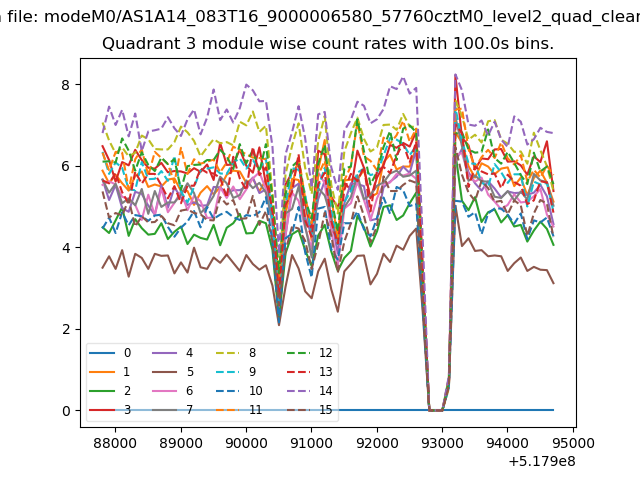
| Module-wise count rates for Quadrant A Data is divided into 100 sec bins |
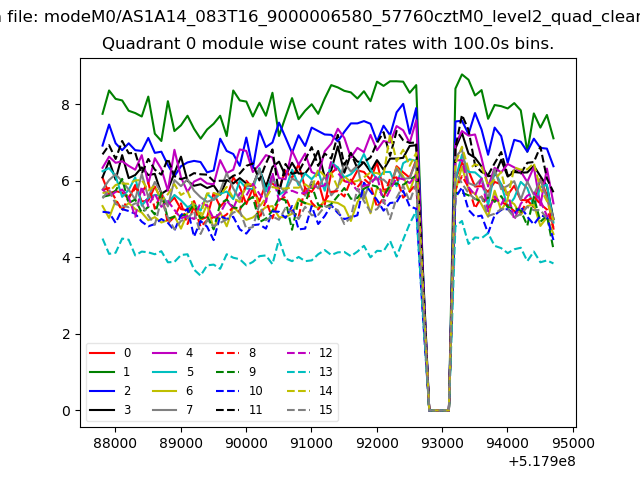 |
 |
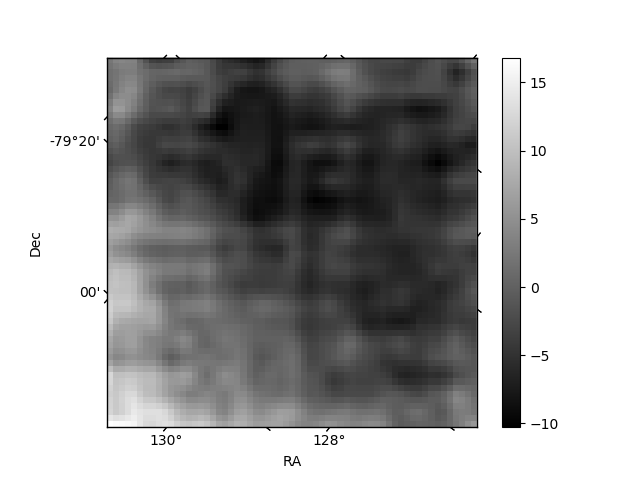
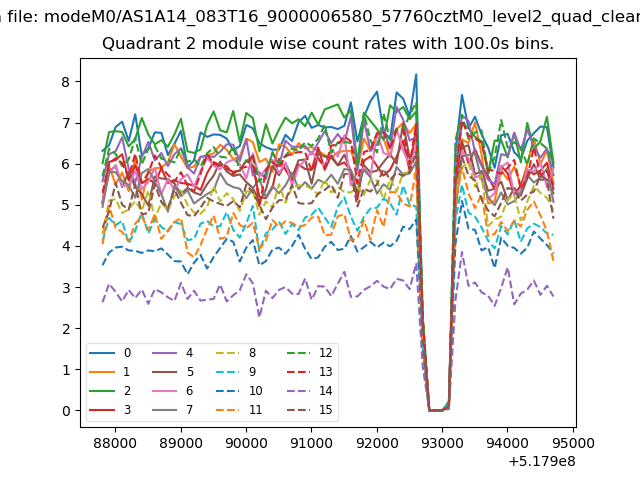
| Module-wise count rates for Quadrant B Data is divided into 100 sec bins |
 |
 |
| Module-wise count rates for Quadrant C Data is divided into 100 sec bins |
 |
 |
| Module-wise count rates for Quadrant D Data is divided into 100 sec bins |
 |
 |
| Parameter | Plot |
|---|---|
| CZT HV Monitor | 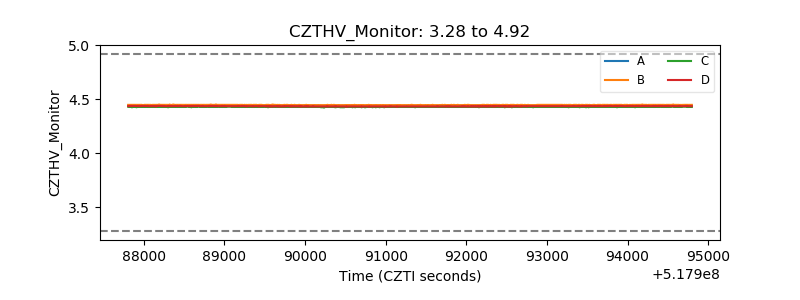 |
| D_VDD | 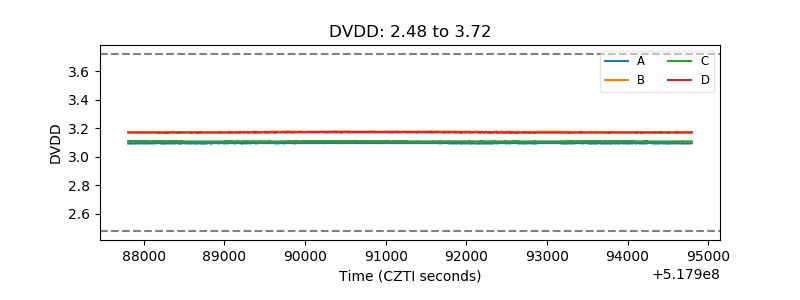 |
| Temperature 1 | 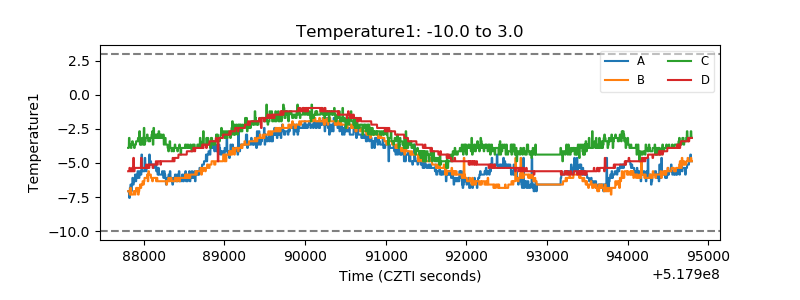 |
| Veto HV Monitor | 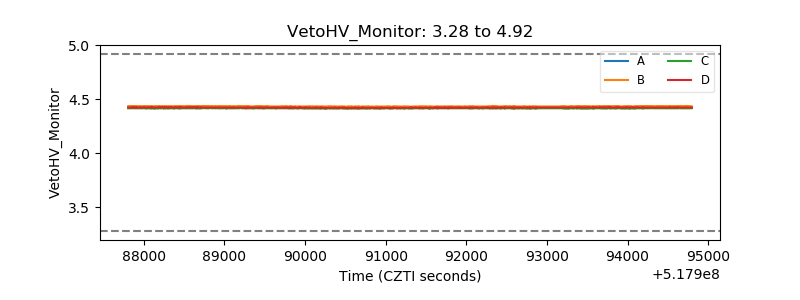 |
| Veto LLD | 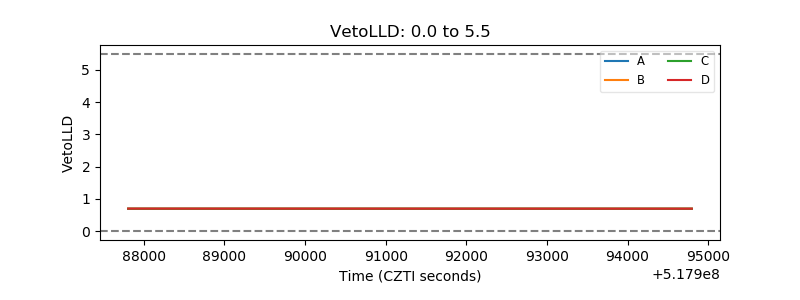 |
| Alpha Counter | 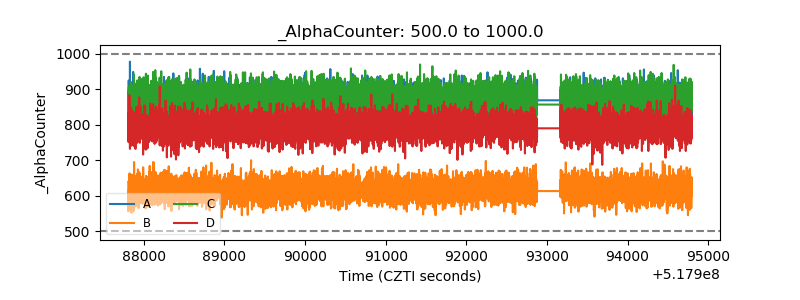 |
| _CPM_Rate | 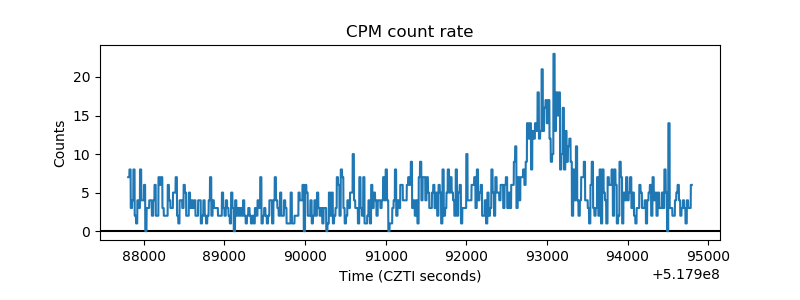 |
| CZT Counter | 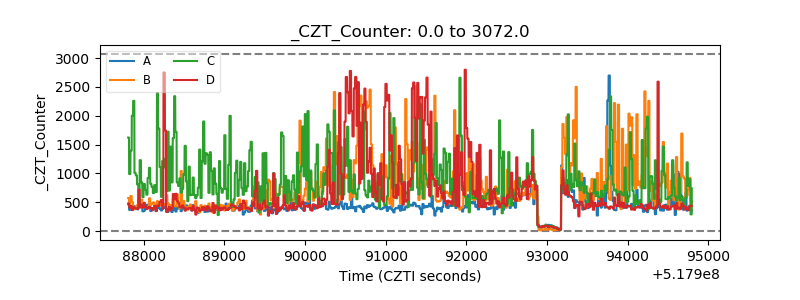 |
| +2.5 Volts monitor | 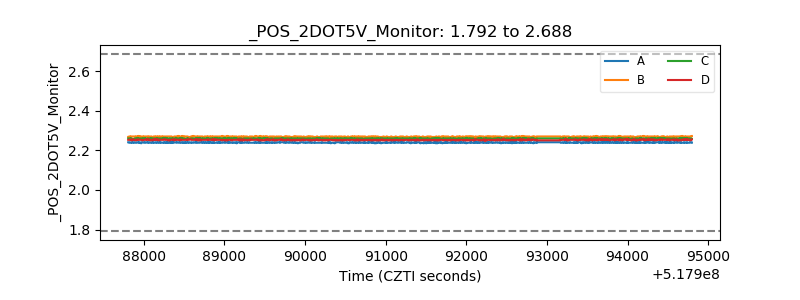 |
| +5 Volts monitor | 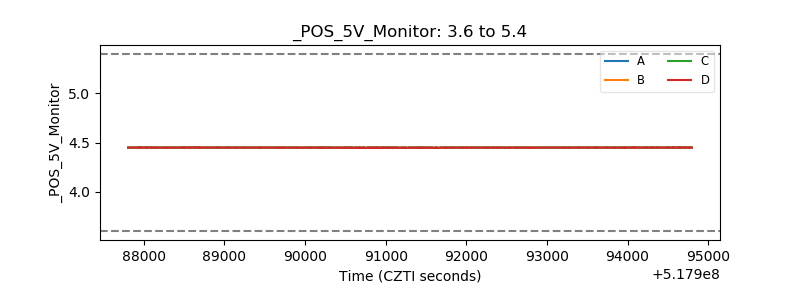 |
| _ROLL_ROT | 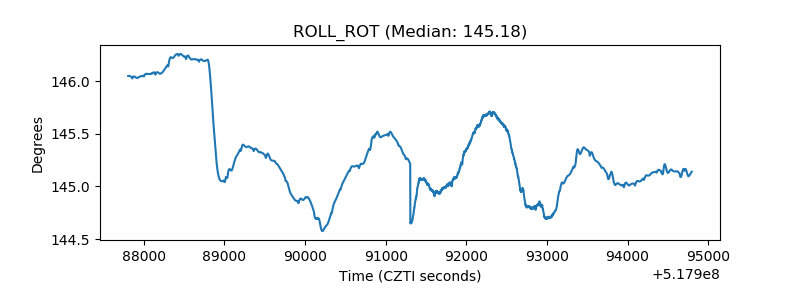 |
| _Roll_DEC | 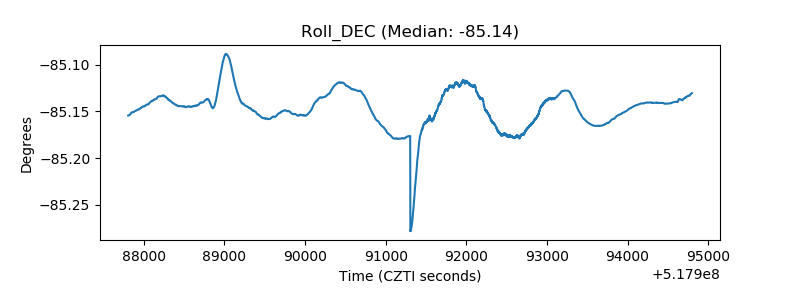 |
| _Roll_RA | 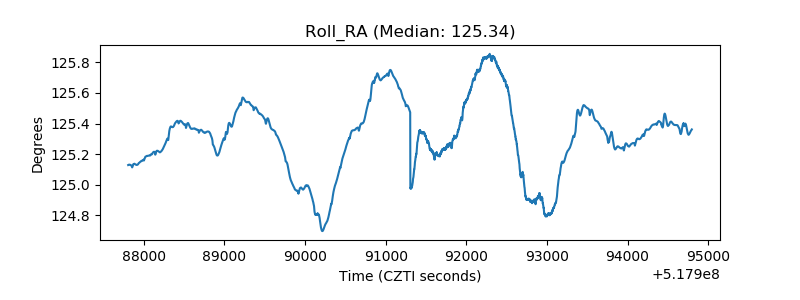 |
| Veto Counter | 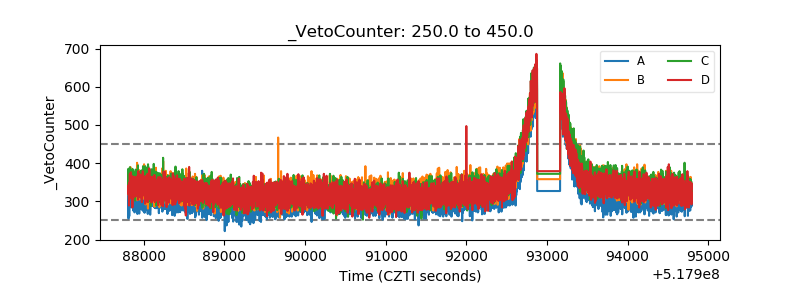 |