| Param | Original file | Final file |
|---|---|---|
| Filename | modeM0/AS1A14_083T16_9000006580_57761cztM0_level2.fits | modeM0/AS1A14_083T16_9000006580_57761cztM0_level2_quad_clean.evt |
| Size (bytes) | 540,518,400 | 104,074,560 |
| Size | 515.5 MB | 99.3 MB |
| Events in quadrant A | 3,264,089 | 689,967 |
| Events in quadrant B | 4,930,694 | 732,807 |
| Events in quadrant C | 6,673,798 | 606,989 |
| Events in quadrant D | 4,568,249 | 608,841 |
| Mode SS | |||
|---|---|---|---|
| Quadrant | BADHDUFLAG | Total packets | Discarded packets |
| A | 0 | 148 | 0 |
| B | 0 | 148 | 0 |
| C | 0 | 148 | 0 |
| D | 0 | 148 | 0 |
| Mode M0 | |||
|---|---|---|---|
| Quadrant | BADHDUFLAG | Total packets | Discarded packets |
| A | 0 | 15339 | 0 |
| B | 0 | 19628 | 0 |
| C | 0 | 24911 | 1 |
| D | 0 | 18833 | 0 |
| Quadrant | Total seconds | Saturated seconds | Saturation percentage |
|---|---|---|---|
| A | 7362 | 27 | 0.366748% |
| B | 7363 | 226 | 3.069401% |
| C | 7362 | 786 | 10.676447% |
| D | 7362 | 239 | 3.246400% |
Noise dominated data is calculated using 1-second bins in cleaned event files. If a bin has >2000 counts, and if more than 50% of those come from <1% of pixels, then it is considered to be noise-dominated and hence unusable.
| Quadrant | # 1 sec bins | Bins with >0 counts | Bins with >2000 counts | High rate bins dominated by noise | Noise dominated (total time) | Noise dominated (detector-on time) | Marked lightcurve |
|---|---|---|---|---|---|---|---|
| A | 7362 | 7362 | 15 | 15 | 0.20% | 0.20% |  |
| B | 7363 | 7363 | 145 | 145 | 1.97% | 1.97% |  |
| C | 7362 | 7362 | 552 | 552 | 7.50% | 7.50% |  |
| D | 7362 | 7362 | 255 | 255 | 3.46% | 3.46% |  |
Top three noisy pixels from each quadrant. If the there are fewer than three noisy pixels in the level2.evt file, extra rows are filled as -1
| Pixel properties | Quadrant properties | ||||||
|---|---|---|---|---|---|---|---|
| Quadrant | DetID | PixID | Counts | Sigma | Mean | Median | Sigma |
| A | 3 | 61 | 144525 | 748.25 | 777 | 755 | 192.1 |
| A | 3 | 128 | 36123 | 184.07 | 777 | 755 | 192.1 |
| A | 3 | 245 | 31054 | 157.69 | 777 | 755 | 192.1 |
| B | 10 | 16 | 634365 | 3865.05 | 766 | 736 | 163.9 |
| B | 4 | 80 | 626702 | 3818.31 | 766 | 736 | 163.9 |
| B | 4 | 142 | 208775 | 1269.01 | 766 | 736 | 163.9 |
| C | 15 | 224 | 2487374 | 12627.42 | 728 | 721 | 196.9 |
| C | 12 | 254 | 568915 | 2885.33 | 728 | 721 | 196.9 |
| C | 9 | 38 | 565273 | 2866.84 | 728 | 721 | 196.9 |
| D | 2 | 153 | 933409 | 4392.89 | 751 | 716 | 212.3 |
| D | 2 | 249 | 225807 | 1060.15 | 751 | 716 | 212.3 |
| D | 3 | 12 | 136004 | 637.19 | 751 | 716 | 212.3 |
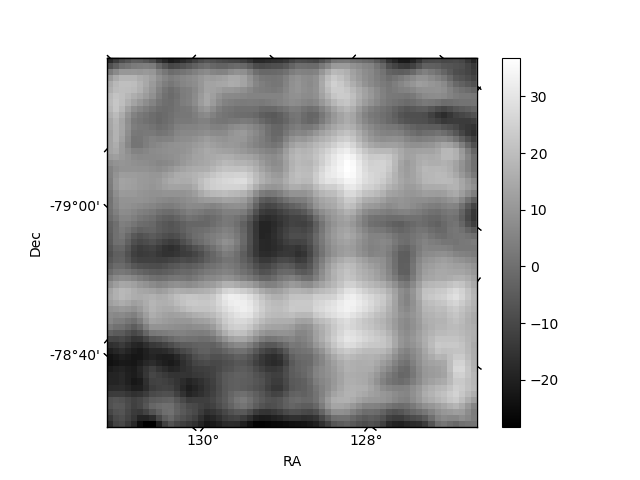
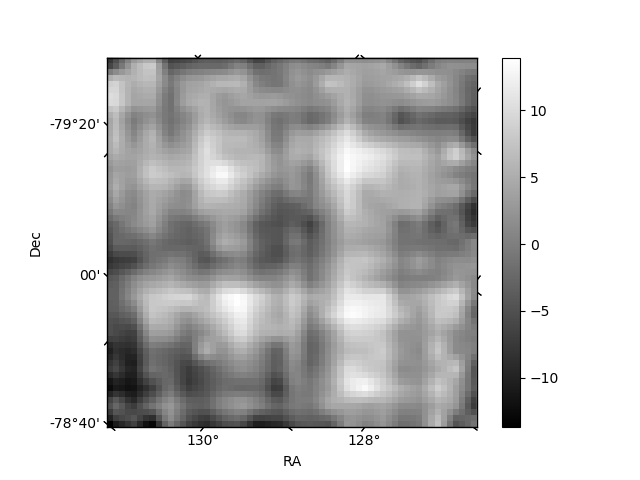
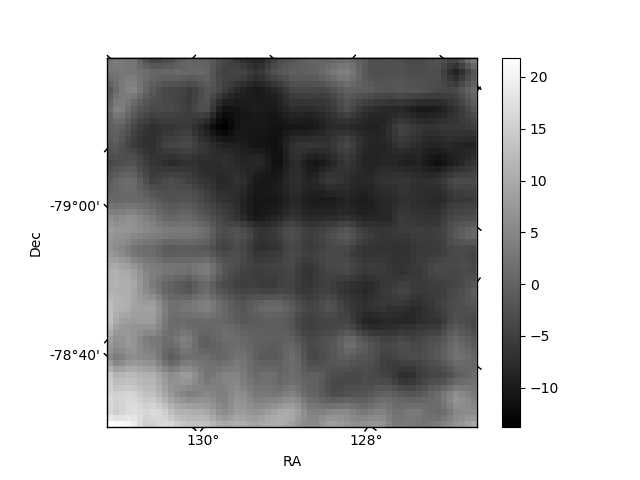
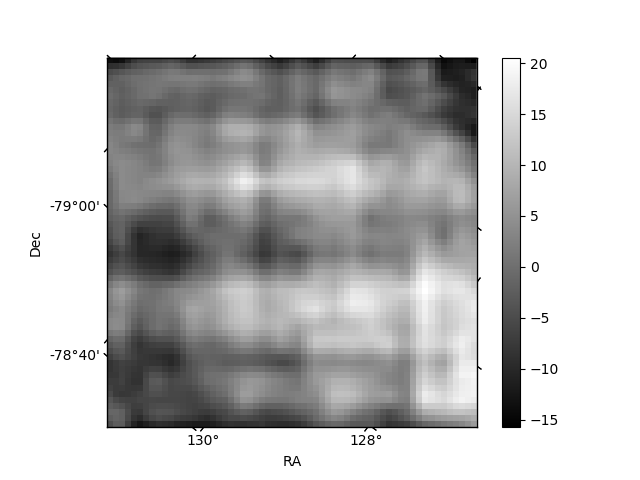
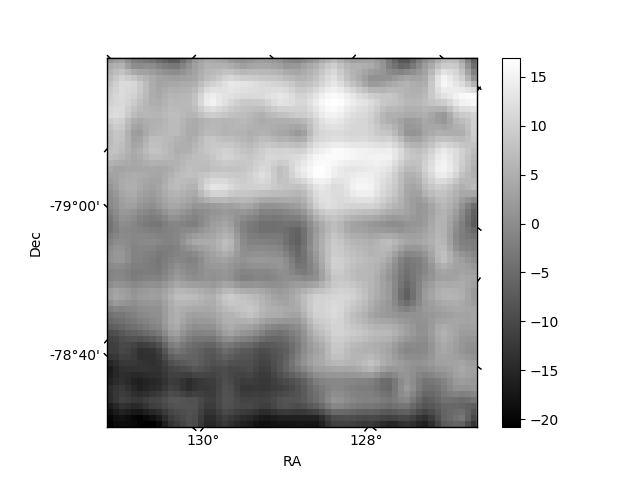
Histogram calculated using DETX and DETY for each event in the final _common_clean file
| Quadrant A | 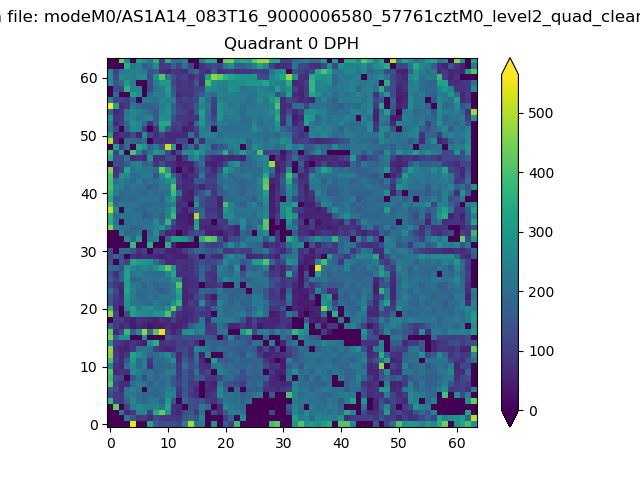 |
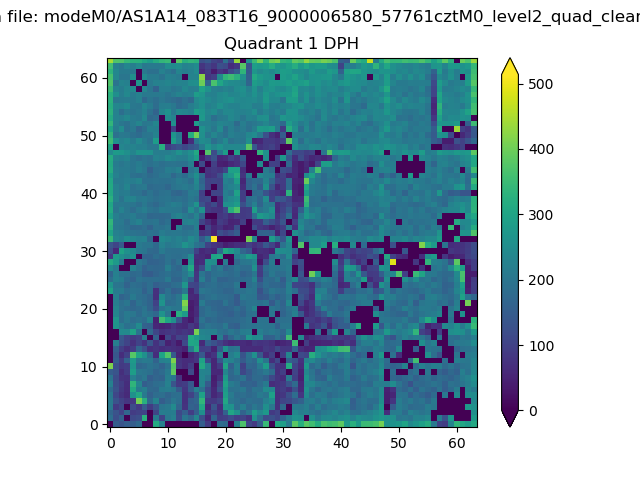 |
Quadrant B |
|---|---|---|---|
| Quadrant D | 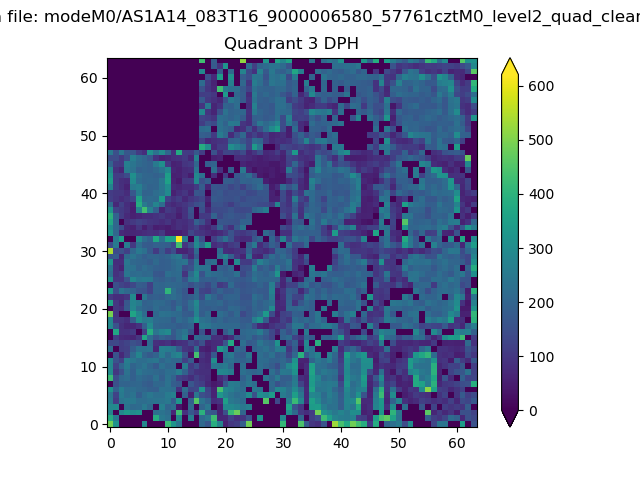 |
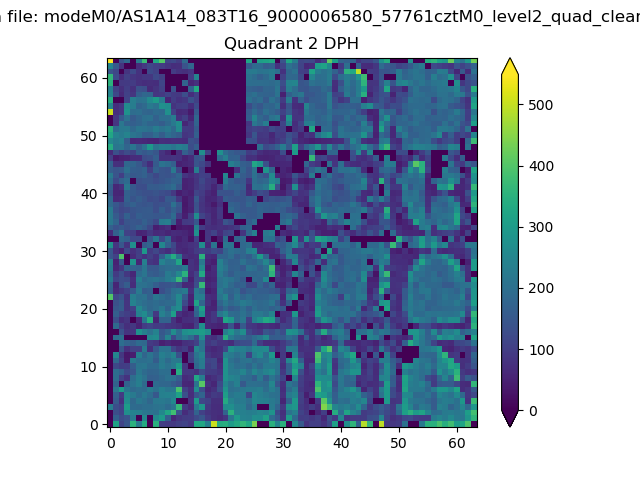 |
Quadrant C |
| Plot type | Count rate plots | Images |
|---|---|---|
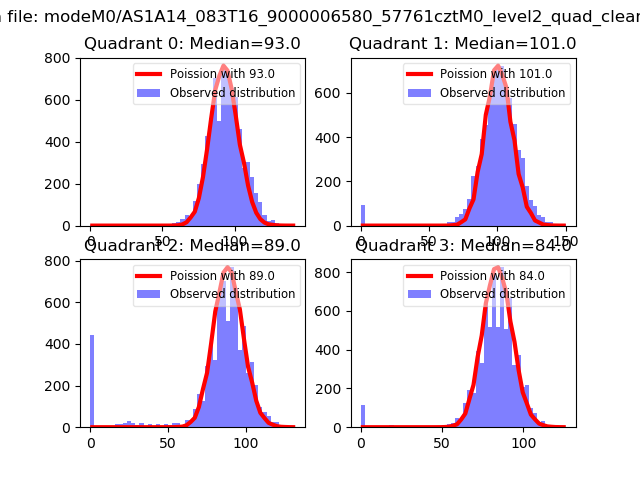
| Comparison with Poisson distribution Blue bars denote a histogram of data divided into 1 sec bins. Red curve is a Poisson curve with rate = median count rate of data. |
 |
 |
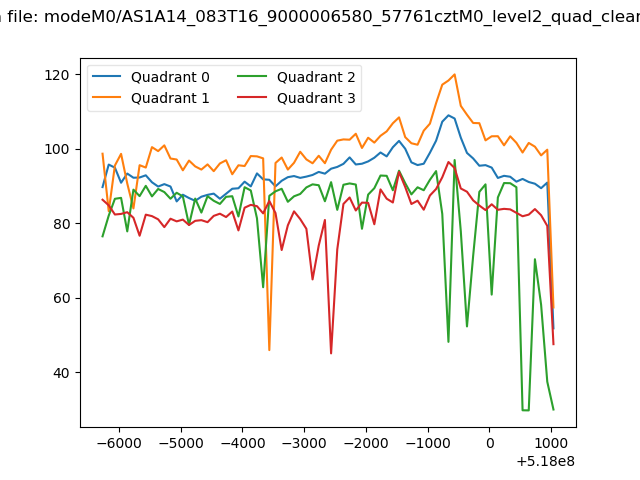
| Quadrant-wise count rates Data is divided into 100 sec bins |
 |
|
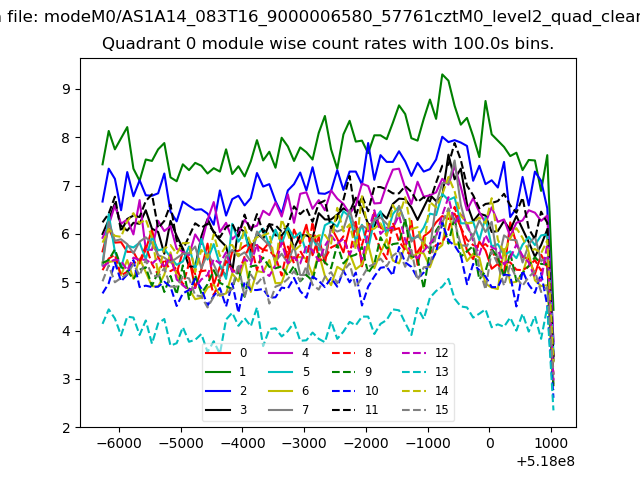
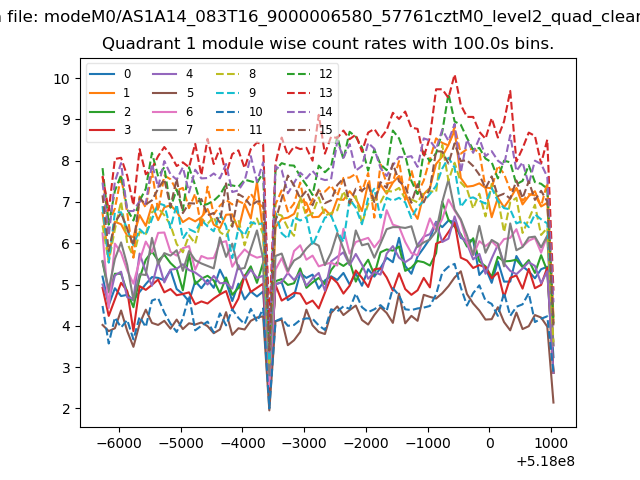
| Module-wise count rates for Quadrant A Data is divided into 100 sec bins |
 |
 |
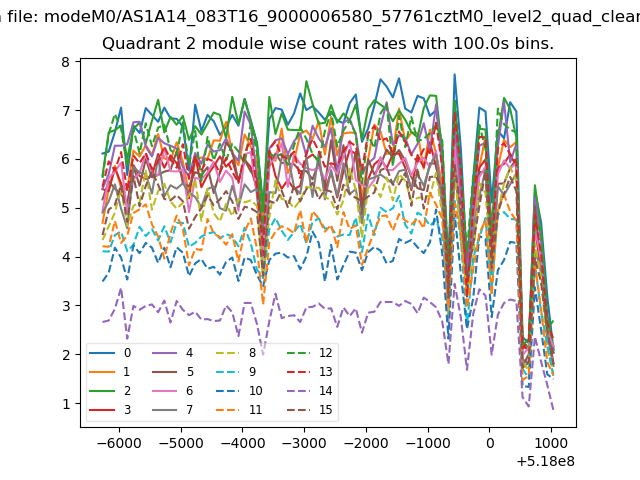
| Module-wise count rates for Quadrant B Data is divided into 100 sec bins |
 |
 |
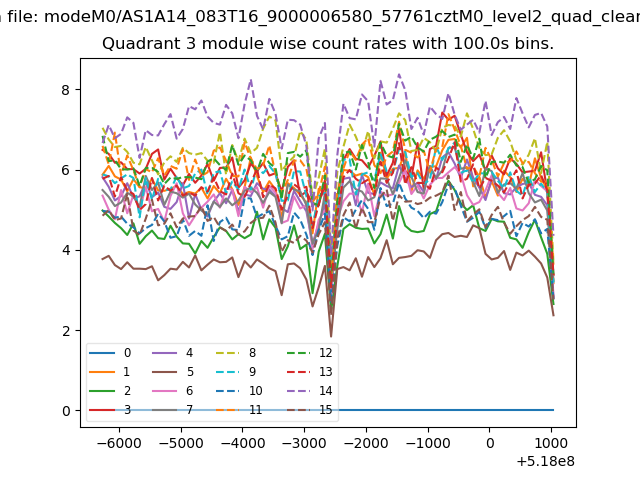
| Module-wise count rates for Quadrant C Data is divided into 100 sec bins |
 |
 |
| Module-wise count rates for Quadrant D Data is divided into 100 sec bins |
 |
 |
| Parameter | Plot |
|---|---|
| CZT HV Monitor | 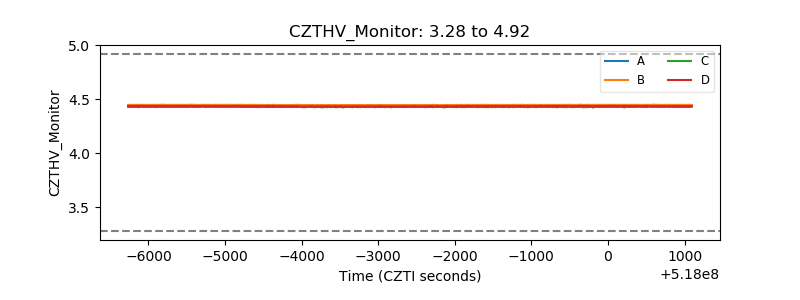 |
| D_VDD | 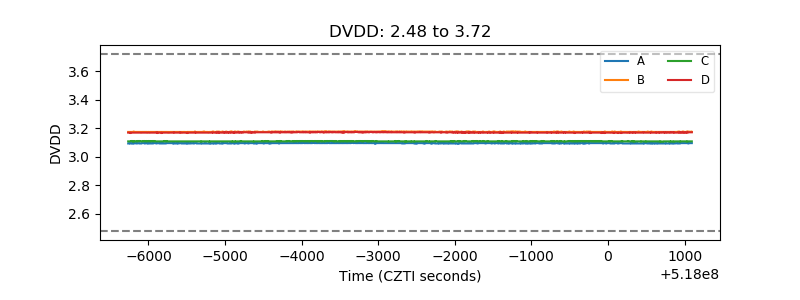 |
| Temperature 1 | 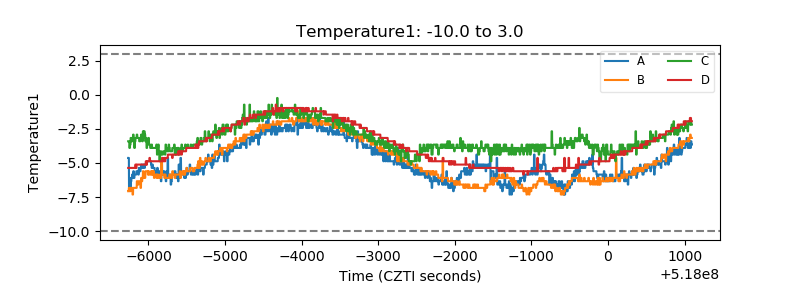 |
| Veto HV Monitor |  |
| Veto LLD | 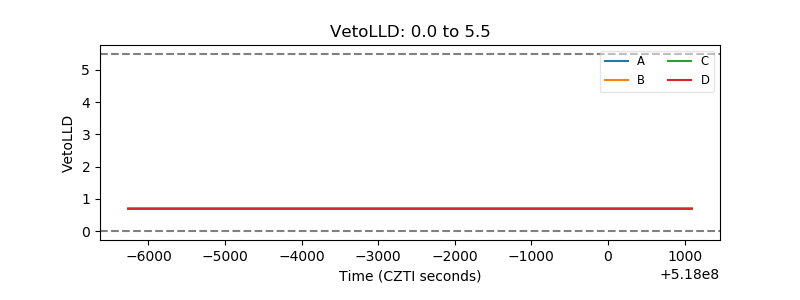 |
| Alpha Counter | 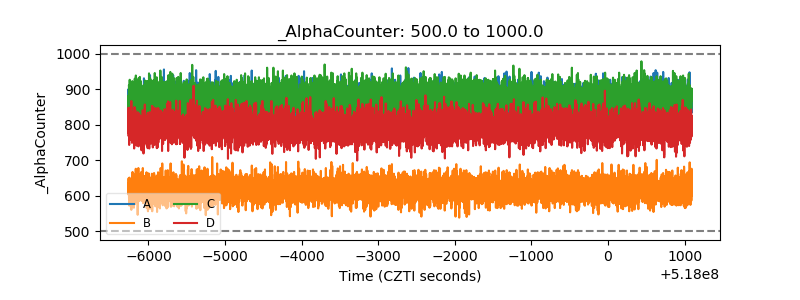 |
| _CPM_Rate | 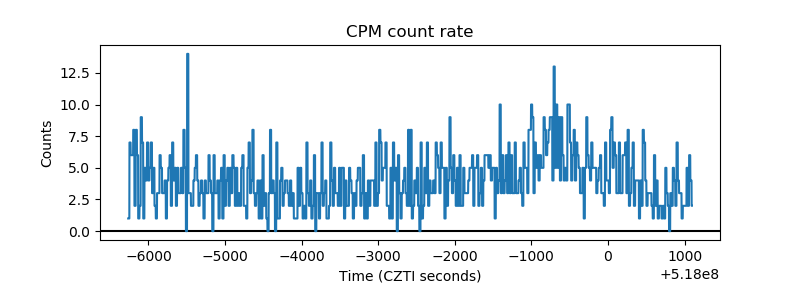 |
| CZT Counter | 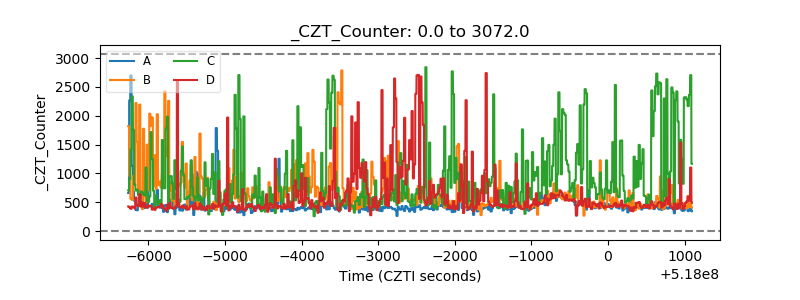 |
| +2.5 Volts monitor | 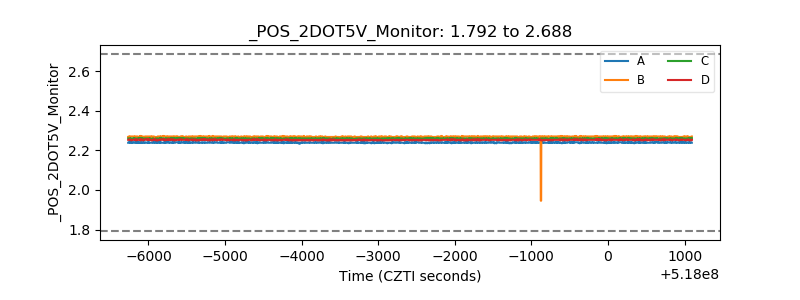 |
| +5 Volts monitor | 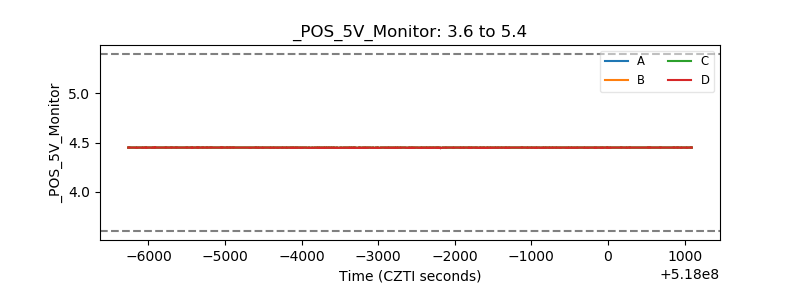 |
| _ROLL_ROT | 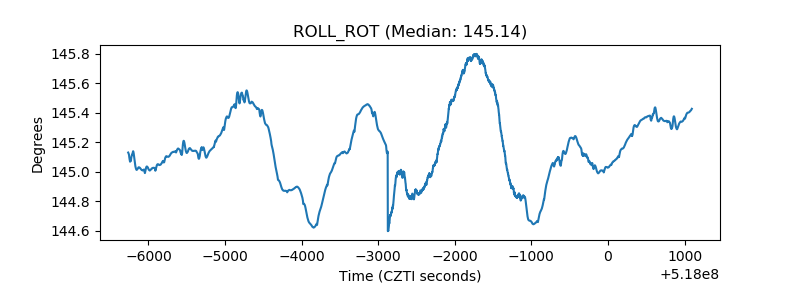 |
| _Roll_DEC | 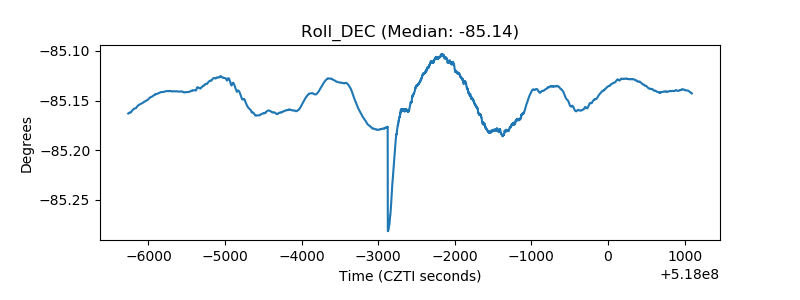 |
| _Roll_RA | 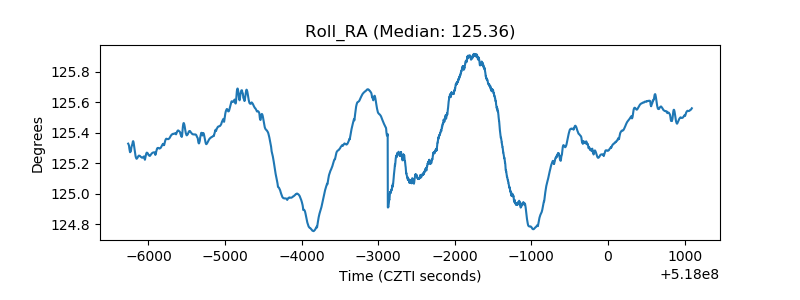 |
| Veto Counter | 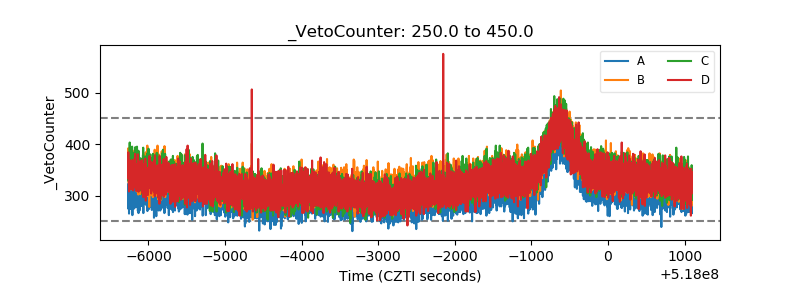 |