| Param | Original file | Final file |
|---|---|---|
| Filename | modeM0/AS1A14_083T16_9000006580_57771cztM0_level2.fits | modeM0/AS1A14_083T16_9000006580_57771cztM0_level2_quad_clean.evt |
| Size (bytes) | 472,596,480 | 95,235,840 |
| Size | 450.7 MB | 90.8 MB |
| Events in quadrant A | 2,934,274 | 645,974 |
| Events in quadrant B | 3,456,744 | 686,494 |
| Events in quadrant C | 7,543,712 | 535,944 |
| Events in quadrant D | 3,064,498 | 570,899 |
| Mode SS | |||
|---|---|---|---|
| Quadrant | BADHDUFLAG | Total packets | Discarded packets |
| A | 0 | 130 | 0 |
| B | 0 | 130 | 0 |
| C | 0 | 130 | 0 |
| D | 0 | 130 | 0 |
| Mode M0 | |||
|---|---|---|---|
| Quadrant | BADHDUFLAG | Total packets | Discarded packets |
| A | 0 | 13424 | 3 |
| B | 0 | 14707 | 2 |
| C | 0 | 26877 | 2 |
| D | 0 | 13783 | 2 |
| Mode M9 | |||
|---|---|---|---|
| Quadrant | BADHDUFLAG | Total packets | Discarded packets |
| A | 0 | 19 | 0 |
| B | 0 | 19 | 0 |
| C | 0 | 20 | 0 |
| D | 0 | 20 | 0 |
| Quadrant | Total seconds | Saturated seconds | Saturation percentage |
|---|---|---|---|
| A | 6366 | 24 | 0.377003% |
| B | 6366 | 148 | 2.324851% |
| C | 6366 | 1133 | 17.797675% |
| D | 6366 | 54 | 0.848256% |
Noise dominated data is calculated using 1-second bins in cleaned event files. If a bin has >2000 counts, and if more than 50% of those come from <1% of pixels, then it is considered to be noise-dominated and hence unusable.
| Quadrant | # 1 sec bins | Bins with >0 counts | Bins with >2000 counts | High rate bins dominated by noise | Noise dominated (total time) | Noise dominated (detector-on time) | Marked lightcurve |
|---|---|---|---|---|---|---|---|
| A | 7566 | 6367 | 4 | 4 | 0.05% | 0.06% | 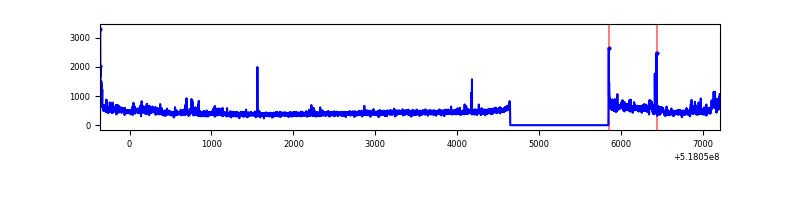 |
| B | 7566 | 6367 | 57 | 57 | 0.75% | 0.90% | 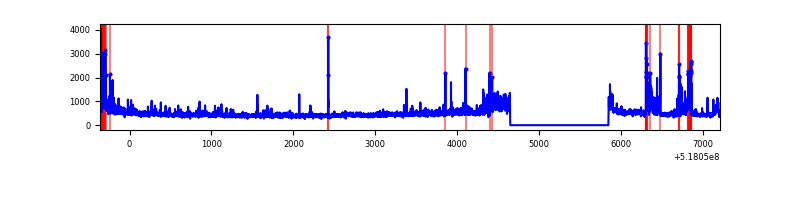 |
| C | 7566 | 6367 | 897 | 897 | 11.86% | 14.09% | 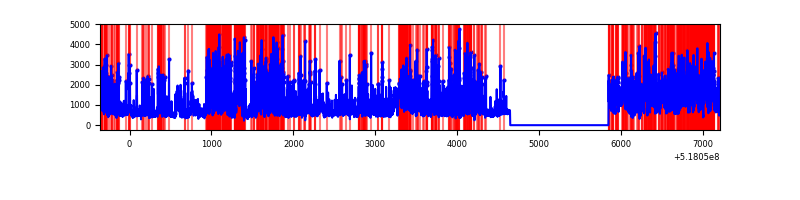 |
| D | 7566 | 6367 | 32 | 32 | 0.42% | 0.50% | 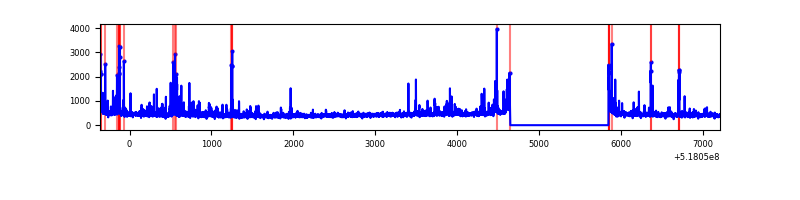 |
Top three noisy pixels from each quadrant. If the there are fewer than three noisy pixels in the level2.evt file, extra rows are filled as -1
| Pixel properties | Quadrant properties | ||||||
|---|---|---|---|---|---|---|---|
| Quadrant | DetID | PixID | Counts | Sigma | Mean | Median | Sigma |
| A | 3 | 14 | 224276 | 1311.54 | 688 | 672 | 170.5 |
| A | 4 | 236 | 16173 | 90.92 | 688 | 672 | 170.5 |
| A | 8 | 6 | 15213 | 85.29 | 688 | 672 | 170.5 |
| B | 10 | 16 | 298240 | 2089.29 | 680 | 655 | 142.4 |
| B | 4 | 80 | 210457 | 1472.98 | 680 | 655 | 142.4 |
| B | 4 | 171 | 66354 | 461.26 | 680 | 655 | 142.4 |
| C | 15 | 224 | 2480014 | 14419.39 | 631 | 626 | 171.9 |
| C | 9 | 38 | 1966913 | 11435.35 | 631 | 626 | 171.9 |
| C | 12 | 249 | 432037 | 2508.96 | 631 | 626 | 171.9 |
| D | 3 | 12 | 126068 | 673.41 | 661 | 631 | 186.3 |
| D | 2 | 153 | 63459 | 337.29 | 661 | 631 | 186.3 |
| D | 2 | 249 | 47888 | 253.7 | 661 | 631 | 186.3 |
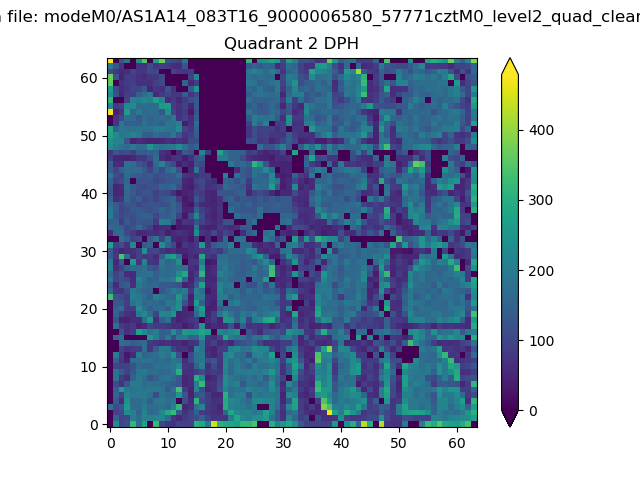
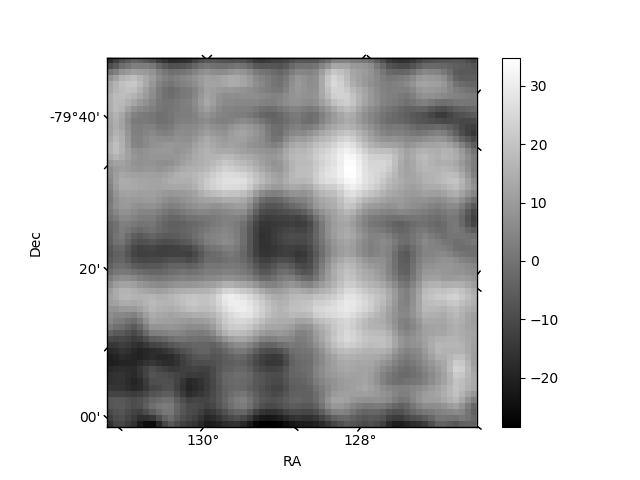
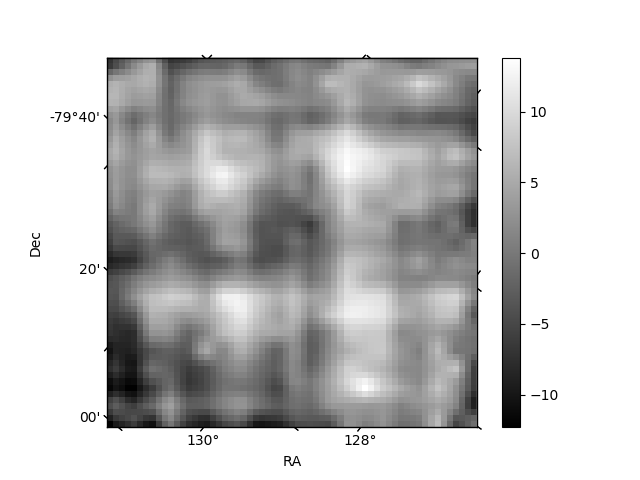
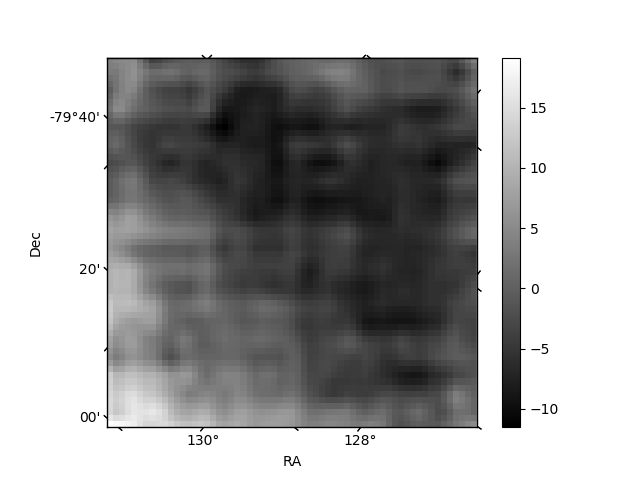
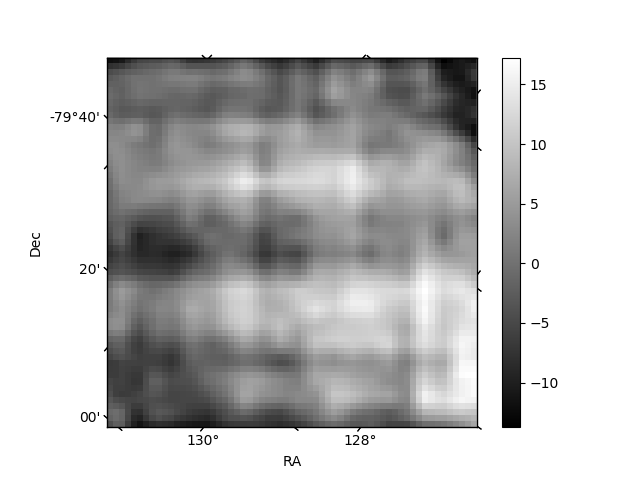
Histogram calculated using DETX and DETY for each event in the final _common_clean file
| Quadrant A | 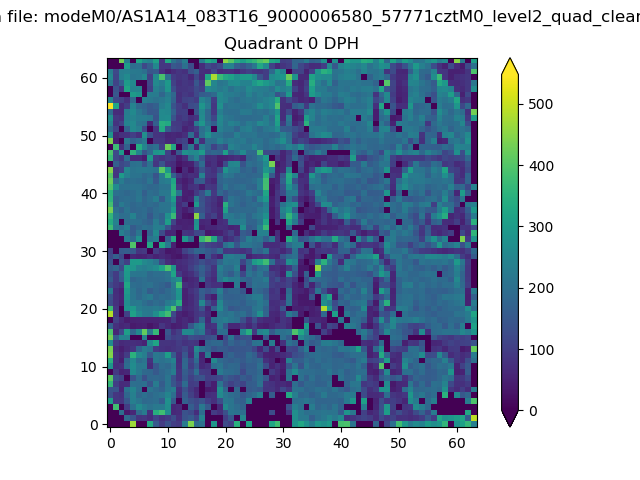 |
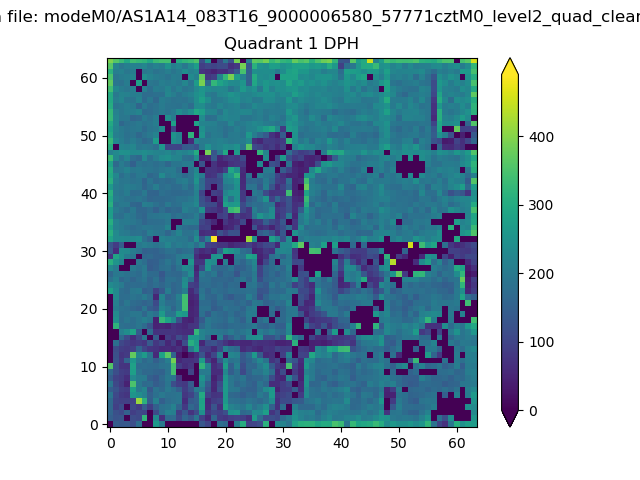 |
Quadrant B |
|---|---|---|---|
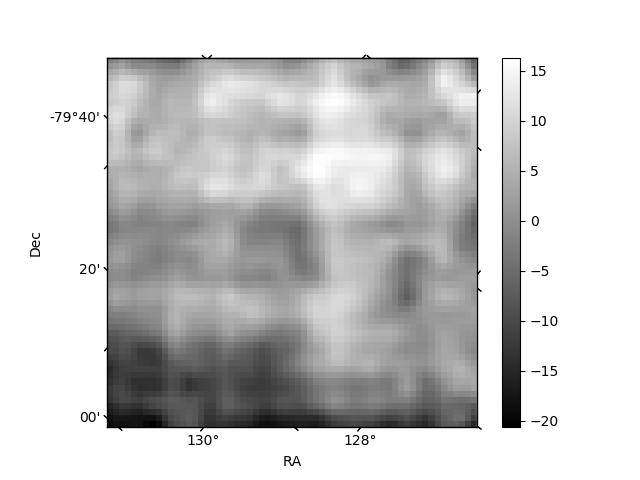
| Quadrant D | 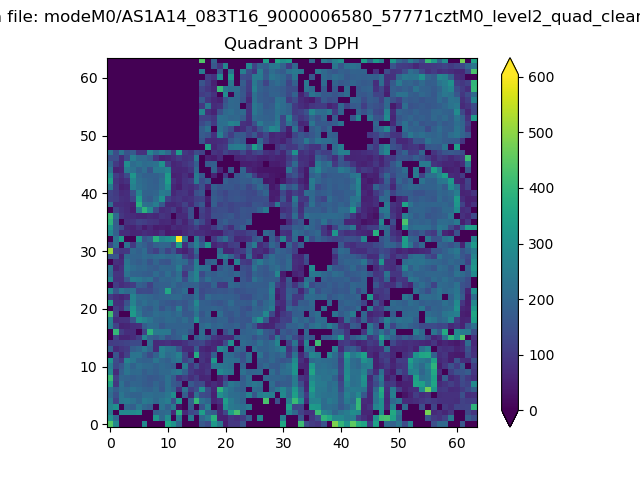 |
 |
Quadrant C |
| Plot type | Count rate plots | Images |
|---|---|---|
| Comparison with Poisson distribution Blue bars denote a histogram of data divided into 1 sec bins. Red curve is a Poisson curve with rate = median count rate of data. |
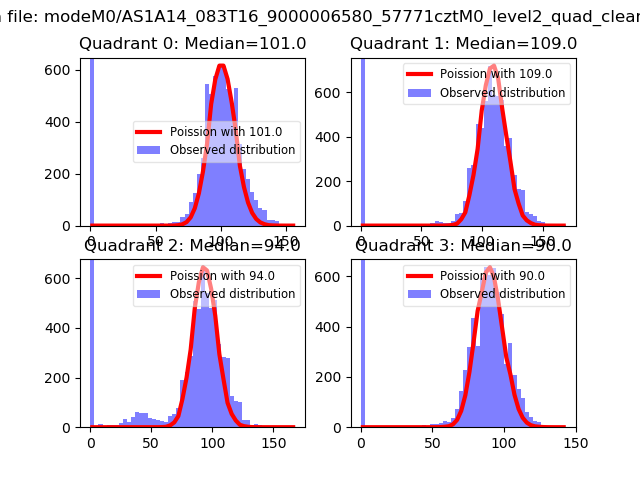 |
 |
| Quadrant-wise count rates Data is divided into 100 sec bins |
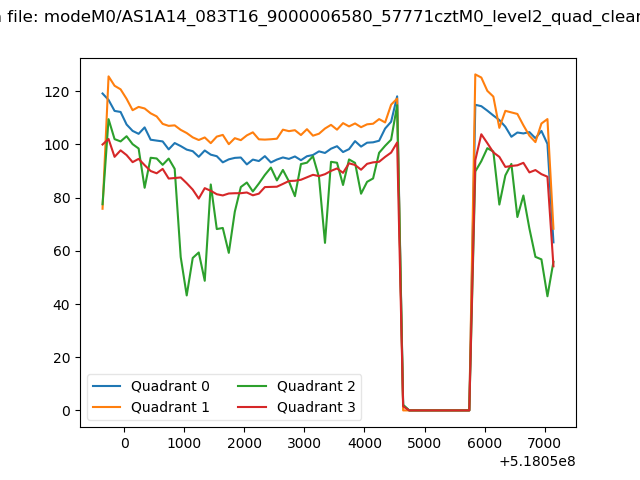 |
|
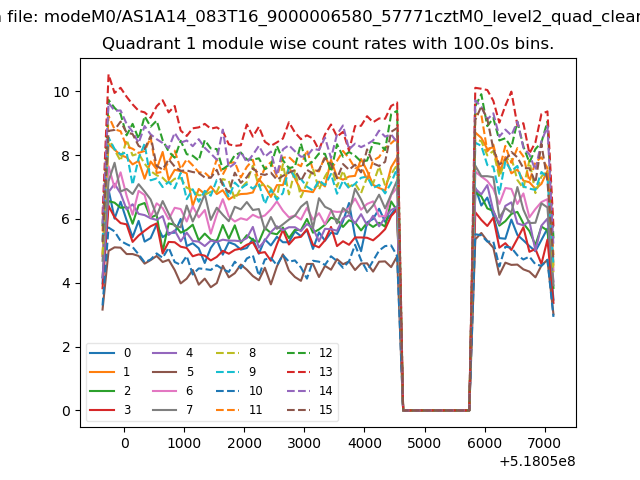
| Module-wise count rates for Quadrant A Data is divided into 100 sec bins |
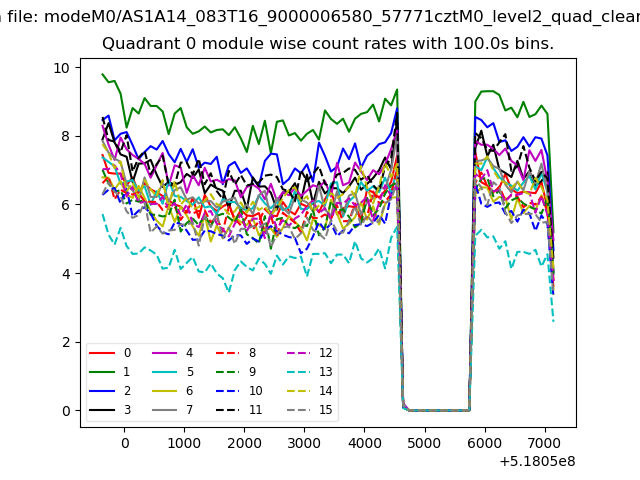 |
 |
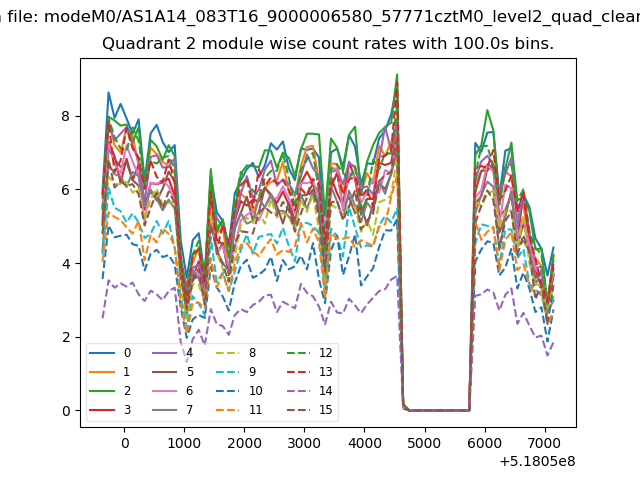
| Module-wise count rates for Quadrant B Data is divided into 100 sec bins |
 |
 |
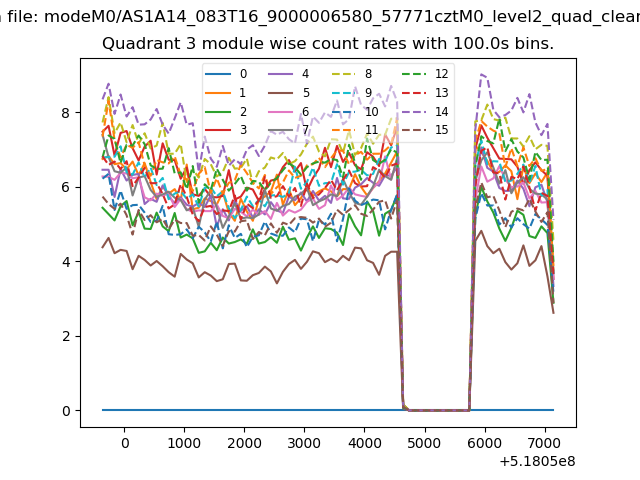
| Module-wise count rates for Quadrant C Data is divided into 100 sec bins |
 |
 |
| Module-wise count rates for Quadrant D Data is divided into 100 sec bins |
 |
 |
| Parameter | Plot |
|---|---|
| CZT HV Monitor | 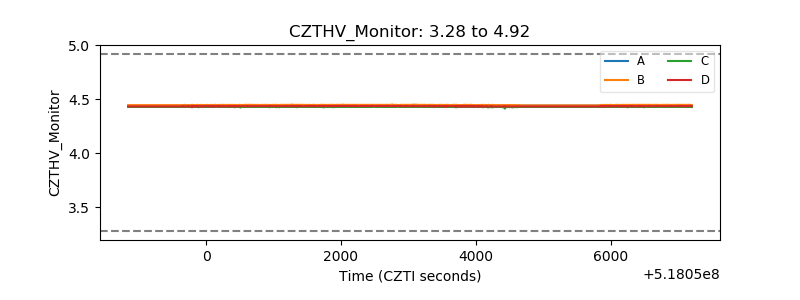 |
| D_VDD | 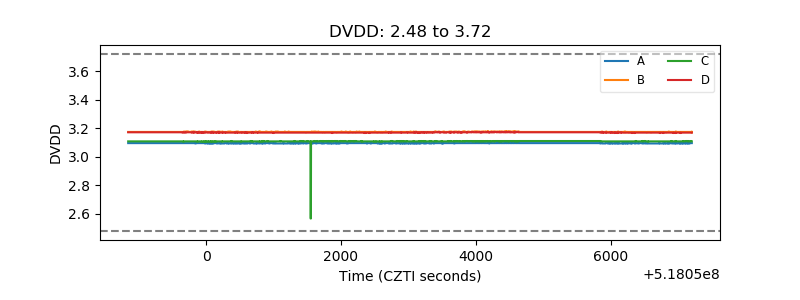 |
| Temperature 1 | 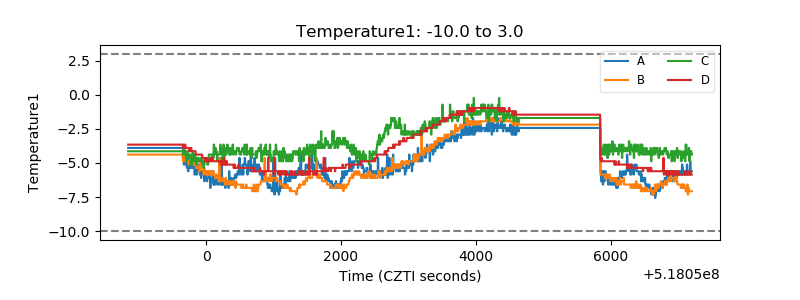 |
| Veto HV Monitor | 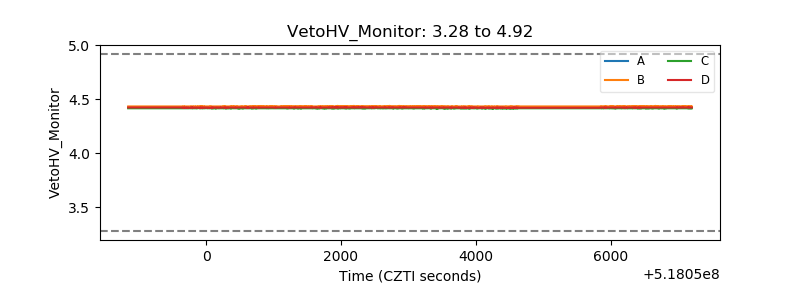 |
| Veto LLD | 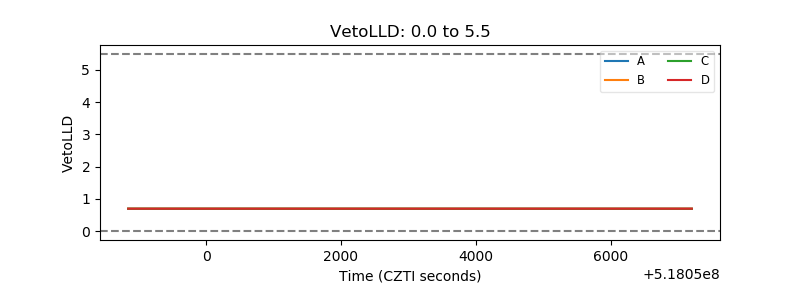 |
| Alpha Counter | 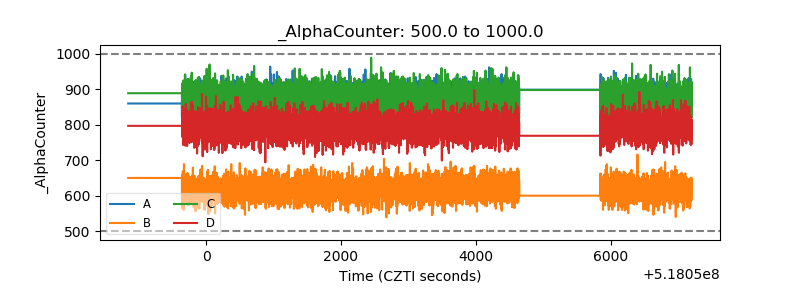 |
| _CPM_Rate | 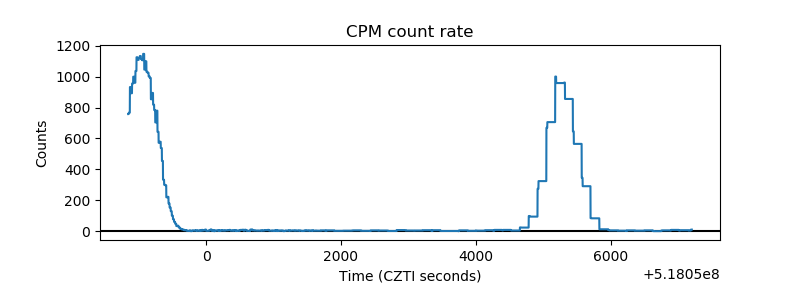 |
| CZT Counter | 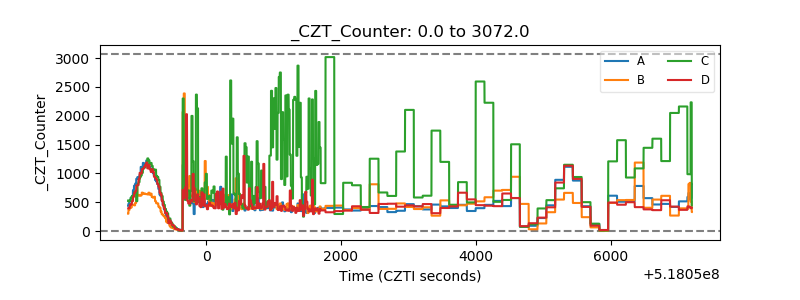 |
| +2.5 Volts monitor | 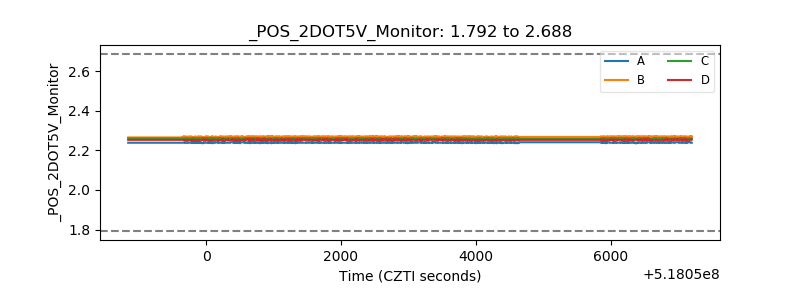 |
| +5 Volts monitor |  |
| _ROLL_ROT | 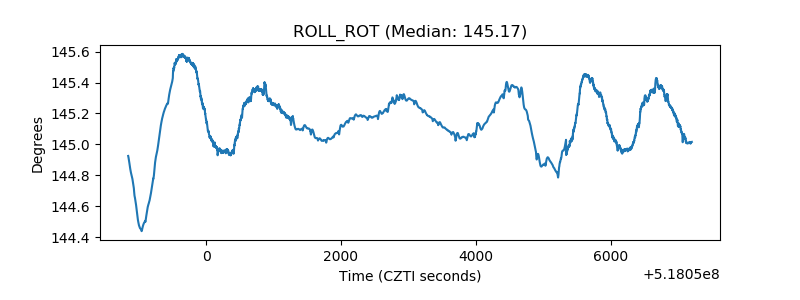 |
| _Roll_DEC | 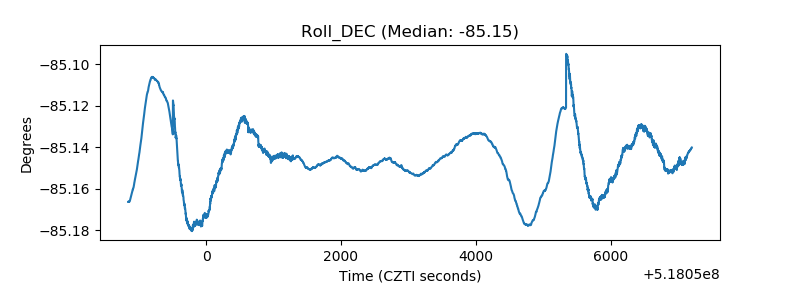 |
| _Roll_RA | 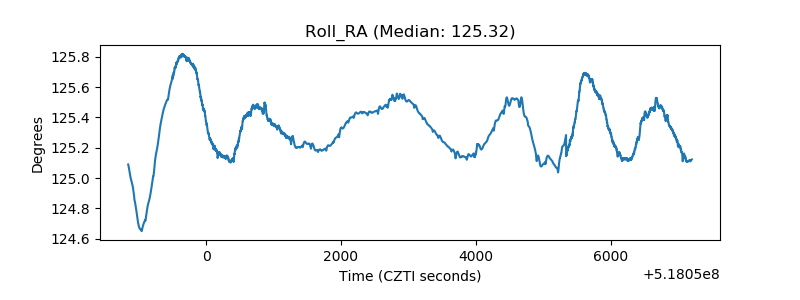 |
| Veto Counter | 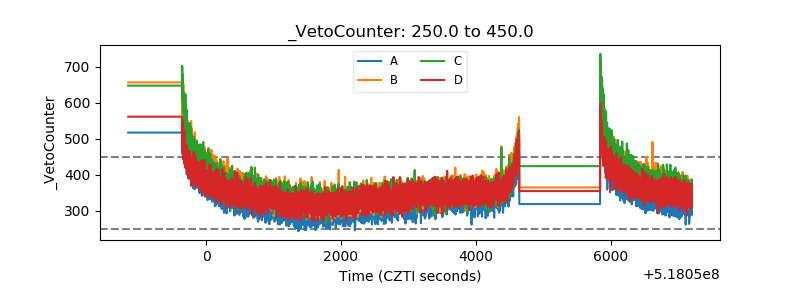 |