| Param | Original file | Final file |
|---|---|---|
| Filename | modeM0/AS1A14_083T16_9000006580_57772cztM0_level2.fits | modeM0/AS1A14_083T16_9000006580_57772cztM0_level2_quad_clean.evt |
| Size (bytes) | 540,146,880 | 99,529,920 |
| Size | 515.1 MB | 94.9 MB |
| Events in quadrant A | 3,952,397 | 678,589 |
| Events in quadrant B | 3,589,958 | 720,505 |
| Events in quadrant C | 8,460,224 | 545,985 |
| Events in quadrant D | 3,468,532 | 598,517 |
| Mode SS | |||
|---|---|---|---|
| Quadrant | BADHDUFLAG | Total packets | Discarded packets |
| A | 0 | 136 | 0 |
| B | 0 | 136 | 0 |
| C | 0 | 136 | 0 |
| D | 0 | 136 | 0 |
| Mode M0 | |||
|---|---|---|---|
| Quadrant | BADHDUFLAG | Total packets | Discarded packets |
| A | 0 | 16515 | 2 |
| B | 0 | 15421 | 2 |
| C | 0 | 29803 | 2 |
| D | 0 | 15221 | 2 |
| Mode M9 | |||
|---|---|---|---|
| Quadrant | BADHDUFLAG | Total packets | Discarded packets |
| A | 0 | 16 | 0 |
| B | 0 | 17 | 0 |
| C | 0 | 17 | 0 |
| D | 0 | 17 | 0 |
| Quadrant | Total seconds | Saturated seconds | Saturation percentage |
|---|---|---|---|
| A | 6746 | 49 | 0.726356% |
| B | 6746 | 176 | 2.608953% |
| C | 6746 | 1354 | 20.071153% |
| D | 6746 | 99 | 1.467536% |
Noise dominated data is calculated using 1-second bins in cleaned event files. If a bin has >2000 counts, and if more than 50% of those come from <1% of pixels, then it is considered to be noise-dominated and hence unusable.
| Quadrant | # 1 sec bins | Bins with >0 counts | Bins with >2000 counts | High rate bins dominated by noise | Noise dominated (total time) | Noise dominated (detector-on time) | Marked lightcurve |
|---|---|---|---|---|---|---|---|
| A | 7896 | 6747 | 2 | 2 | 0.03% | 0.03% | 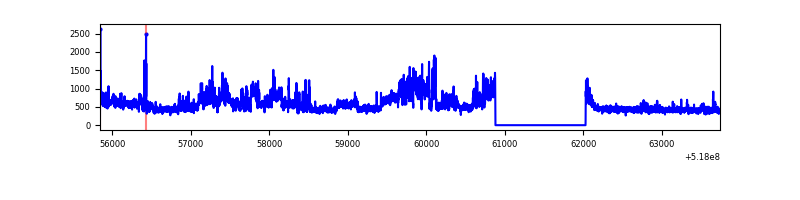 |
| B | 7896 | 6747 | 65 | 65 | 0.82% | 0.96% | 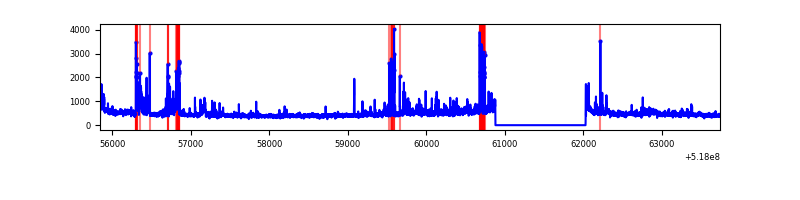 |
| C | 7896 | 6747 | 1055 | 1055 | 13.36% | 15.64% | 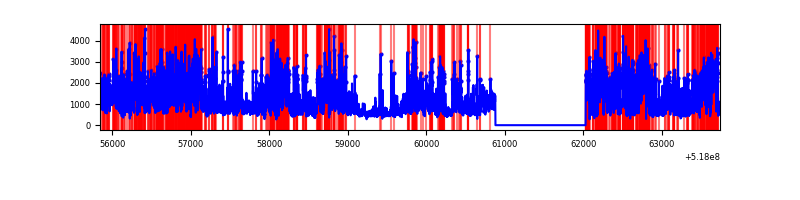 |
| D | 7896 | 6747 | 70 | 70 | 0.89% | 1.04% | 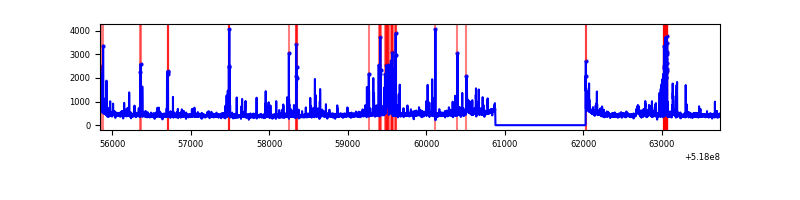 |
Top three noisy pixels from each quadrant. If the there are fewer than three noisy pixels in the level2.evt file, extra rows are filled as -1
| Pixel properties | Quadrant properties | ||||||
|---|---|---|---|---|---|---|---|
| Quadrant | DetID | PixID | Counts | Sigma | Mean | Median | Sigma |
| A | 3 | 14 | 1021007 | 5678.28 | 725 | 709 | 179.7 |
| A | 8 | 6 | 37734 | 206.06 | 725 | 709 | 179.7 |
| A | 4 | 236 | 36466 | 199.0 | 725 | 709 | 179.7 |
| B | 10 | 16 | 245566 | 1624.19 | 718 | 691 | 150.8 |
| B | 4 | 80 | 142309 | 939.31 | 718 | 691 | 150.8 |
| B | 10 | 247 | 112124 | 739.1 | 718 | 691 | 150.8 |
| C | 9 | 38 | 4241029 | 23557.04 | 660 | 652 | 180.0 |
| C | 15 | 224 | 1141313 | 6336.84 | 660 | 652 | 180.0 |
| C | 12 | 249 | 244176 | 1352.88 | 660 | 652 | 180.0 |
| D | 3 | 12 | 163447 | 824.96 | 700 | 667 | 197.3 |
| D | 8 | 160 | 161028 | 812.7 | 700 | 667 | 197.3 |
| D | 3 | 224 | 150259 | 758.12 | 700 | 667 | 197.3 |
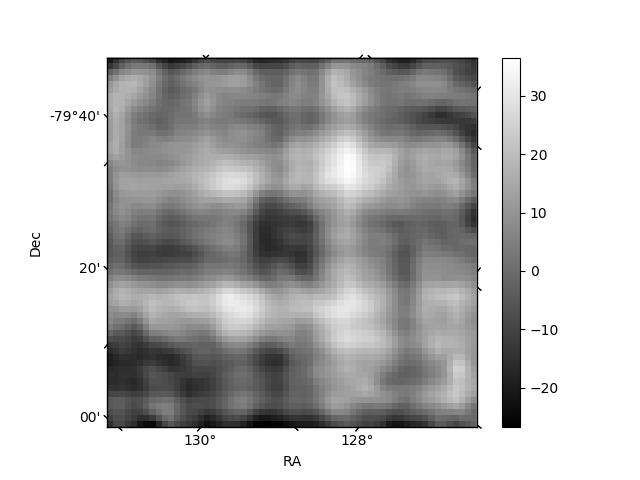
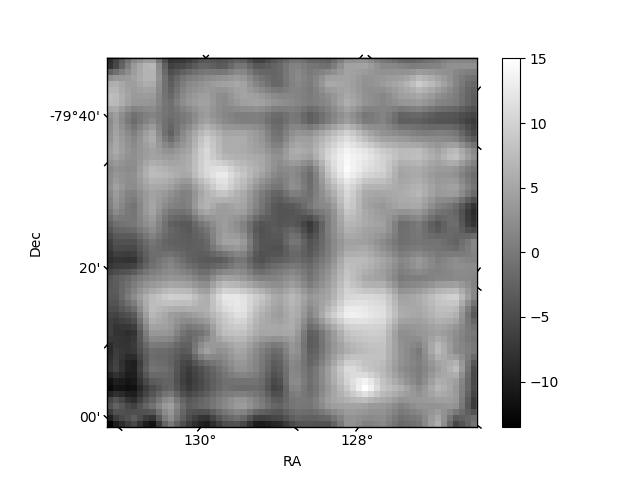
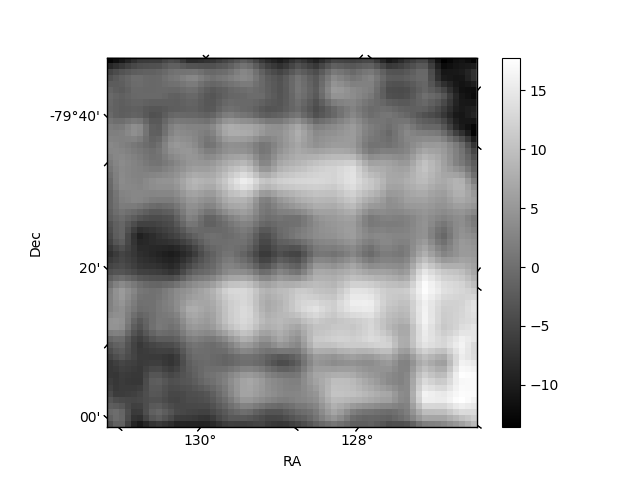
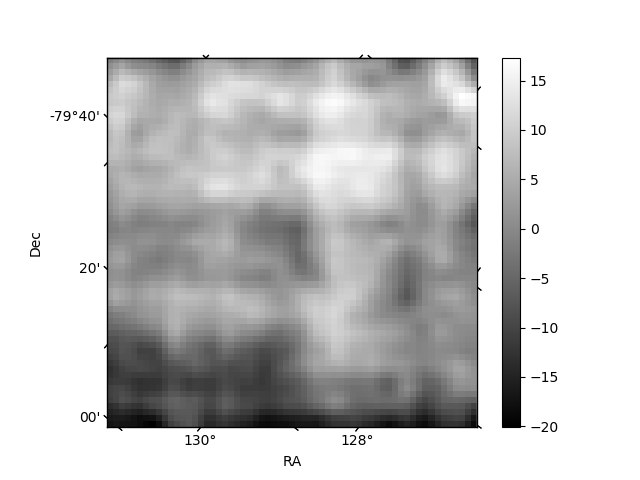
Histogram calculated using DETX and DETY for each event in the final _common_clean file
| Quadrant A | 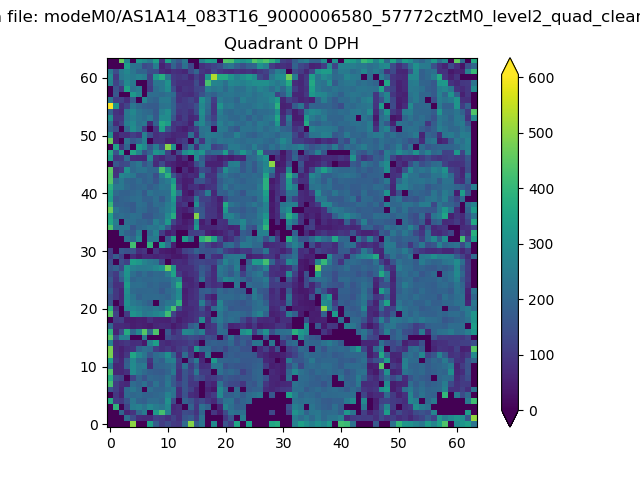 |
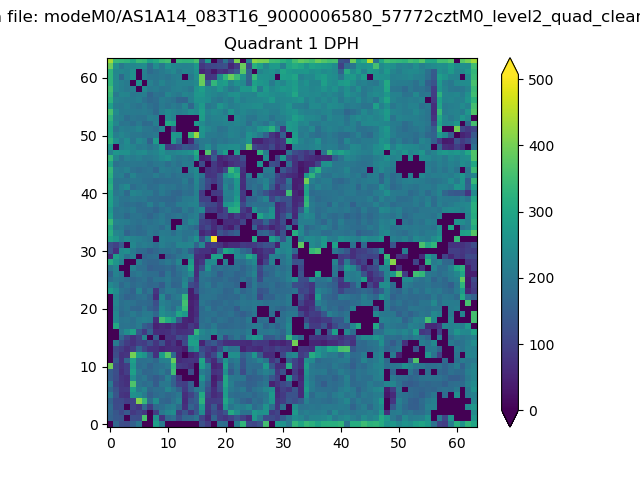 |
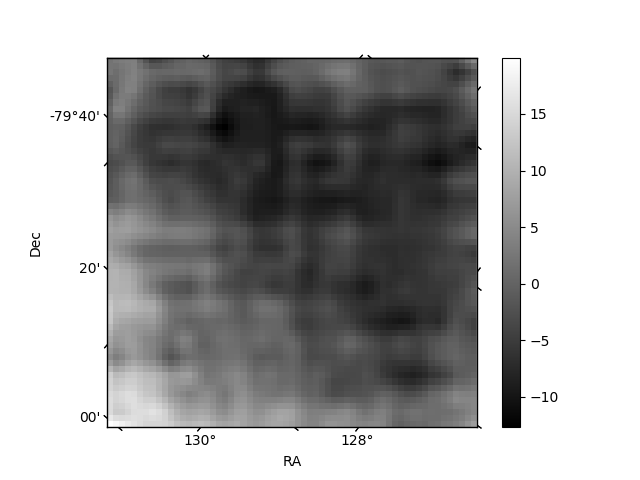
Quadrant B |
|---|---|---|---|
| Quadrant D | 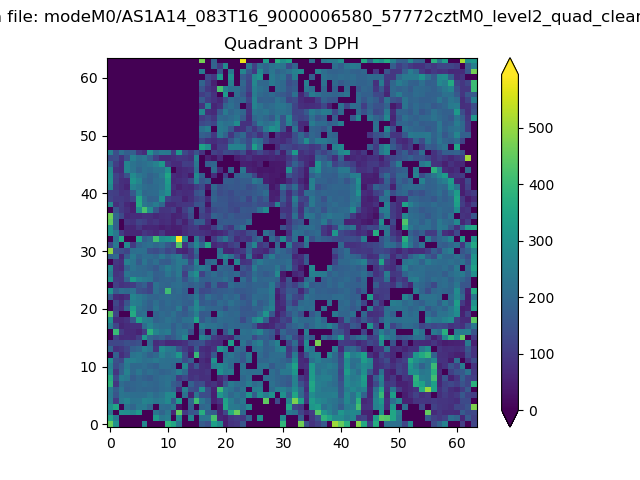 |
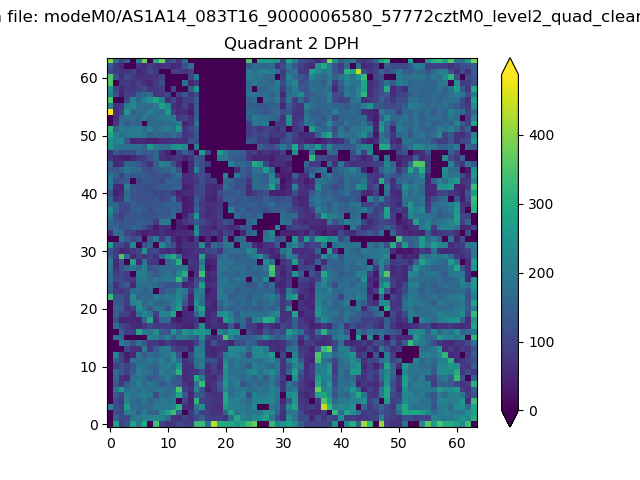 |
Quadrant C |
| Plot type | Count rate plots | Images |
|---|---|---|
| Comparison with Poisson distribution Blue bars denote a histogram of data divided into 1 sec bins. Red curve is a Poisson curve with rate = median count rate of data. |
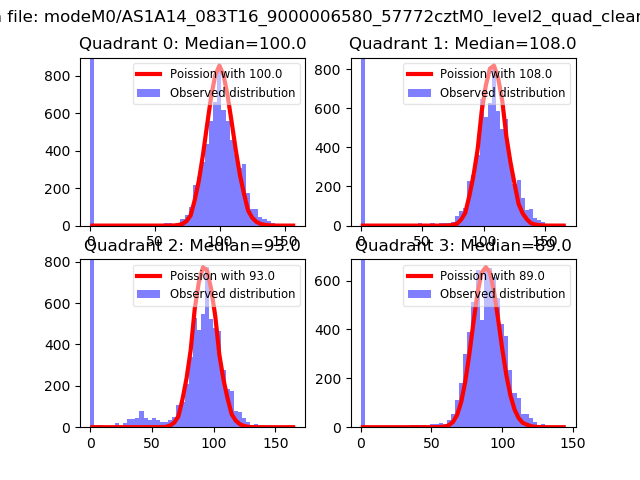 |
 |
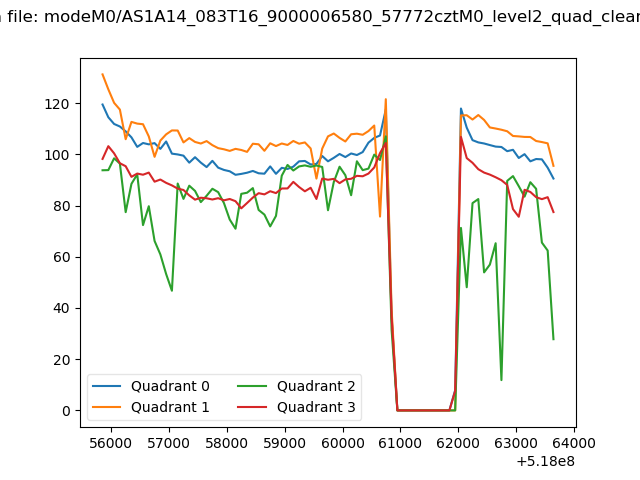
| Quadrant-wise count rates Data is divided into 100 sec bins |
 |
|
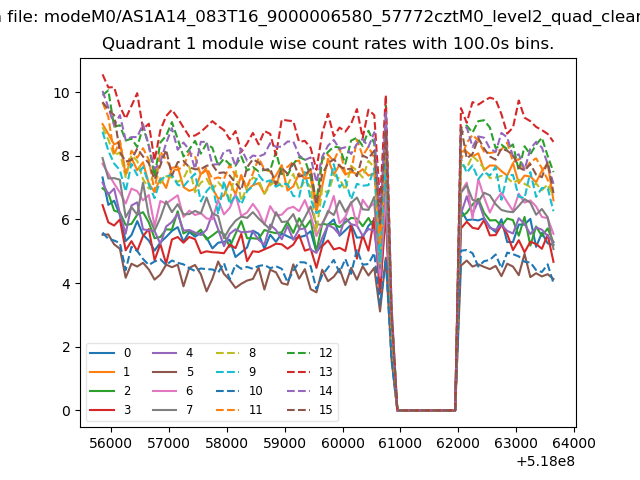
| Module-wise count rates for Quadrant A Data is divided into 100 sec bins |
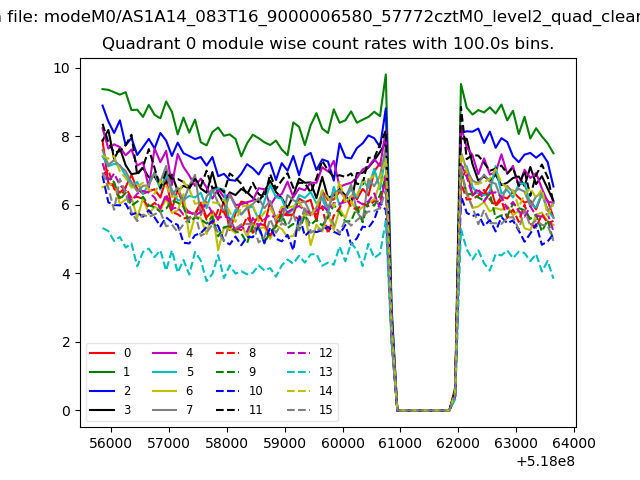 |
 |
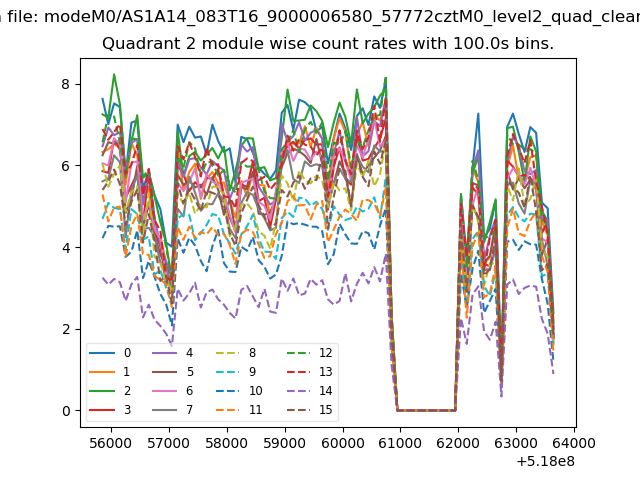
| Module-wise count rates for Quadrant B Data is divided into 100 sec bins |
 |
 |
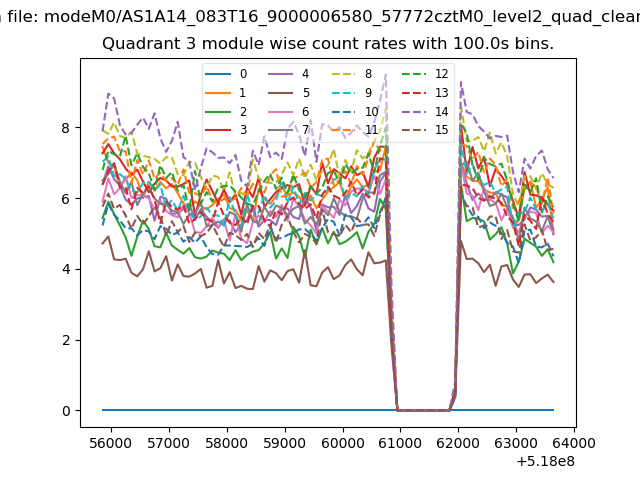
| Module-wise count rates for Quadrant C Data is divided into 100 sec bins |
 |
 |
| Module-wise count rates for Quadrant D Data is divided into 100 sec bins |
 |
 |
| Parameter | Plot |
|---|---|
| CZT HV Monitor | 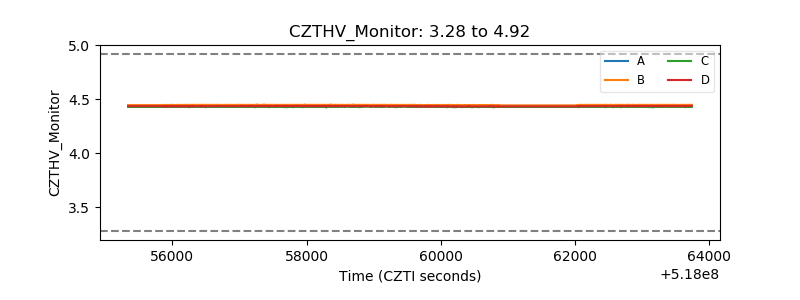 |
| D_VDD | 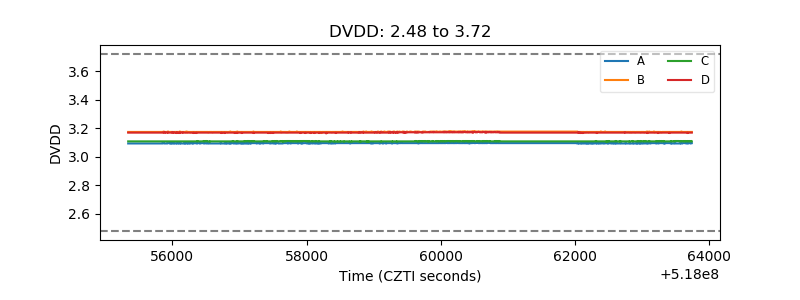 |
| Temperature 1 | 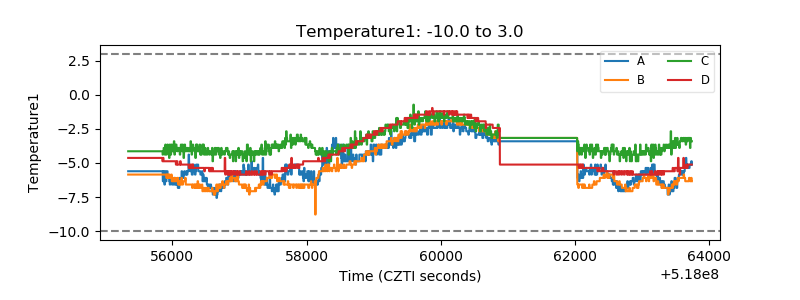 |
| Veto HV Monitor | 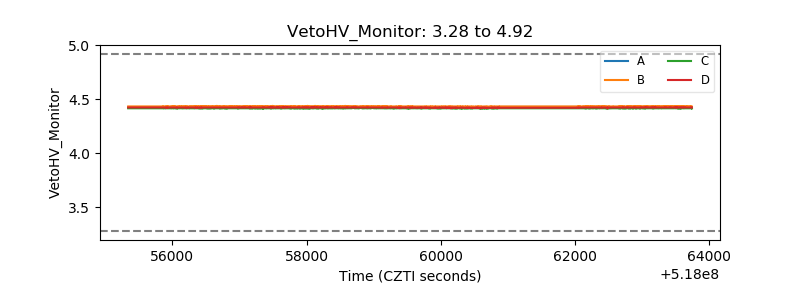 |
| Veto LLD | 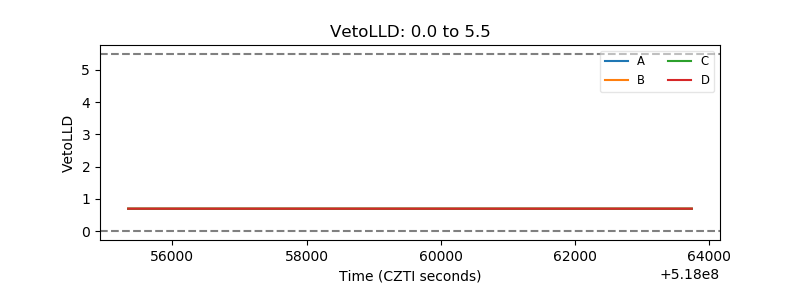 |
| Alpha Counter | 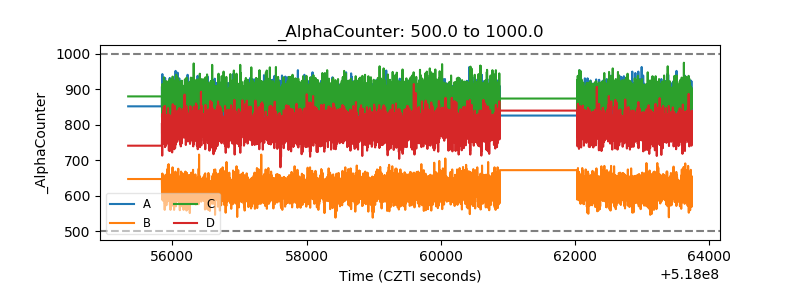 |
| _CPM_Rate | 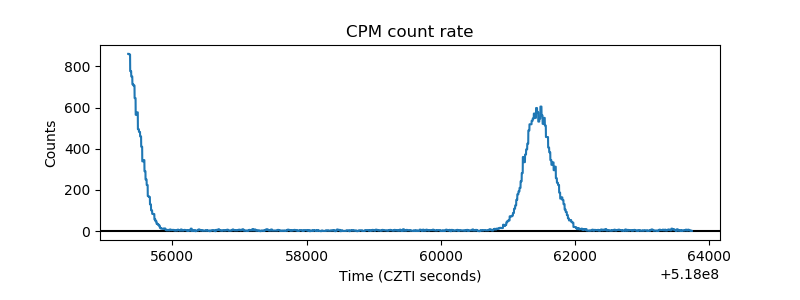 |
| CZT Counter | 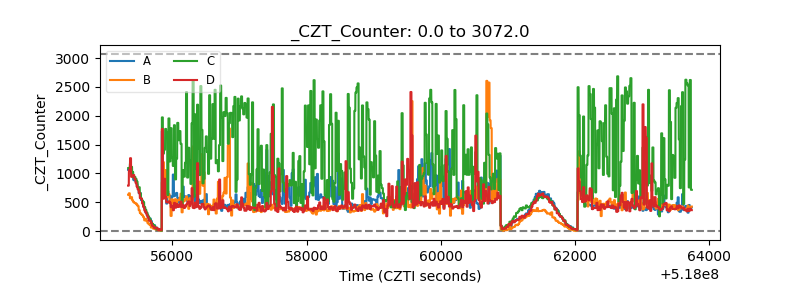 |
| +2.5 Volts monitor | 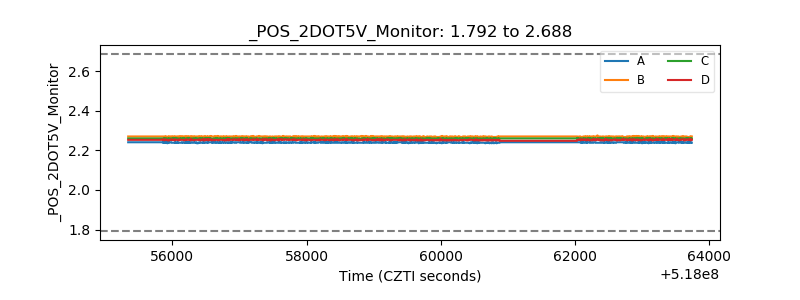 |
| +5 Volts monitor | 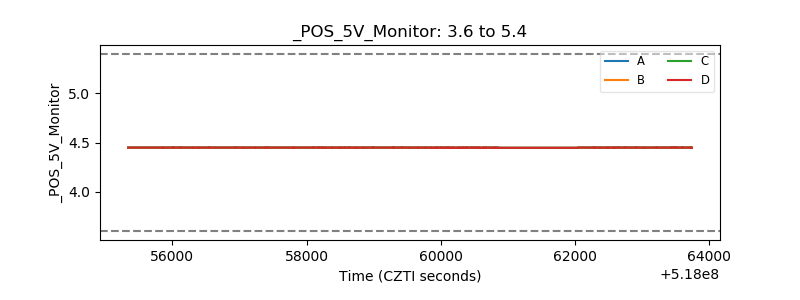 |
| _ROLL_ROT | 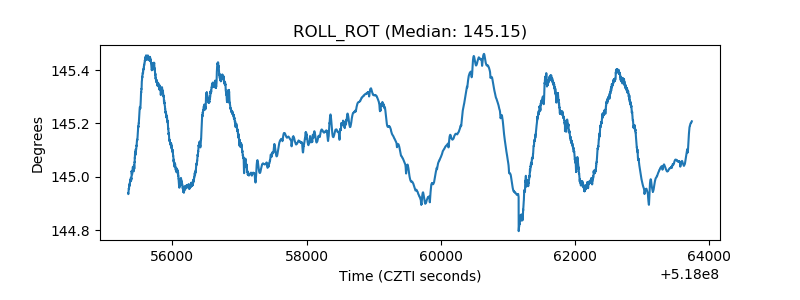 |
| _Roll_DEC | 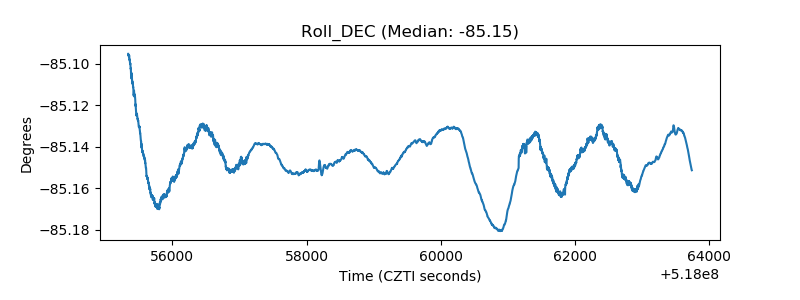 |
| _Roll_RA | 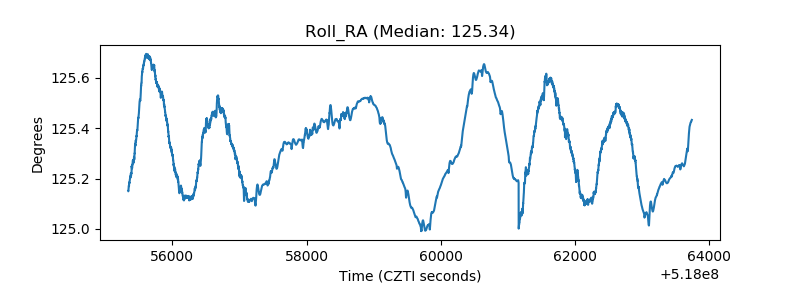 |
| Veto Counter | 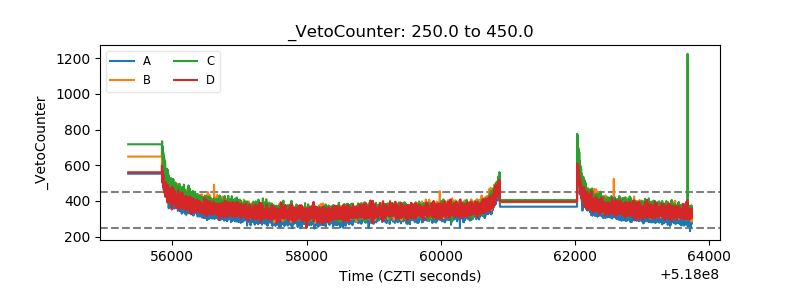 |