| Param | Original file | Final file |
|---|---|---|
| Filename | modeM0/AS1A14_083T16_9000006580_57773cztM0_level2.fits | modeM0/AS1A14_083T16_9000006580_57773cztM0_level2_quad_clean.evt |
| Size (bytes) | 1,951,136,640 | 387,089,280 |
| Size | 1.8 GB | 369.2 MB |
| Events in quadrant A | 13,375,400 | 2,593,690 |
| Events in quadrant B | 15,192,029 | 2,751,895 |
| Events in quadrant C | 26,355,919 | 2,216,089 |
| Events in quadrant D | 15,209,671 | 2,297,004 |
| Mode SS | |||
|---|---|---|---|
| Quadrant | BADHDUFLAG | Total packets | Discarded packets |
| A | 0 | 554 | 2 |
| B | 0 | 554 | 2 |
| C | 0 | 554 | 2 |
| D | 0 | 553 | 1 |
| Mode M0 | |||
|---|---|---|---|
| Quadrant | BADHDUFLAG | Total packets | Discarded packets |
| A | 0 | 60095 | 98 |
| B | 0 | 64564 | 115 |
| C | 0 | 97430 | 218 |
| D | 0 | 65125 | 121 |
| Mode M9 | |||
|---|---|---|---|
| Quadrant | BADHDUFLAG | Total packets | Discarded packets |
| A | 0 | 41 | 0 |
| B | 0 | 41 | 0 |
| C | 0 | 41 | 0 |
| D | 0 | 41 | 0 |
| Quadrant | Total seconds | Saturated seconds | Saturation percentage |
|---|---|---|---|
| A | 27064 | 428 | 1.581437% |
| B | 27062 | 719 | 2.656862% |
| C | 27064 | 3464 | 12.799291% |
| D | 27065 | 604 | 2.231665% |
Noise dominated data is calculated using 1-second bins in cleaned event files. If a bin has >2000 counts, and if more than 50% of those come from <1% of pixels, then it is considered to be noise-dominated and hence unusable.
| Quadrant | # 1 sec bins | Bins with >0 counts | Bins with >2000 counts | High rate bins dominated by noise | Noise dominated (total time) | Noise dominated (detector-on time) | Marked lightcurve |
|---|---|---|---|---|---|---|---|
| A | 44497 | 27076 | 203 | 203 | 0.46% | 0.75% | 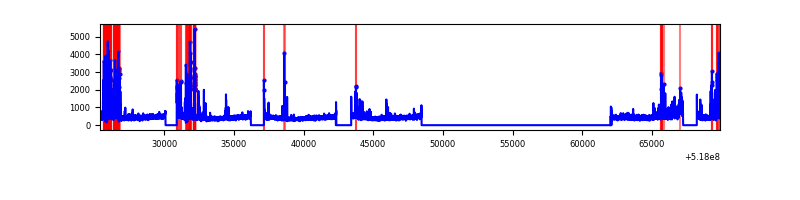 |
| B | 44498 | 27076 | 305 | 305 | 0.69% | 1.13% | 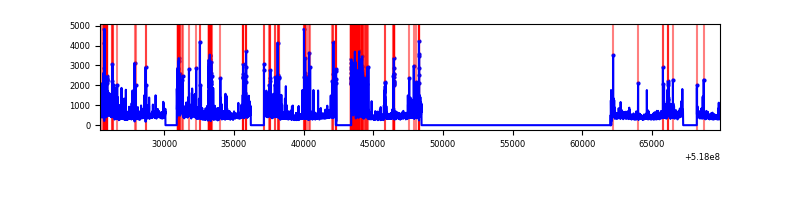 |
| C | 44498 | 27073 | 2584 | 2584 | 5.81% | 9.54% | 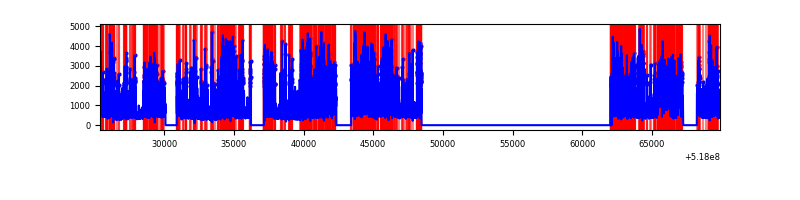 |
| D | 44498 | 27077 | 495 | 495 | 1.11% | 1.83% | 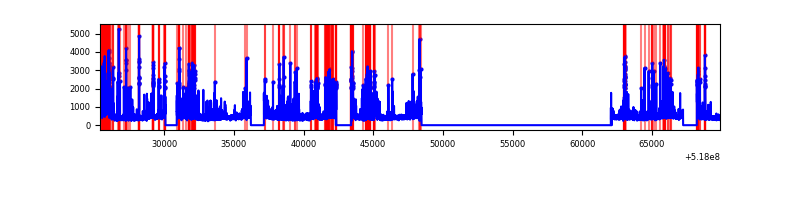 |
Top three noisy pixels from each quadrant. If the there are fewer than three noisy pixels in the level2.evt file, extra rows are filled as -1
| Pixel properties | Quadrant properties | ||||||
|---|---|---|---|---|---|---|---|
| Quadrant | DetID | PixID | Counts | Sigma | Mean | Median | Sigma |
| A | 3 | 14 | 1187364 | 1701.09 | 2845 | 2777 | 696.4 |
| A | 13 | 248 | 845203 | 1209.74 | 2845 | 2777 | 696.4 |
| A | 3 | 61 | 177976 | 251.59 | 2845 | 2777 | 696.4 |
| B | 4 | 80 | 1208407 | 2043.46 | 2815 | 2708 | 590.0 |
| B | 5 | 185 | 656837 | 1108.64 | 2815 | 2708 | 590.0 |
| B | 0 | 213 | 420253 | 707.67 | 2815 | 2708 | 590.0 |
| C | 15 | 224 | 7497728 | 10490.48 | 2639 | 2616 | 714.5 |
| C | 9 | 38 | 7179325 | 10044.83 | 2639 | 2616 | 714.5 |
| C | 12 | 252 | 749704 | 1045.66 | 2639 | 2616 | 714.5 |
| D | 12 | 248 | 844988 | 1092.35 | 2738 | 2610 | 771.2 |
| D | 2 | 249 | 721513 | 932.23 | 2738 | 2610 | 771.2 |
| D | 3 | 12 | 563898 | 727.85 | 2738 | 2610 | 771.2 |
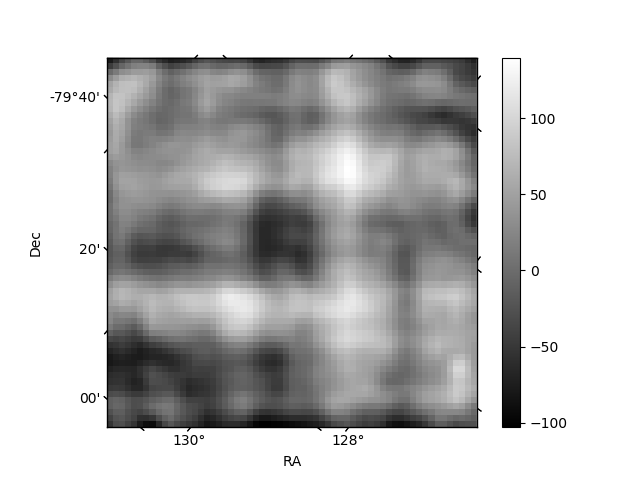
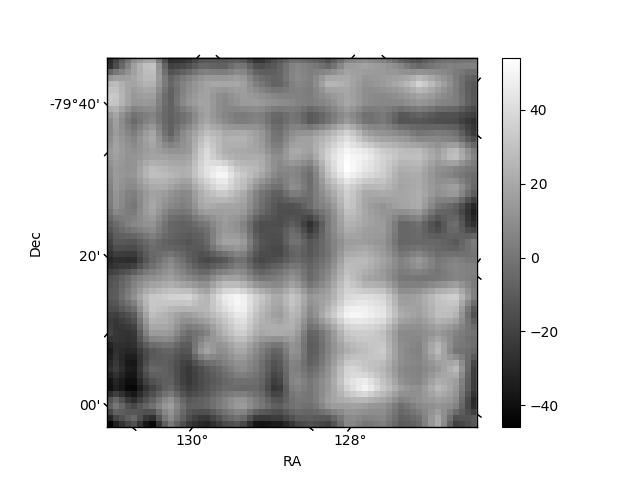
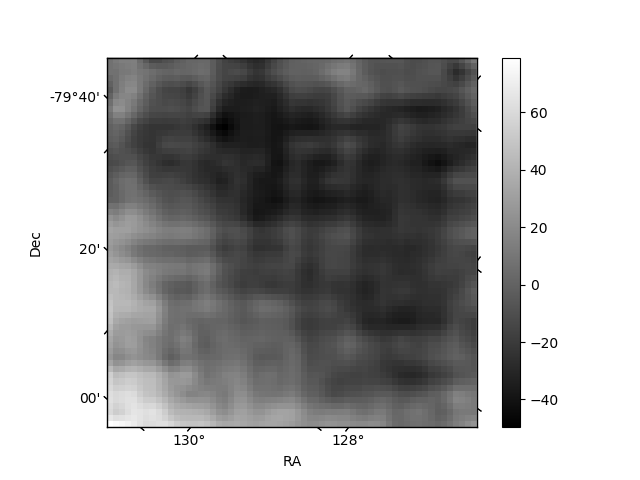
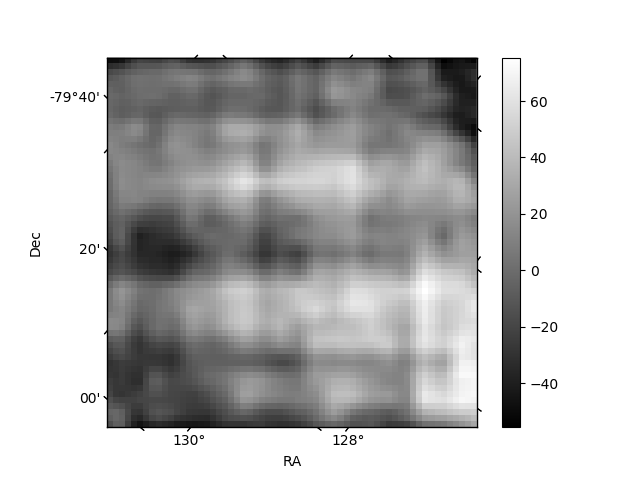
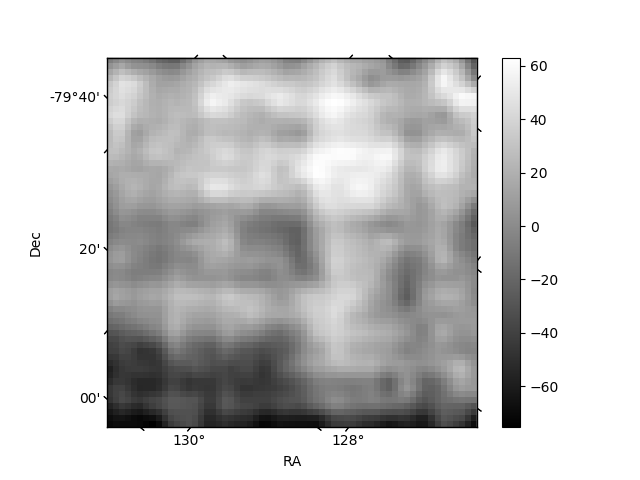
Histogram calculated using DETX and DETY for each event in the final _common_clean file
| Quadrant A | 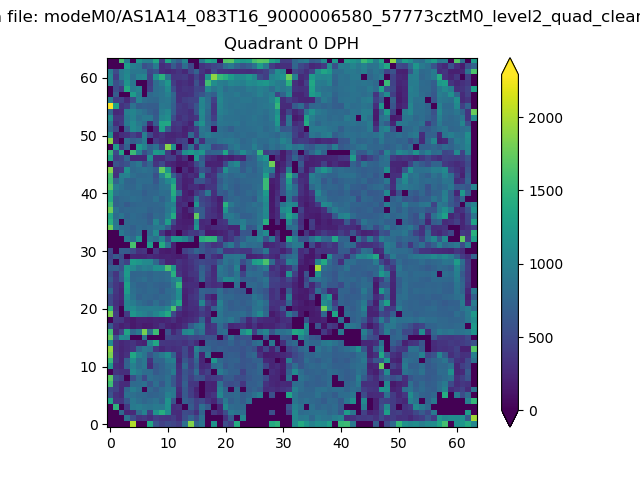 |
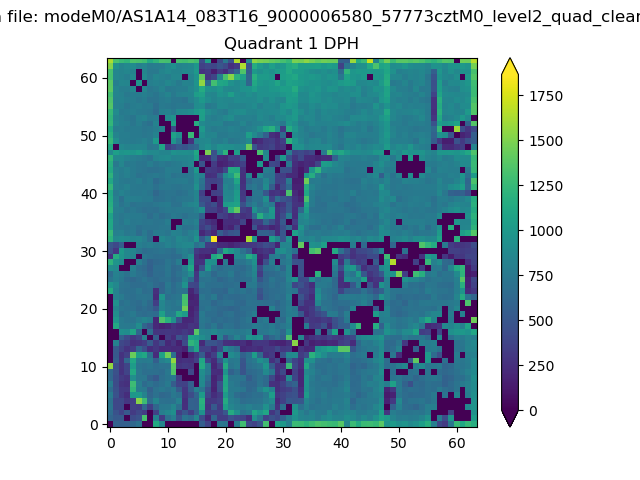 |
Quadrant B |
|---|---|---|---|
| Quadrant D | 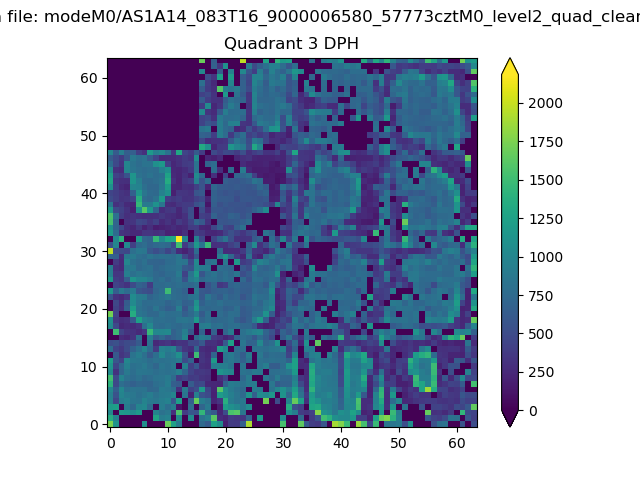 |
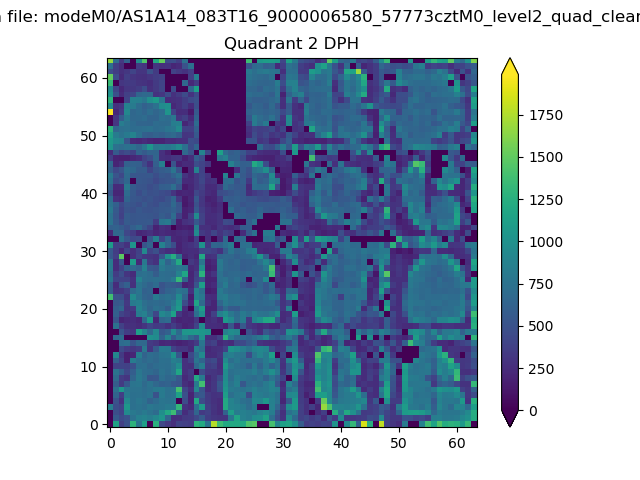 |
Quadrant C |
| Plot type | Count rate plots | Images |
|---|---|---|
| Comparison with Poisson distribution Blue bars denote a histogram of data divided into 1 sec bins. Red curve is a Poisson curve with rate = median count rate of data. |
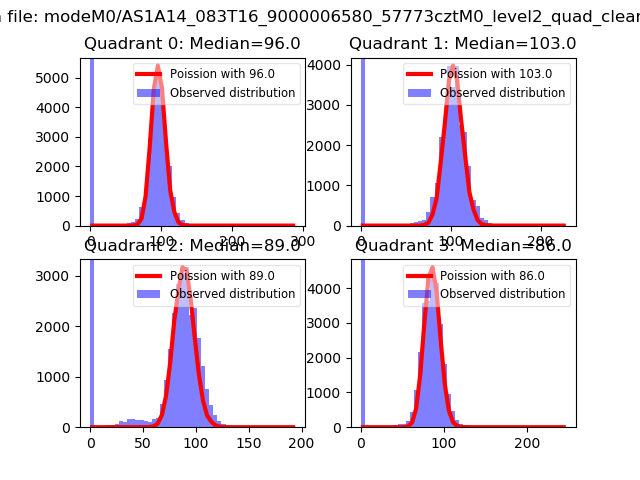 |
 |
| Quadrant-wise count rates Data is divided into 100 sec bins |
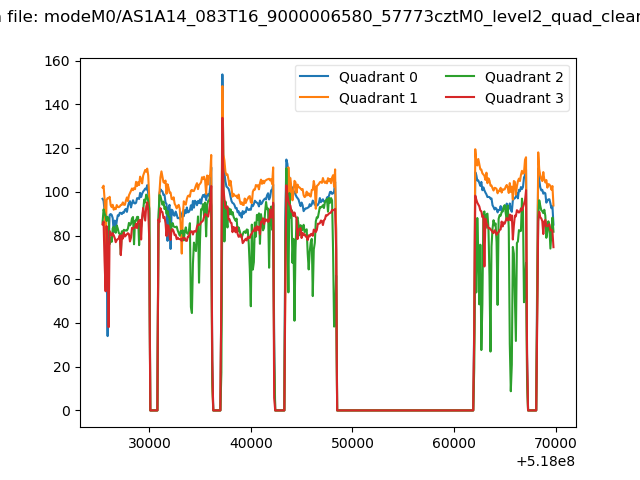 |
|
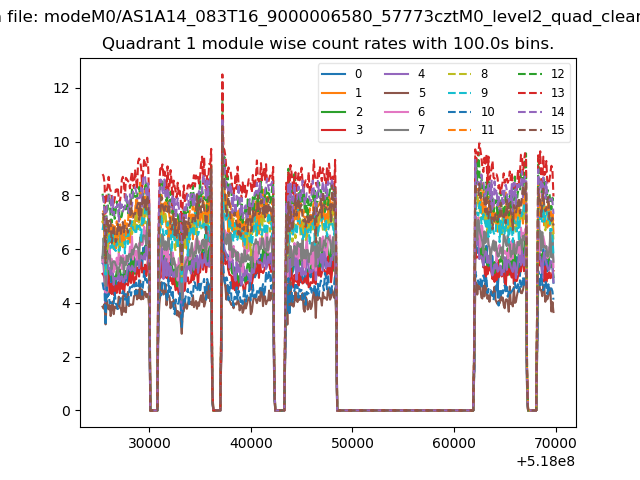
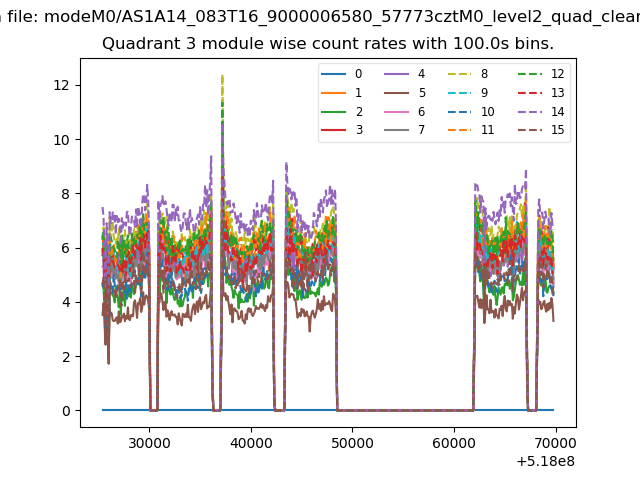
| Module-wise count rates for Quadrant A Data is divided into 100 sec bins |
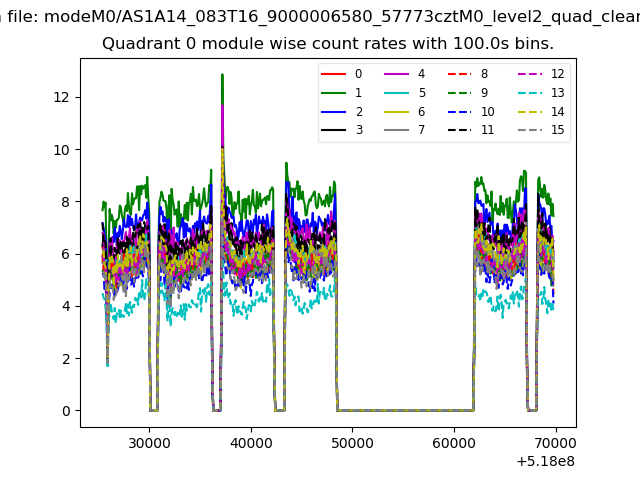 |
 |
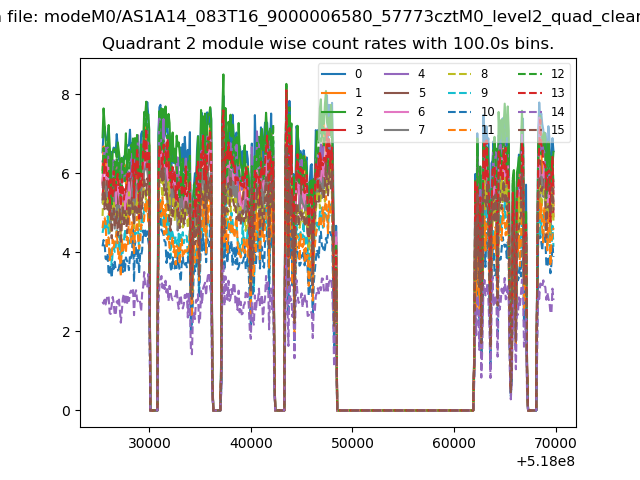
| Module-wise count rates for Quadrant B Data is divided into 100 sec bins |
 |
 |
| Module-wise count rates for Quadrant C Data is divided into 100 sec bins |
 |
 |
| Module-wise count rates for Quadrant D Data is divided into 100 sec bins |
 |
 |
| Parameter | Plot |
|---|---|
| CZT HV Monitor | 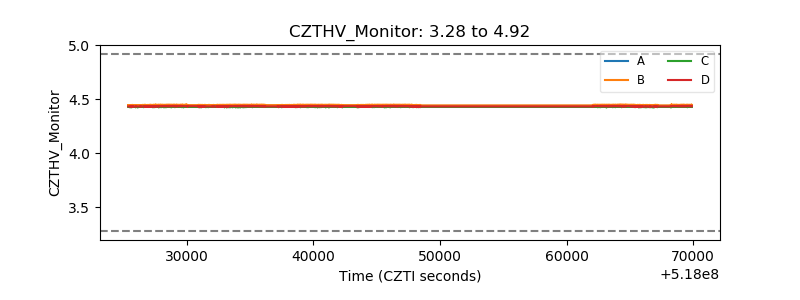 |
| D_VDD | 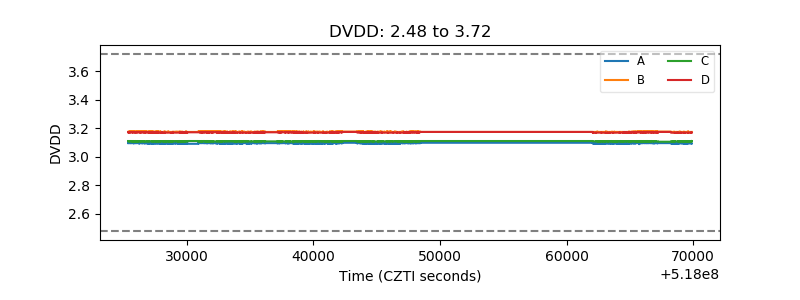 |
| Temperature 1 | 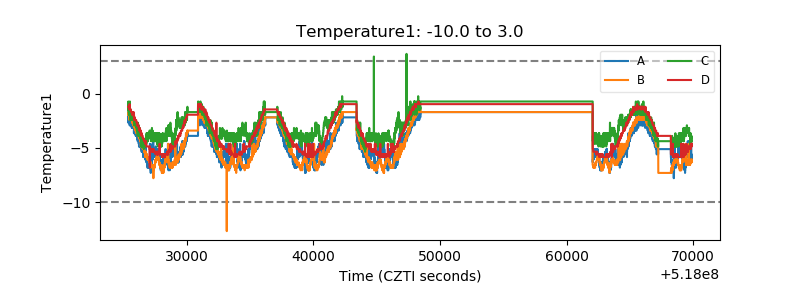 |
| Veto HV Monitor | 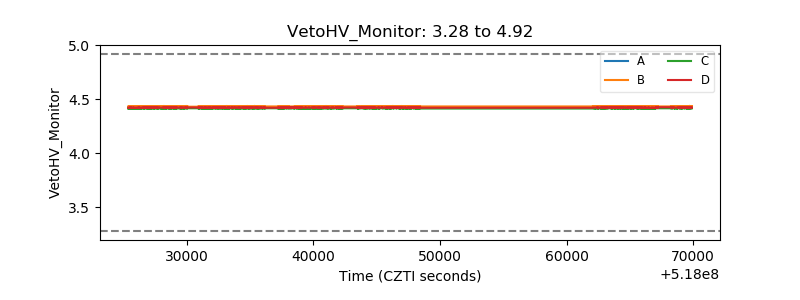 |
| Veto LLD | 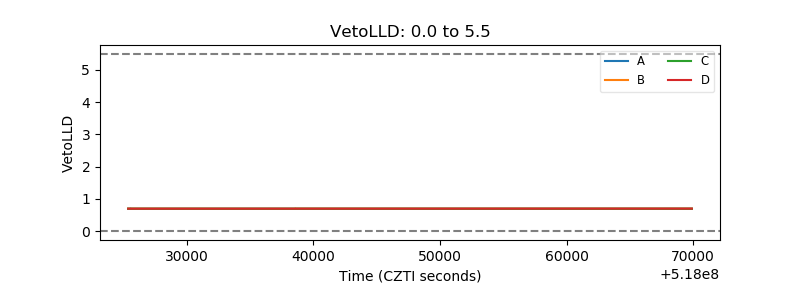 |
| Alpha Counter | 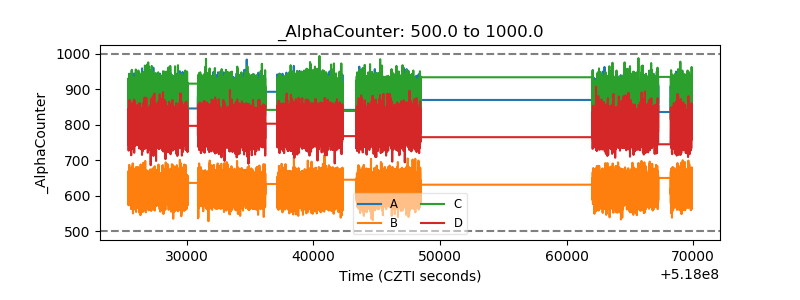 |
| _CPM_Rate | 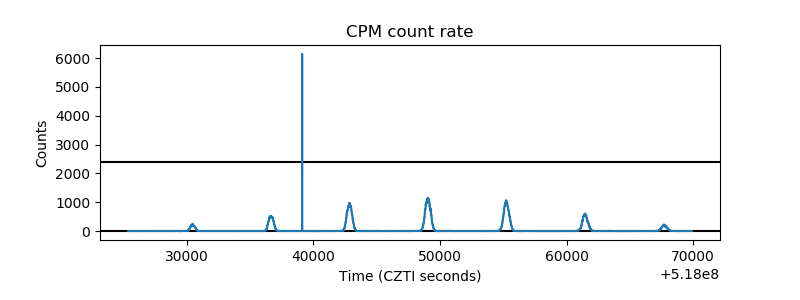 |
| CZT Counter | 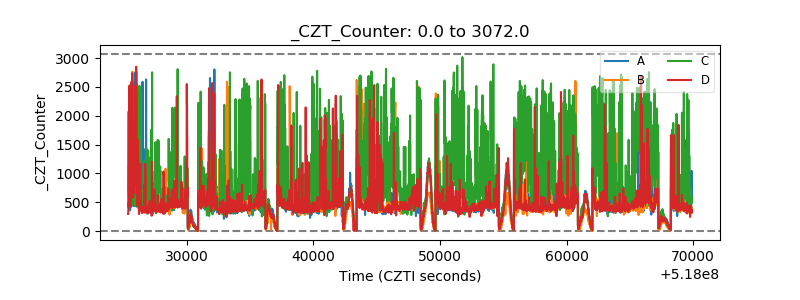 |
| +2.5 Volts monitor | 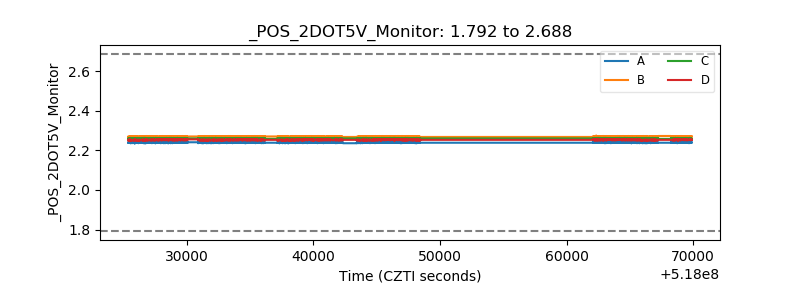 |
| +5 Volts monitor |  |
| _ROLL_ROT | 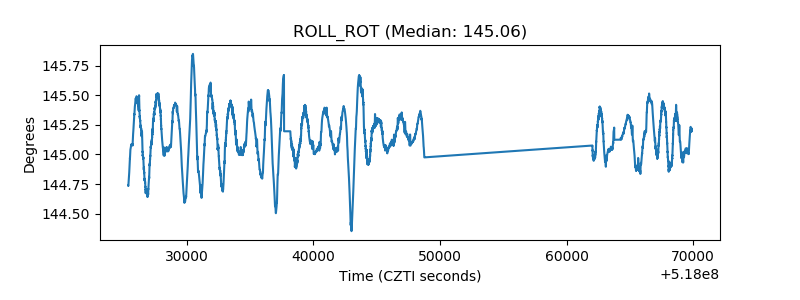 |
| _Roll_DEC | 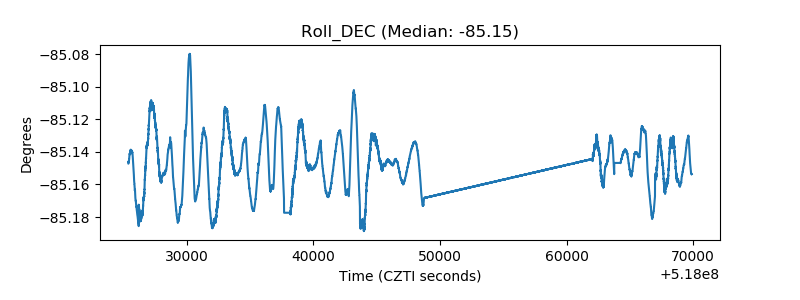 |
| _Roll_RA | 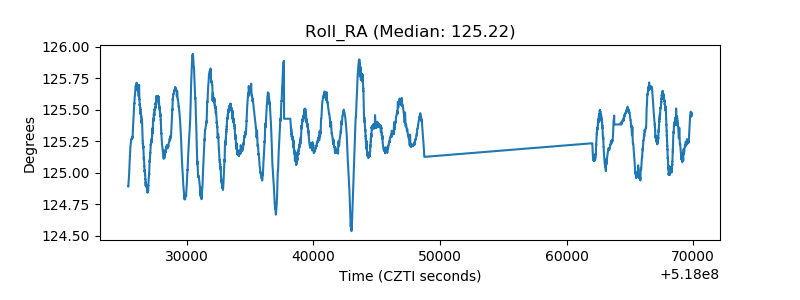 |
| Veto Counter | 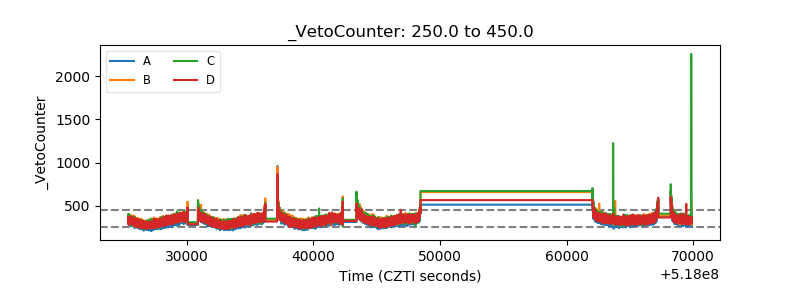 |