| Param | Original file | Final file |
|---|---|---|
| Filename | modeM0/AS1A14_083T16_9000006580_57774cztM0_level2.fits | modeM0/AS1A14_083T16_9000006580_57774cztM0_level2_quad_clean.evt |
| Size (bytes) | 419,212,800 | 87,877,440 |
| Size | 399.8 MB | 83.8 MB |
| Events in quadrant A | 3,419,588 | 574,878 |
| Events in quadrant B | 2,876,872 | 624,440 |
| Events in quadrant C | 5,235,867 | 520,271 |
| Events in quadrant D | 3,507,476 | 514,486 |
| Mode SS | |||
|---|---|---|---|
| Quadrant | BADHDUFLAG | Total packets | Discarded packets |
| A | 0 | 118 | 0 |
| B | 0 | 118 | 4 |
| C | 0 | 118 | 4 |
| D | 0 | 118 | 4 |
| Mode M0 | |||
|---|---|---|---|
| Quadrant | BADHDUFLAG | Total packets | Discarded packets |
| A | 0 | 14731 | 234 |
| B | 0 | 13131 | 109 |
| C | 0 | 20216 | 451 |
| D | 0 | 15180 | 163 |
| Mode M9 | |||
|---|---|---|---|
| Quadrant | BADHDUFLAG | Total packets | Discarded packets |
| A | 0 | 7 | 0 |
| B | 0 | 7 | 0 |
| C | 0 | 7 | 0 |
| D | 0 | 7 | 0 |
| Quadrant | Total seconds | Saturated seconds | Saturation percentage |
|---|---|---|---|
| A | 6133 | 199 | 3.244742% |
| B | 6169 | 136 | 2.204571% |
| C | 6117 | 514 | 8.402812% |
| D | 6149 | 225 | 3.659132% |
Noise dominated data is calculated using 1-second bins in cleaned event files. If a bin has >2000 counts, and if more than 50% of those come from <1% of pixels, then it is considered to be noise-dominated and hence unusable.
| Quadrant | # 1 sec bins | Bins with >0 counts | Bins with >2000 counts | High rate bins dominated by noise | Noise dominated (total time) | Noise dominated (detector-on time) | Marked lightcurve |
|---|---|---|---|---|---|---|---|
| A | 7466 | 6217 | 67 | 67 | 0.90% | 1.08% | 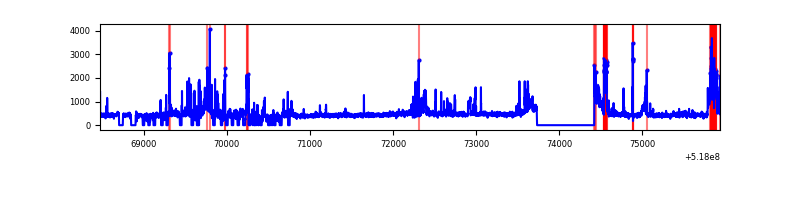 |
| B | 7466 | 6245 | 16 | 16 | 0.21% | 0.26% | 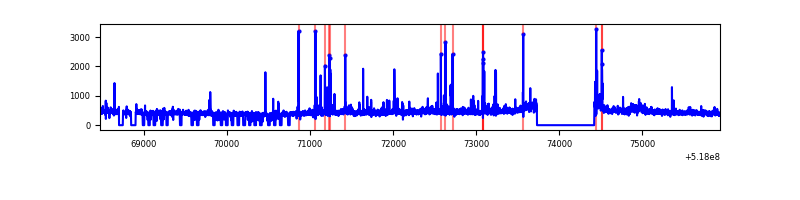 |
| C | 7466 | 6225 | 314 | 314 | 4.21% | 5.04% | 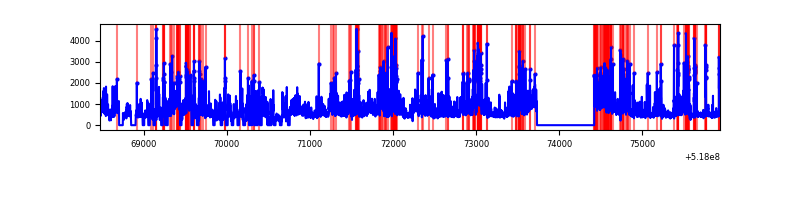 |
| D | 7466 | 6232 | 154 | 154 | 2.06% | 2.47% | 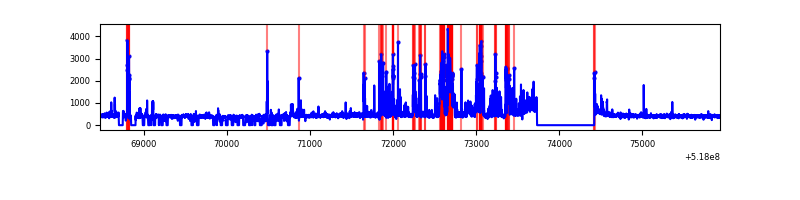 |
Top three noisy pixels from each quadrant. If the there are fewer than three noisy pixels in the level2.evt file, extra rows are filled as -1
| Pixel properties | Quadrant properties | ||||||
|---|---|---|---|---|---|---|---|
| Quadrant | DetID | PixID | Counts | Sigma | Mean | Median | Sigma |
| A | 3 | 14 | 792109 | 4967.99 | 648 | 632 | 159.3 |
| A | 3 | 245 | 60923 | 378.44 | 648 | 632 | 159.3 |
| A | 3 | 128 | 28388 | 174.22 | 648 | 632 | 159.3 |
| B | 4 | 80 | 76903 | 556.98 | 649 | 624 | 137.0 |
| B | 10 | 247 | 47773 | 344.28 | 649 | 624 | 137.0 |
| B | 0 | 63 | 38730 | 278.25 | 649 | 624 | 137.0 |
| C | 9 | 38 | 1508585 | 9140.29 | 612 | 604 | 165.0 |
| C | 15 | 224 | 1065140 | 6452.44 | 612 | 604 | 165.0 |
| C | 14 | 254 | 98615 | 594.07 | 612 | 604 | 165.0 |
| D | 9 | 102 | 561689 | 3122.98 | 632 | 601 | 179.7 |
| D | 12 | 248 | 109576 | 606.55 | 632 | 601 | 179.7 |
| D | 2 | 153 | 101753 | 563.0 | 632 | 601 | 179.7 |
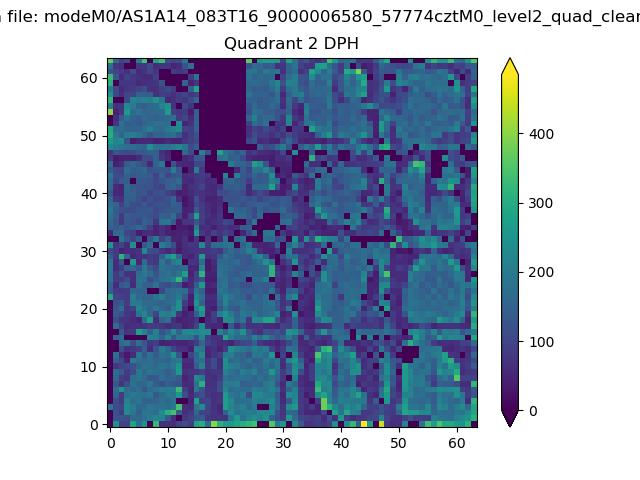
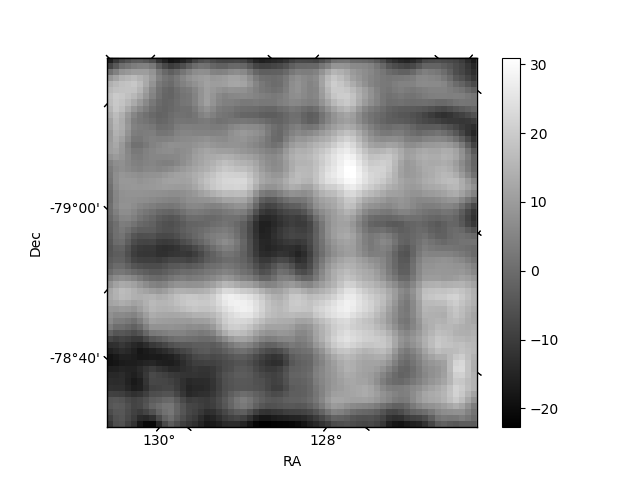
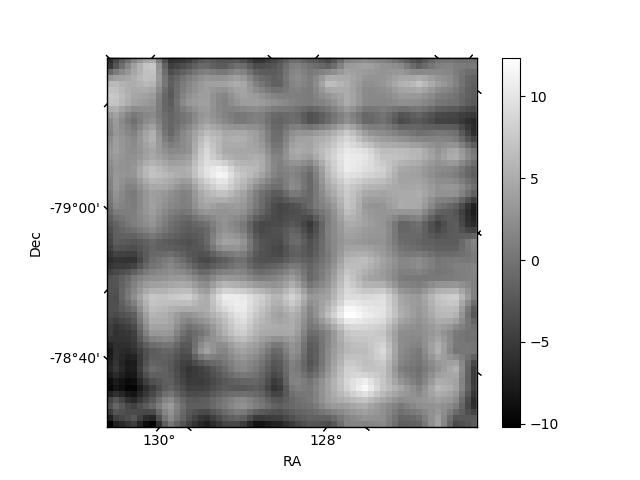
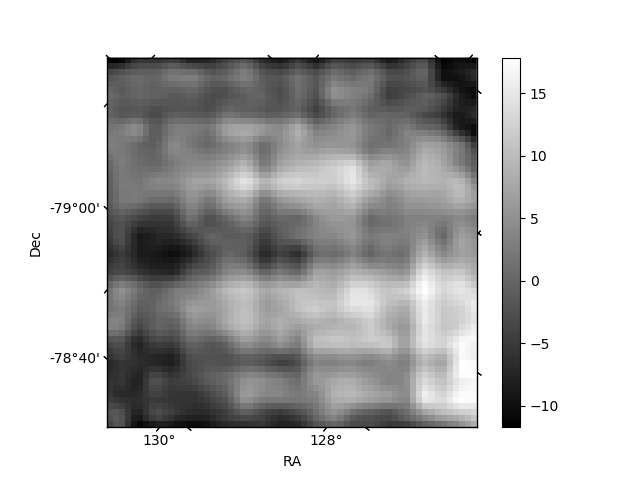
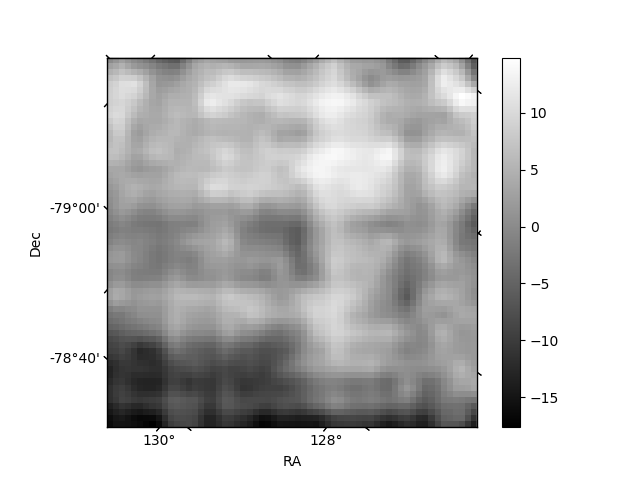
Histogram calculated using DETX and DETY for each event in the final _common_clean file
| Quadrant A | 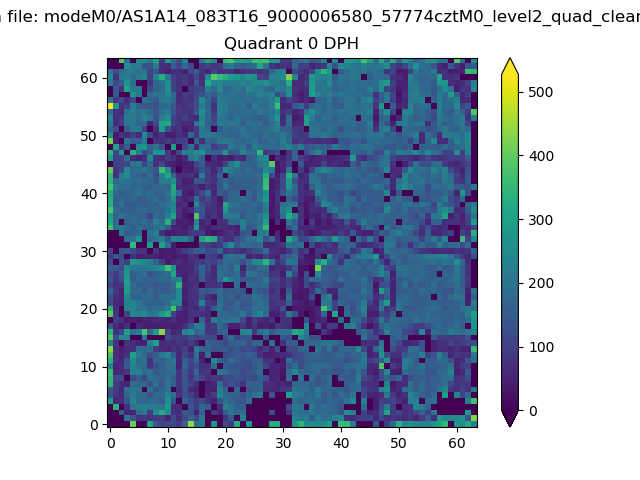 |
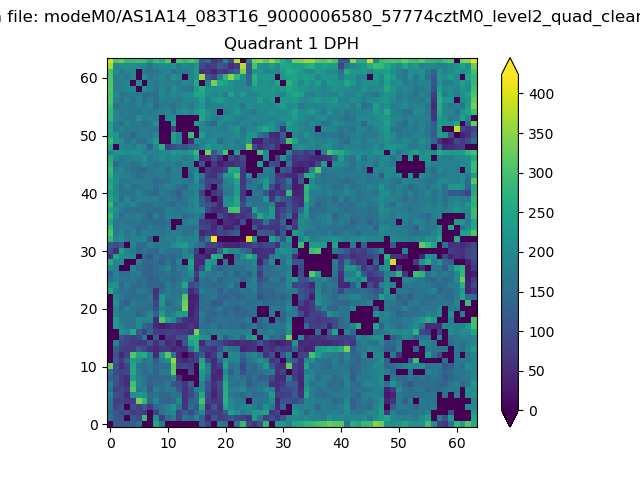 |
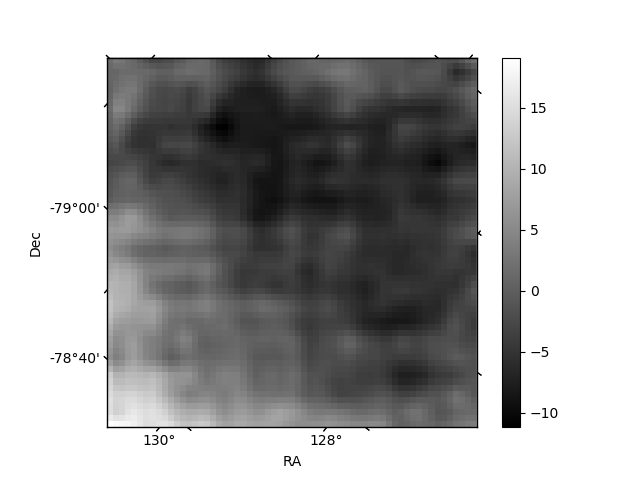
Quadrant B |
|---|---|---|---|
| Quadrant D | 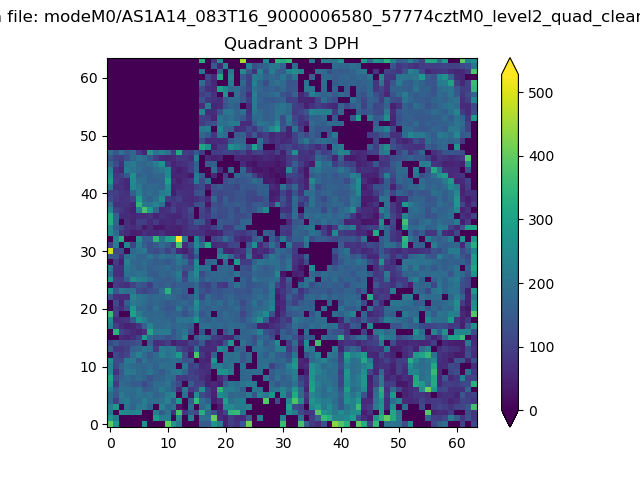 |
 |
Quadrant C |
| Plot type | Count rate plots | Images |
|---|---|---|
| Comparison with Poisson distribution Blue bars denote a histogram of data divided into 1 sec bins. Red curve is a Poisson curve with rate = median count rate of data. |
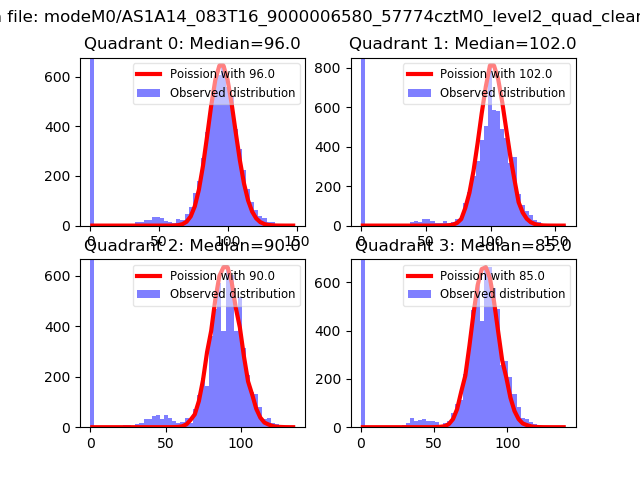 |
 |
| Quadrant-wise count rates Data is divided into 100 sec bins |
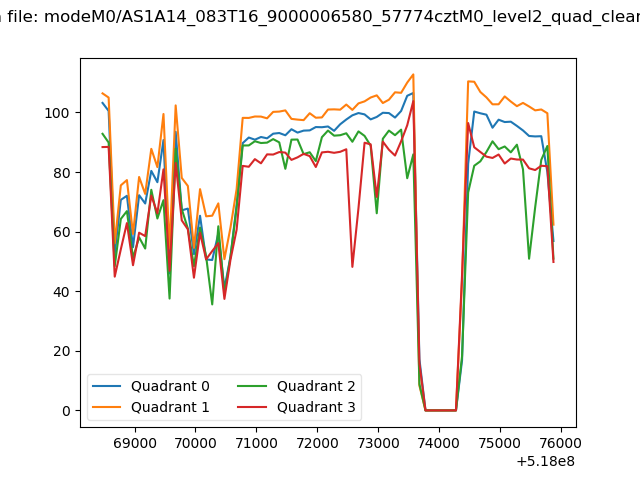 |
|
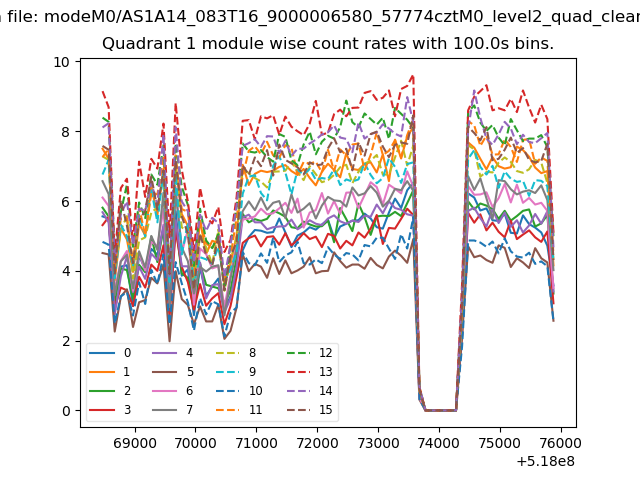
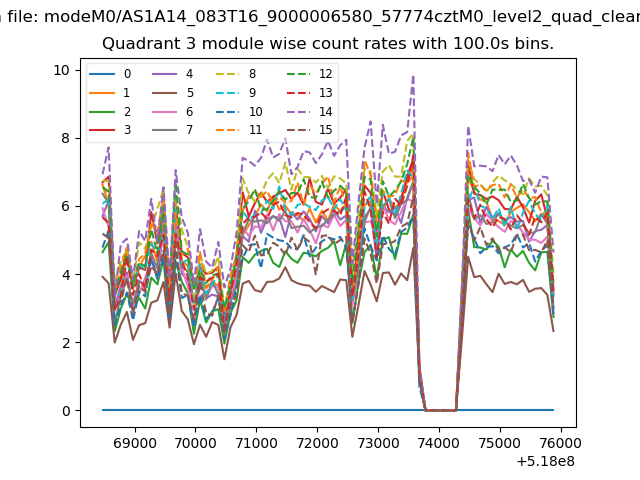
| Module-wise count rates for Quadrant A Data is divided into 100 sec bins |
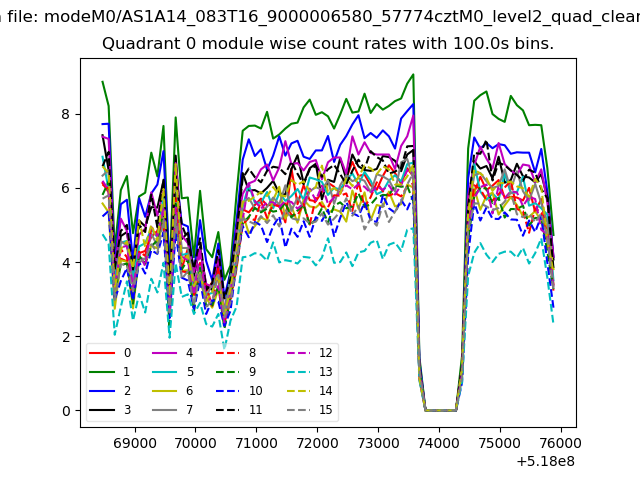 |
 |
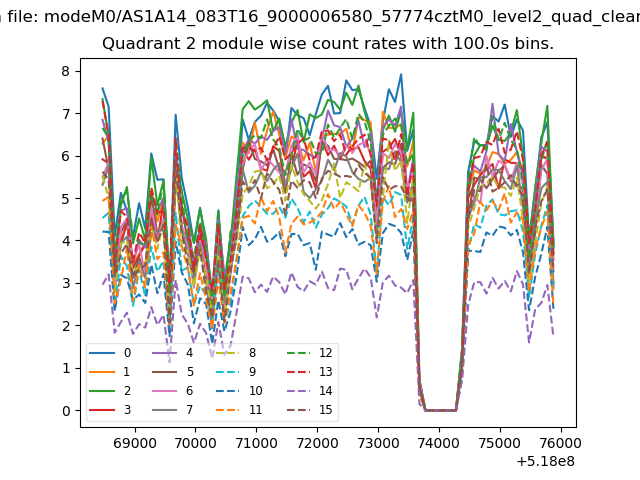
| Module-wise count rates for Quadrant B Data is divided into 100 sec bins |
 |
 |
| Module-wise count rates for Quadrant C Data is divided into 100 sec bins |
 |
 |
| Module-wise count rates for Quadrant D Data is divided into 100 sec bins |
 |
 |
| Parameter | Plot |
|---|---|
| CZT HV Monitor | 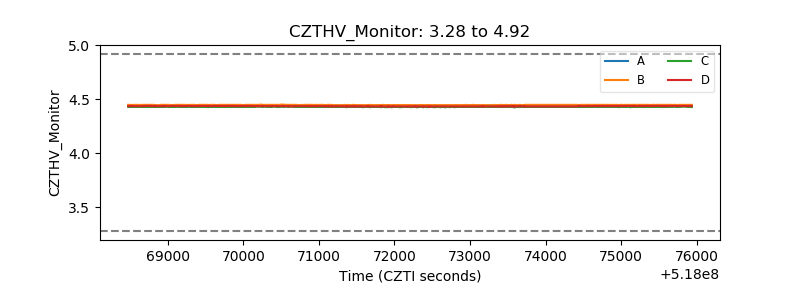 |
| D_VDD | 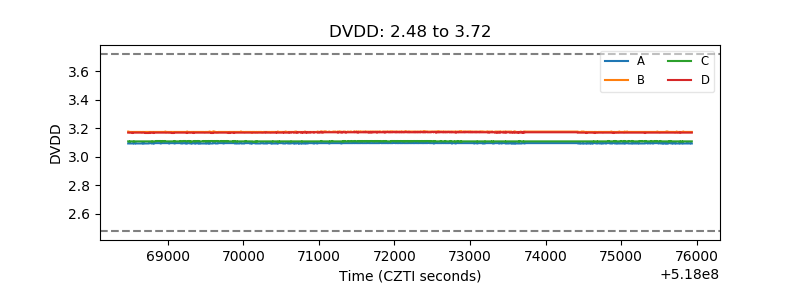 |
| Temperature 1 | 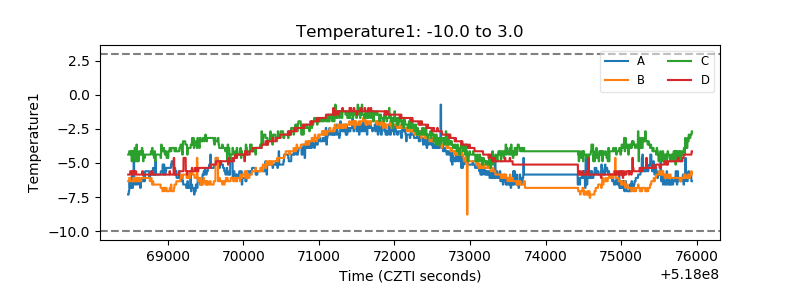 |
| Veto HV Monitor | 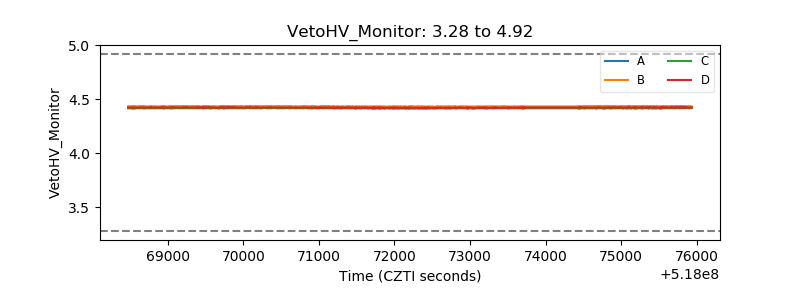 |
| Veto LLD | 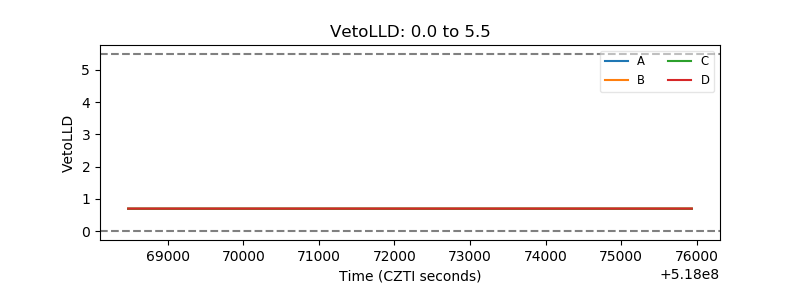 |
| Alpha Counter | 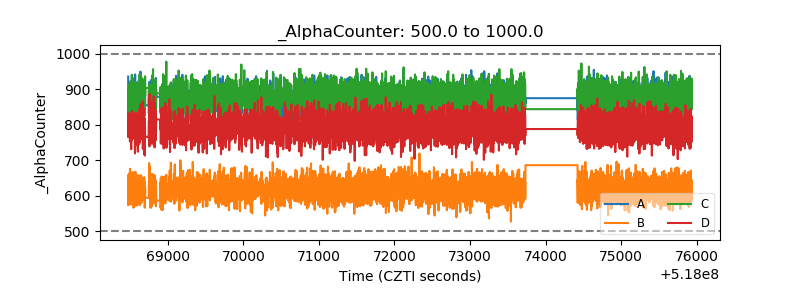 |
| _CPM_Rate | 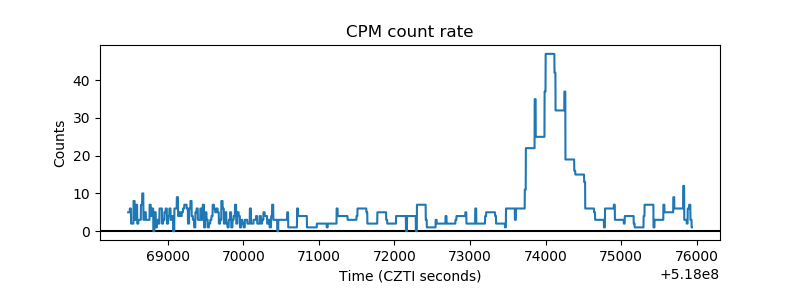 |
| CZT Counter | 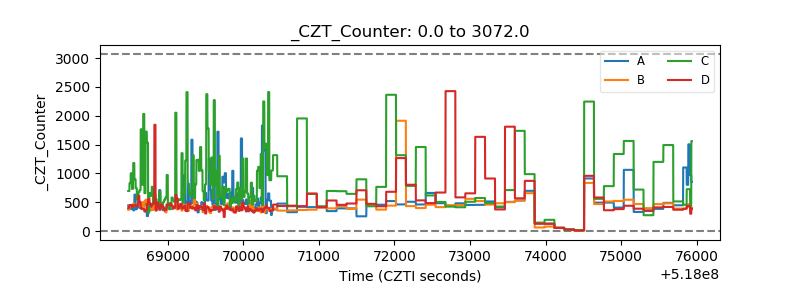 |
| +2.5 Volts monitor | 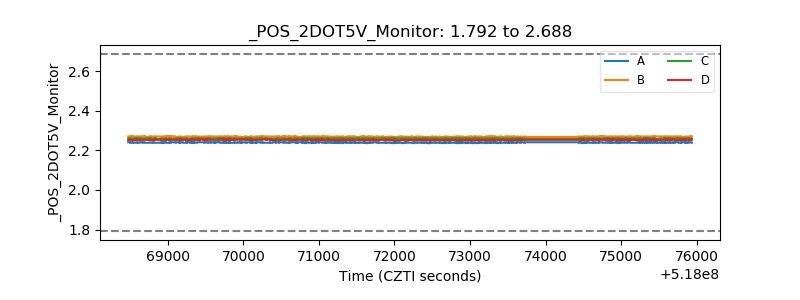 |
| +5 Volts monitor | 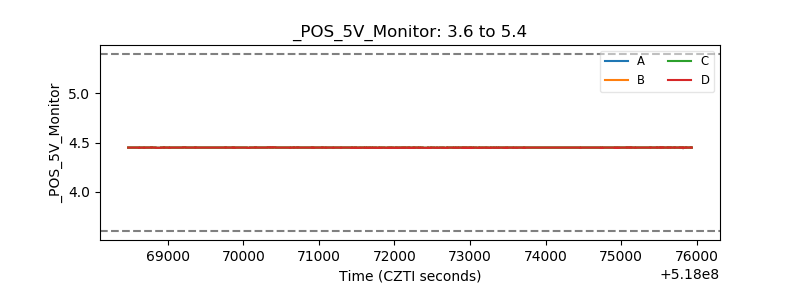 |
| _ROLL_ROT | 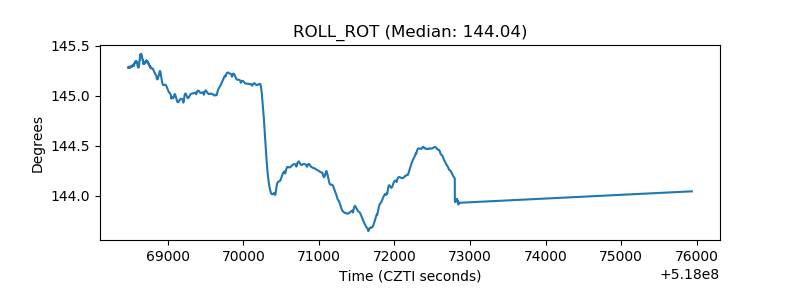 |
| _Roll_DEC | 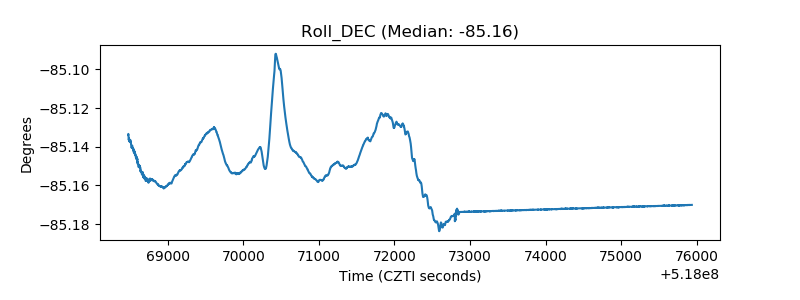 |
| _Roll_RA | 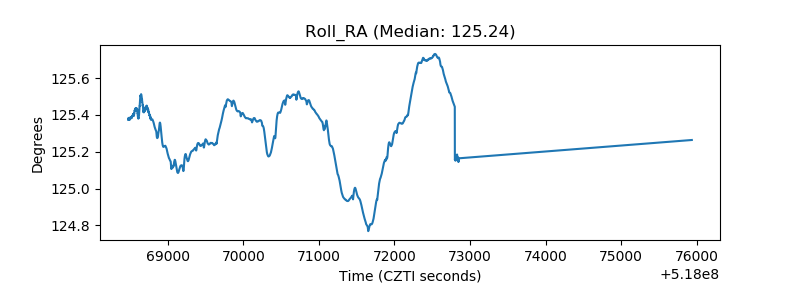 |
| Veto Counter | 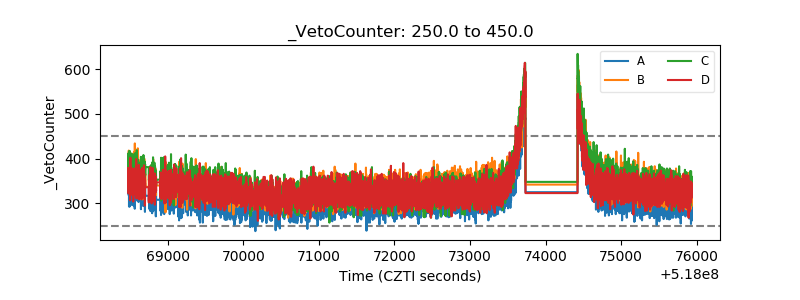 |