| Param | Original file | Final file |
|---|---|---|
| Filename | modeM0/AS1A14_083T16_9000006580_57775cztM0_level2.fits | modeM0/AS1A14_083T16_9000006580_57775cztM0_level2_quad_clean.evt |
| Size (bytes) | 506,102,400 | 103,631,040 |
| Size | 482.7 MB | 98.8 MB |
| Events in quadrant A | 3,523,135 | 683,240 |
| Events in quadrant B | 3,767,736 | 720,755 |
| Events in quadrant C | 6,722,774 | 608,869 |
| Events in quadrant D | 4,150,567 | 614,221 |
| Mode SS | |||
|---|---|---|---|
| Quadrant | BADHDUFLAG | Total packets | Discarded packets |
| A | 0 | 148 | 0 |
| B | 0 | 148 | 0 |
| C | 0 | 148 | 0 |
| D | 0 | 148 | 0 |
| Mode M0 | |||
|---|---|---|---|
| Quadrant | BADHDUFLAG | Total packets | Discarded packets |
| A | 0 | 16092 | 0 |
| B | 0 | 16539 | 0 |
| C | 0 | 25048 | 0 |
| D | 0 | 17751 | 0 |
| Quadrant | Total seconds | Saturated seconds | Saturation percentage |
|---|---|---|---|
| A | 7334 | 203 | 2.767930% |
| B | 7333 | 352 | 4.800218% |
| C | 7333 | 808 | 11.018683% |
| D | 7334 | 225 | 3.067903% |
Noise dominated data is calculated using 1-second bins in cleaned event files. If a bin has >2000 counts, and if more than 50% of those come from <1% of pixels, then it is considered to be noise-dominated and hence unusable.
| Quadrant | # 1 sec bins | Bins with >0 counts | Bins with >2000 counts | High rate bins dominated by noise | Noise dominated (total time) | Noise dominated (detector-on time) | Marked lightcurve |
|---|---|---|---|---|---|---|---|
| A | 7334 | 7334 | 39 | 39 | 0.53% | 0.53% | 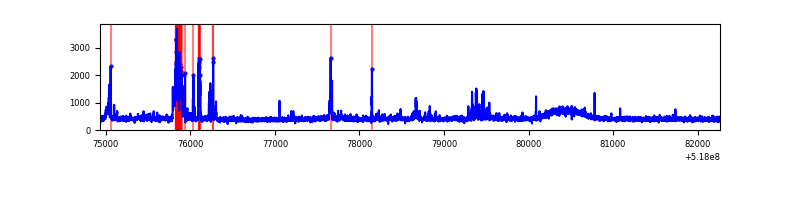 |
| B | 7333 | 7333 | 56 | 56 | 0.76% | 0.76% | 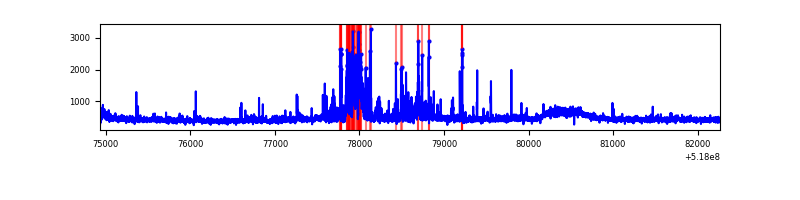 |
| C | 7333 | 7333 | 395 | 395 | 5.39% | 5.39% | 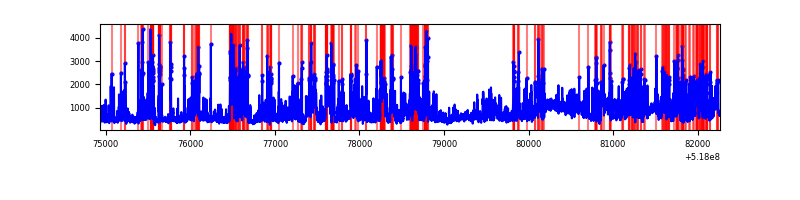 |
| D | 7334 | 7334 | 150 | 150 | 2.05% | 2.05% | 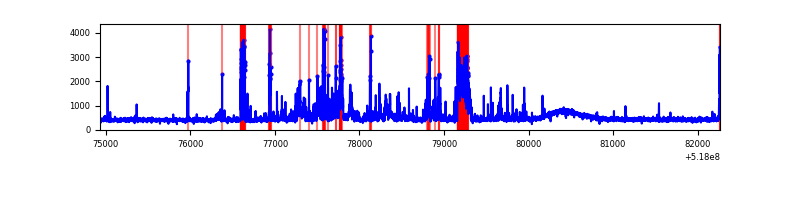 |
Top three noisy pixels from each quadrant. If the there are fewer than three noisy pixels in the level2.evt file, extra rows are filled as -1
| Pixel properties | Quadrant properties | ||||||
|---|---|---|---|---|---|---|---|
| Quadrant | DetID | PixID | Counts | Sigma | Mean | Median | Sigma |
| A | 3 | 14 | 334462 | 1711.33 | 792 | 769 | 195.0 |
| A | 3 | 61 | 59208 | 299.7 | 792 | 769 | 195.0 |
| A | 4 | 158 | 42183 | 212.39 | 792 | 769 | 195.0 |
| B | 4 | 171 | 339113 | 2055.49 | 780 | 753 | 164.6 |
| B | 4 | 80 | 97360 | 586.87 | 780 | 753 | 164.6 |
| B | 7 | 9 | 45343 | 270.88 | 780 | 753 | 164.6 |
| C | 9 | 38 | 2369066 | 11693.15 | 750 | 744 | 202.5 |
| C | 15 | 224 | 1172322 | 5784.45 | 750 | 744 | 202.5 |
| C | 14 | 254 | 65802 | 321.21 | 750 | 744 | 202.5 |
| D | 3 | 224 | 273412 | 1279.58 | 768 | 733 | 213.1 |
| D | 8 | 160 | 240512 | 1125.19 | 768 | 733 | 213.1 |
| D | 3 | 12 | 221167 | 1034.41 | 768 | 733 | 213.1 |
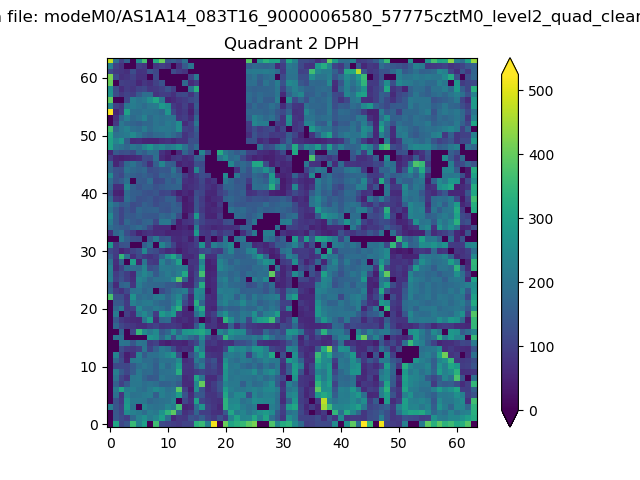
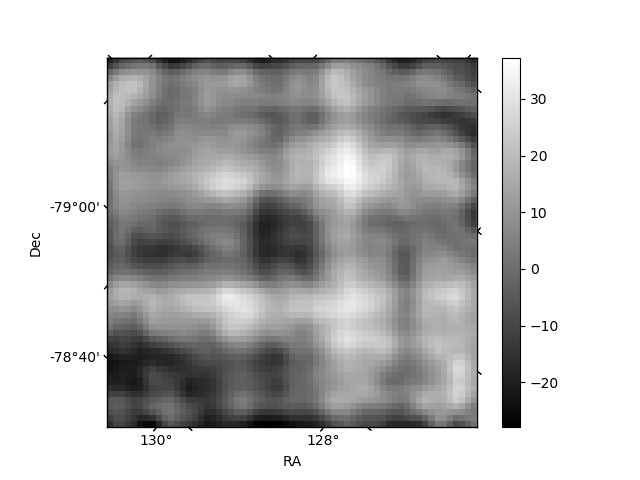
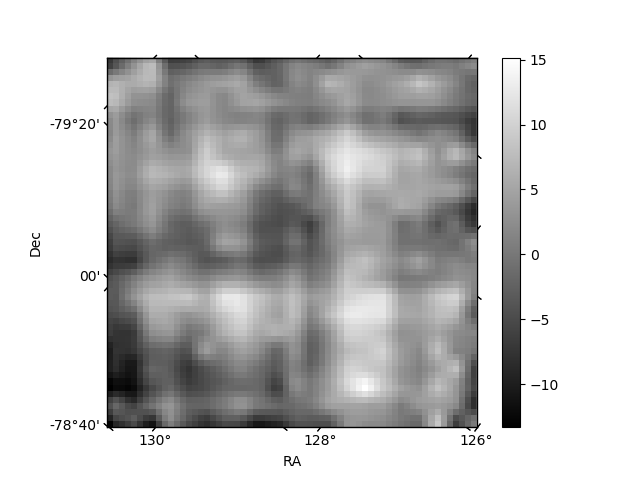
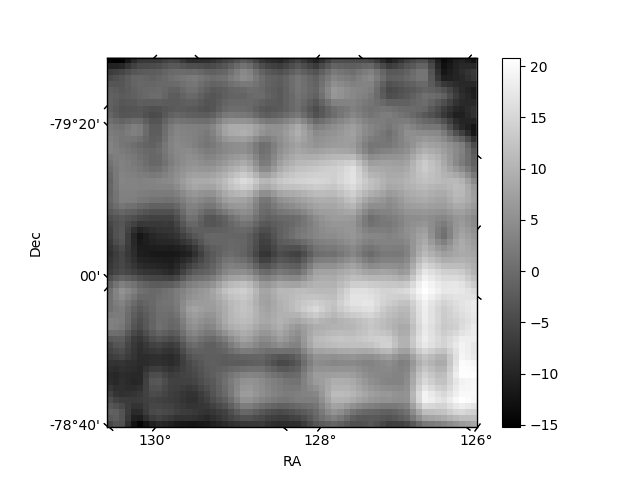
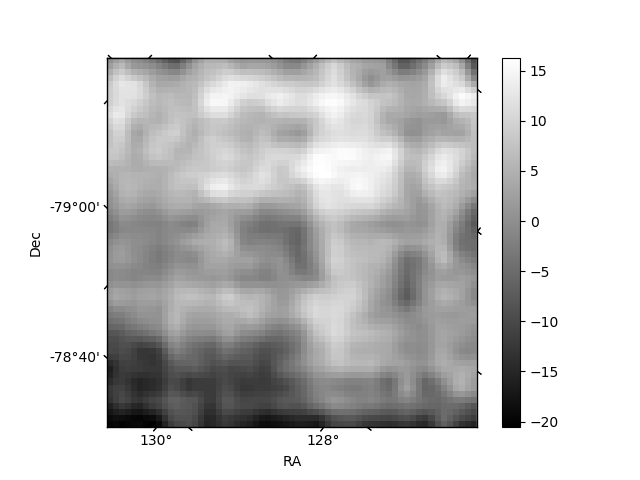
Histogram calculated using DETX and DETY for each event in the final _common_clean file
| Quadrant A | 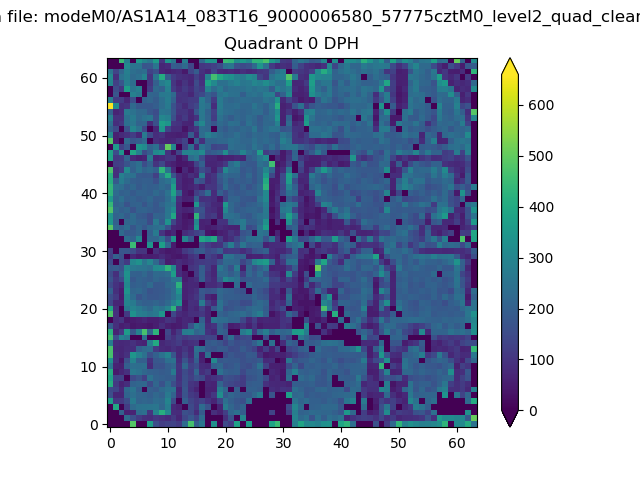 |
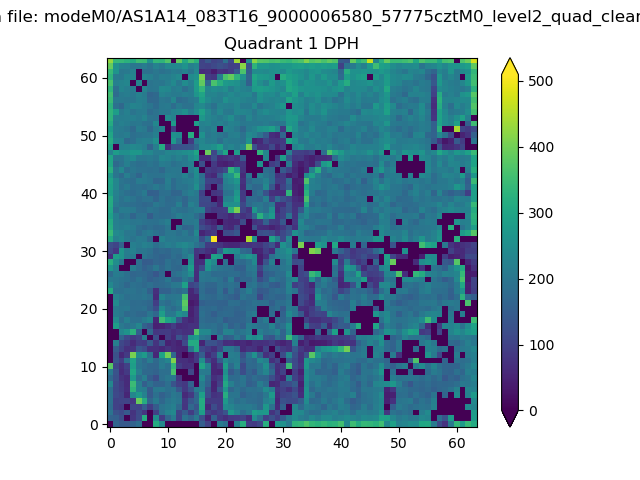 |
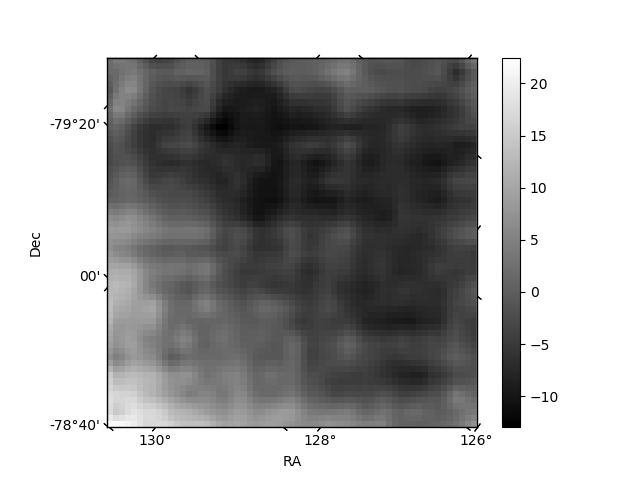
Quadrant B |
|---|---|---|---|
| Quadrant D | 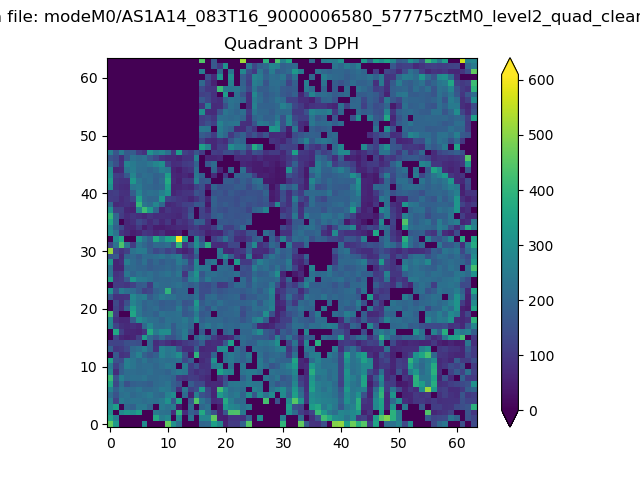 |
 |
Quadrant C |
| Plot type | Count rate plots | Images |
|---|---|---|
| Comparison with Poisson distribution Blue bars denote a histogram of data divided into 1 sec bins. Red curve is a Poisson curve with rate = median count rate of data. |
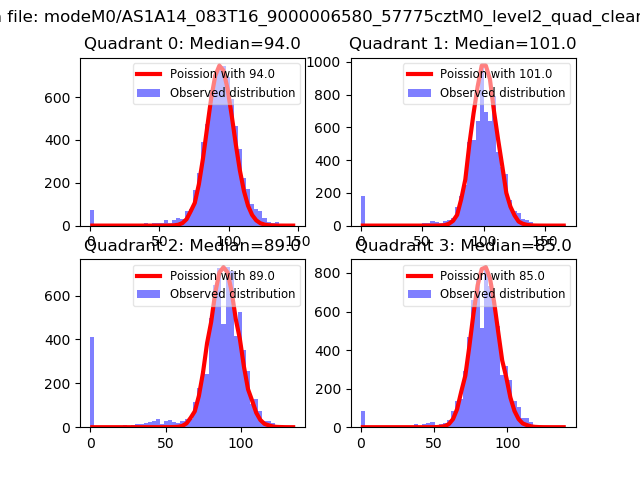 |
 |
| Quadrant-wise count rates Data is divided into 100 sec bins |
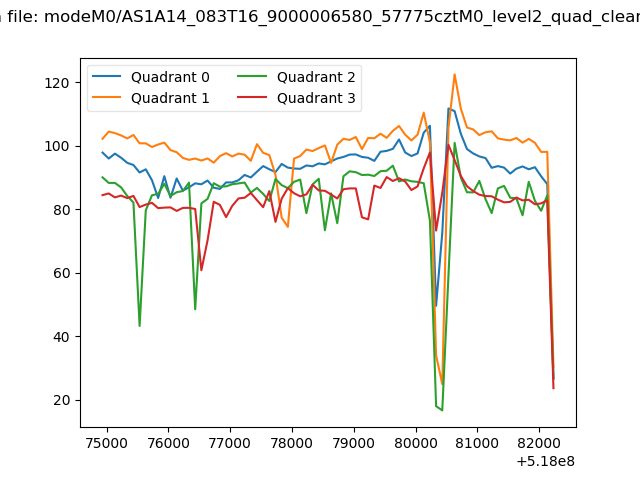 |
|
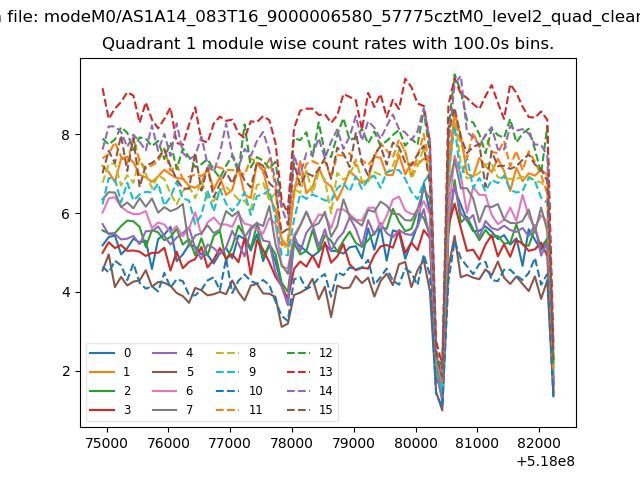
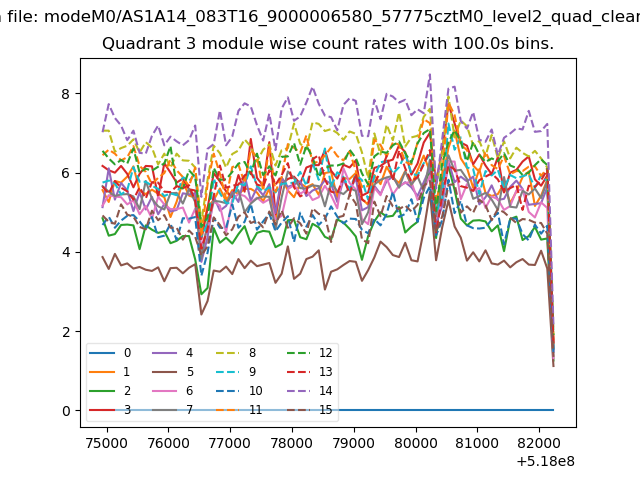
| Module-wise count rates for Quadrant A Data is divided into 100 sec bins |
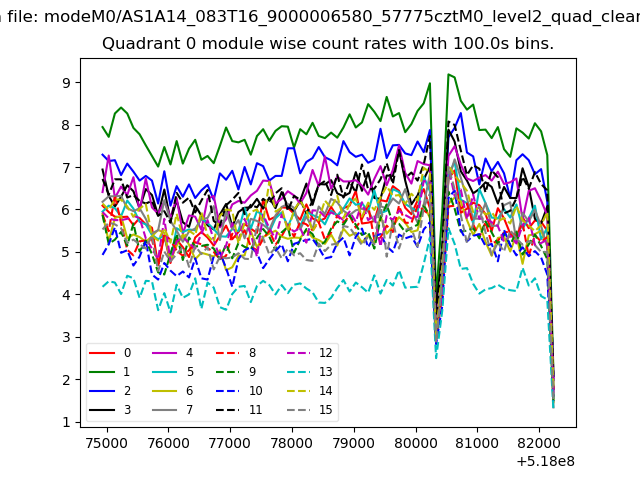 |
 |
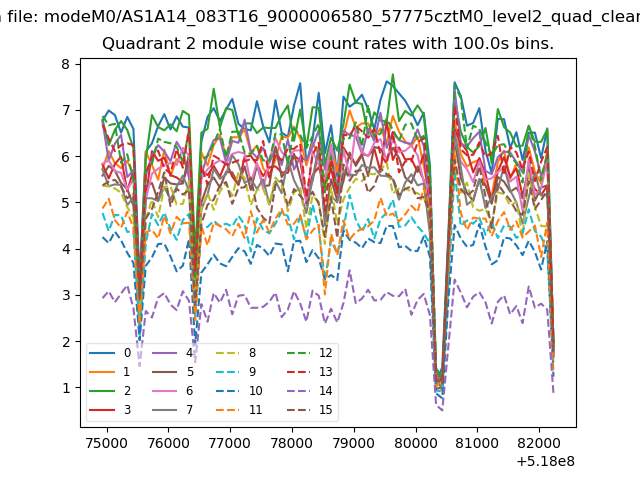
| Module-wise count rates for Quadrant B Data is divided into 100 sec bins |
 |
 |
| Module-wise count rates for Quadrant C Data is divided into 100 sec bins |
 |
 |
| Module-wise count rates for Quadrant D Data is divided into 100 sec bins |
 |
 |
| Parameter | Plot |
|---|---|
| CZT HV Monitor | 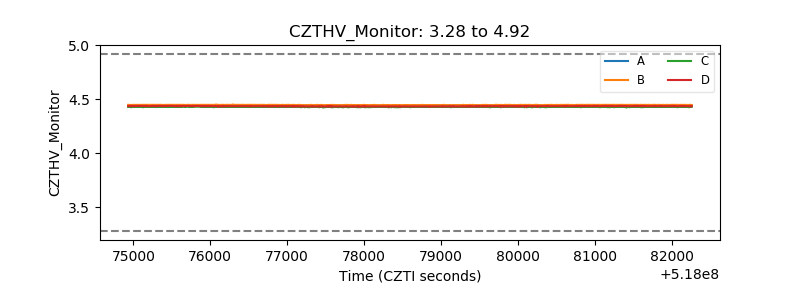 |
| D_VDD | 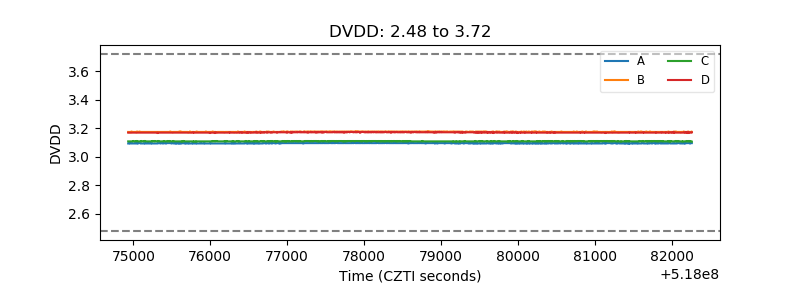 |
| Temperature 1 | 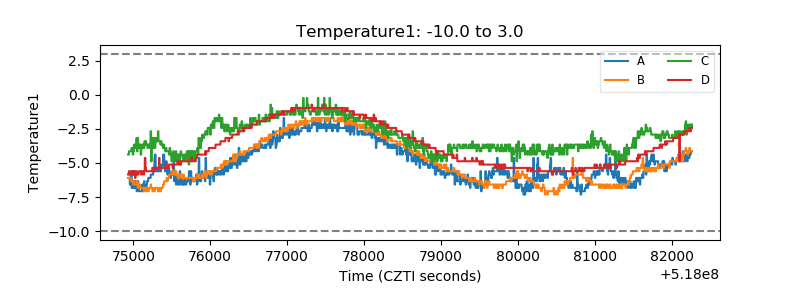 |
| Veto HV Monitor | 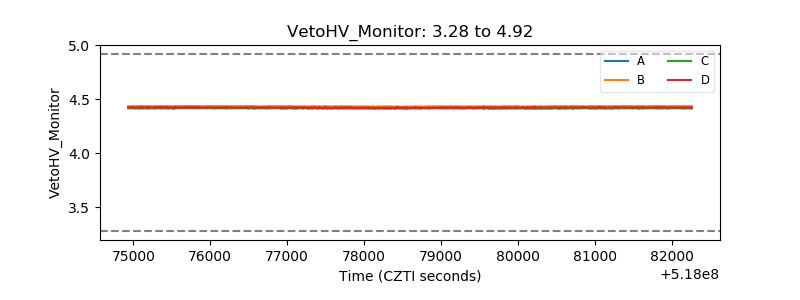 |
| Veto LLD | 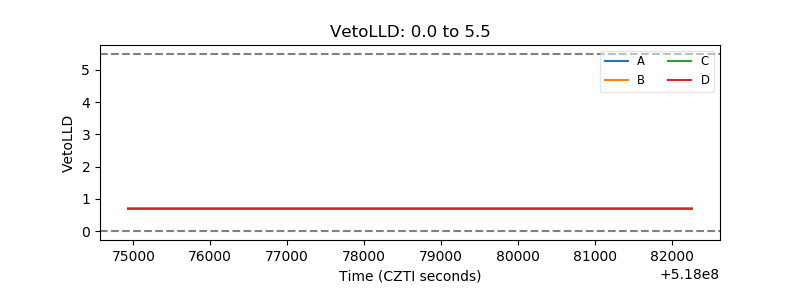 |
| Alpha Counter | 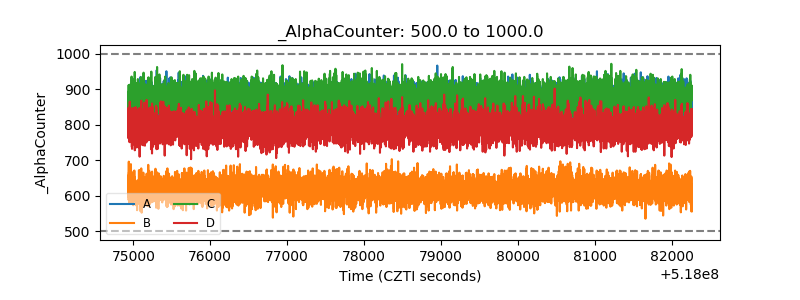 |
| _CPM_Rate | 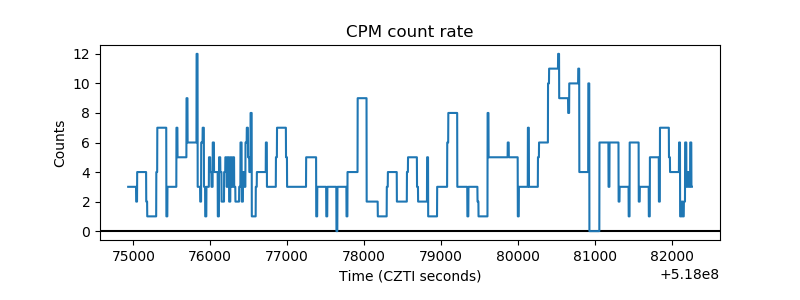 |
| CZT Counter | 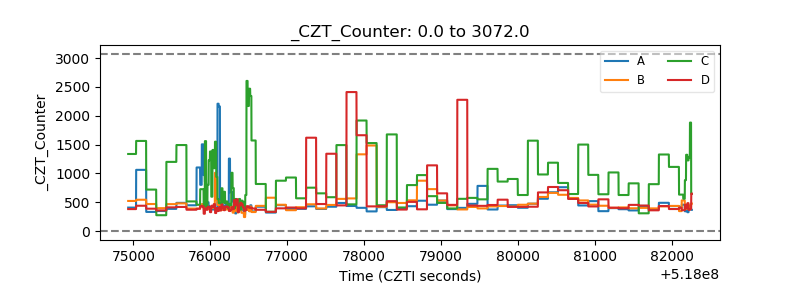 |
| +2.5 Volts monitor | 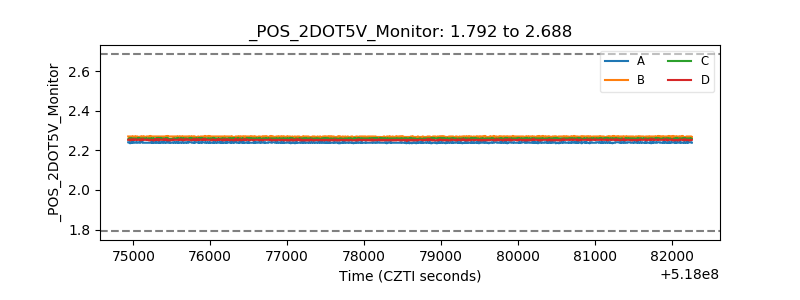 |
| +5 Volts monitor |  |
| _ROLL_ROT | 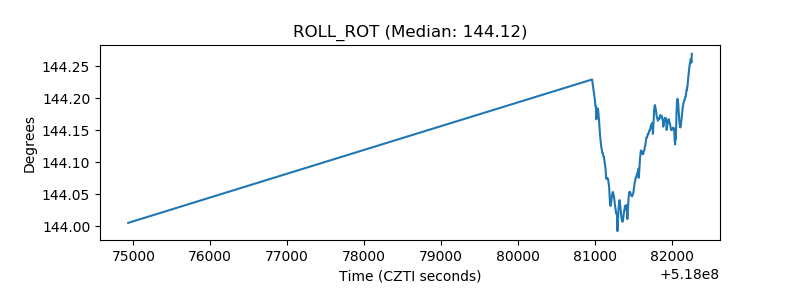 |
| _Roll_DEC | 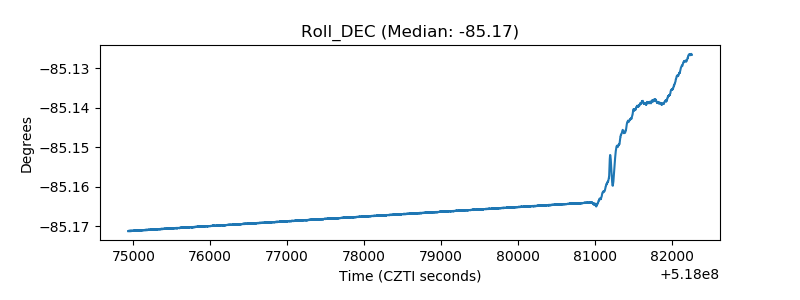 |
| _Roll_RA | 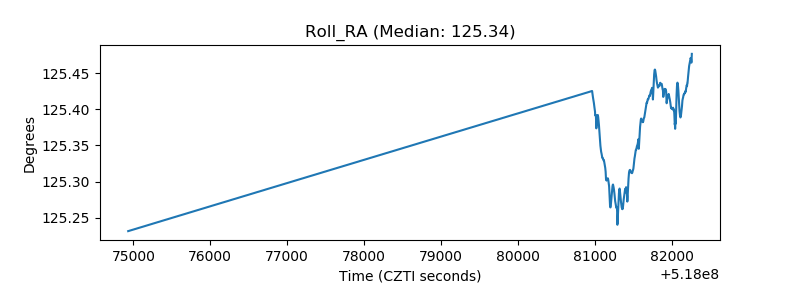 |
| Veto Counter | 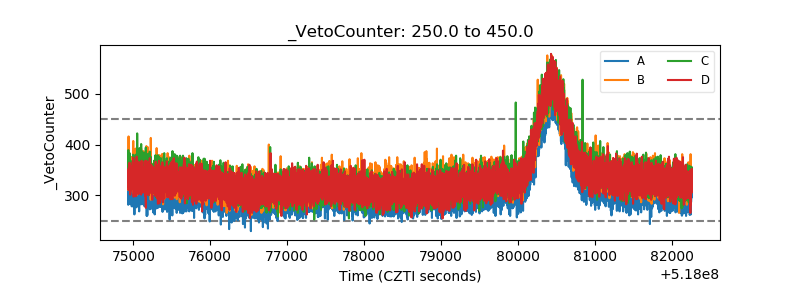 |