| Param | Original file | Final file |
|---|---|---|
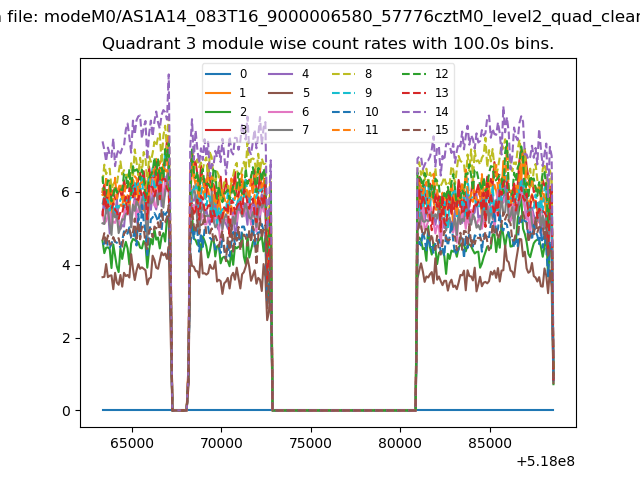
| Filename | modeM0/AS1A14_083T16_9000006580_57776cztM0_level2.fits | modeM0/AS1A14_083T16_9000006580_57776cztM0_level2_quad_clean.evt |
| Size (bytes) | 1,152,708,480 | 228,375,360 |
| Size | 1.1 GB | 217.8 MB |
| Events in quadrant A | 7,703,410 | 1,520,775 |
| Events in quadrant B | 8,083,808 | 1,633,647 |
| Events in quadrant C | 17,235,929 | 1,299,695 |
| Events in quadrant D | 8,399,560 | 1,348,924 |
| Mode SS | |||
|---|---|---|---|
| Quadrant | BADHDUFLAG | Total packets | Discarded packets |
| A | 0 | 324 | 0 |
| B | 0 | 324 | 0 |
| C | 0 | 324 | 0 |
| D | 0 | 324 | 0 |
| Mode M0 | |||
|---|---|---|---|
| Quadrant | BADHDUFLAG | Total packets | Discarded packets |
| A | 0 | 34795 | 1 |
| B | 0 | 35572 | 1 |
| C | 0 | 62508 | 1 |
| D | 0 | 36660 | 1 |
| Mode M9 | |||
|---|---|---|---|
| Quadrant | BADHDUFLAG | Total packets | Discarded packets |
| A | 0 | 10 | 0 |
| B | 0 | 10 | 0 |
| C | 0 | 10 | 0 |
| D | 0 | 10 | 0 |
| Quadrant | Total seconds | Saturated seconds | Saturation percentage |
|---|---|---|---|
| A | 16116 | 130 | 0.806652% |
| B | 16117 | 169 | 1.048582% |
| C | 16117 | 2173 | 13.482658% |
| D | 16117 | 288 | 1.786933% |
Noise dominated data is calculated using 1-second bins in cleaned event files. If a bin has >2000 counts, and if more than 50% of those come from <1% of pixels, then it is considered to be noise-dominated and hence unusable.
| Quadrant | # 1 sec bins | Bins with >0 counts | Bins with >2000 counts | High rate bins dominated by noise | Noise dominated (total time) | Noise dominated (detector-on time) | Marked lightcurve |
|---|---|---|---|---|---|---|---|
| A | 25221 | 16118 | 26 | 26 | 0.10% | 0.16% | 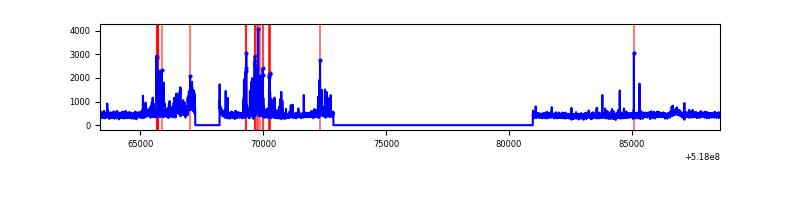 |
| B | 25221 | 16119 | 37 | 37 | 0.15% | 0.23% | 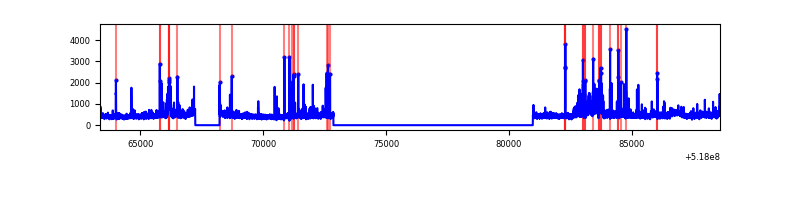 |
| C | 25221 | 16119 | 1600 | 1600 | 6.34% | 9.93% | 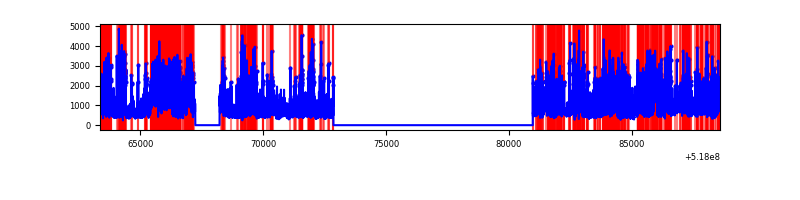 |
| D | 25221 | 16119 | 226 | 226 | 0.90% | 1.40% | 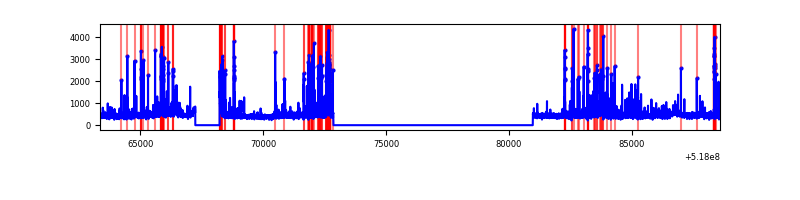 |
Top three noisy pixels from each quadrant. If the there are fewer than three noisy pixels in the level2.evt file, extra rows are filled as -1
| Pixel properties | Quadrant properties | ||||||
|---|---|---|---|---|---|---|---|
| Quadrant | DetID | PixID | Counts | Sigma | Mean | Median | Sigma |
| A | 3 | 14 | 964803 | 2332.24 | 1692 | 1650 | 413.0 |
| A | 3 | 128 | 112637 | 268.75 | 1692 | 1650 | 413.0 |
| A | 4 | 158 | 31372 | 71.97 | 1692 | 1650 | 413.0 |
| B | 4 | 80 | 687998 | 1950.51 | 1675 | 1614 | 351.9 |
| B | 5 | 185 | 197622 | 557.0 | 1675 | 1614 | 351.9 |
| B | 4 | 171 | 102431 | 286.49 | 1675 | 1614 | 351.9 |
| C | 9 | 38 | 7606086 | 17756.69 | 1582 | 1565 | 428.3 |
| C | 15 | 224 | 2723427 | 6355.6 | 1582 | 1565 | 428.3 |
| C | 14 | 254 | 185317 | 429.06 | 1582 | 1565 | 428.3 |
| D | 9 | 102 | 351133 | 752.72 | 1645 | 1569 | 464.4 |
| D | 8 | 160 | 282958 | 605.92 | 1645 | 1569 | 464.4 |
| D | 3 | 224 | 272034 | 582.39 | 1645 | 1569 | 464.4 |
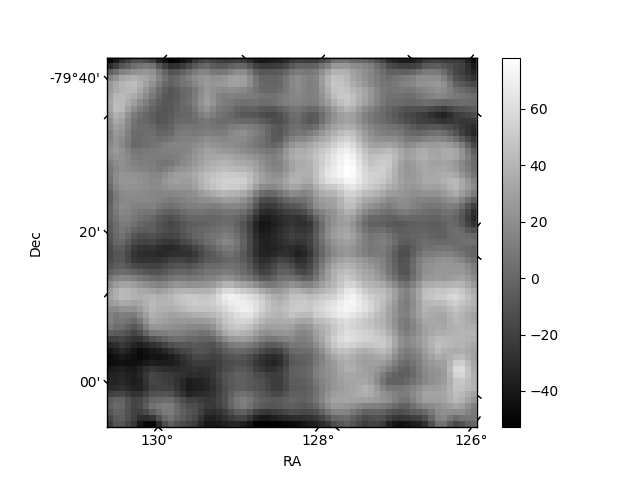
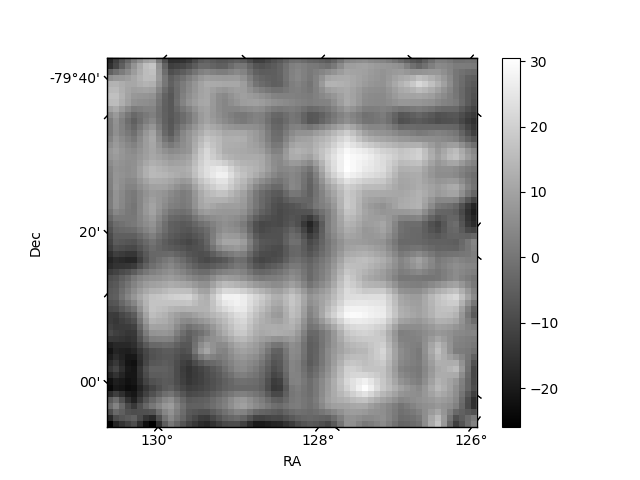
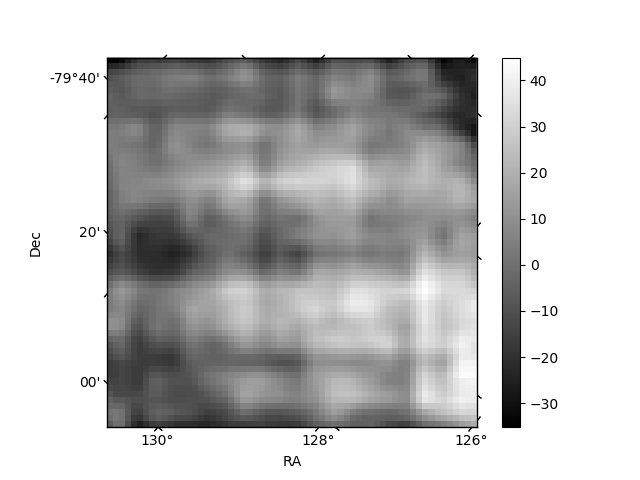
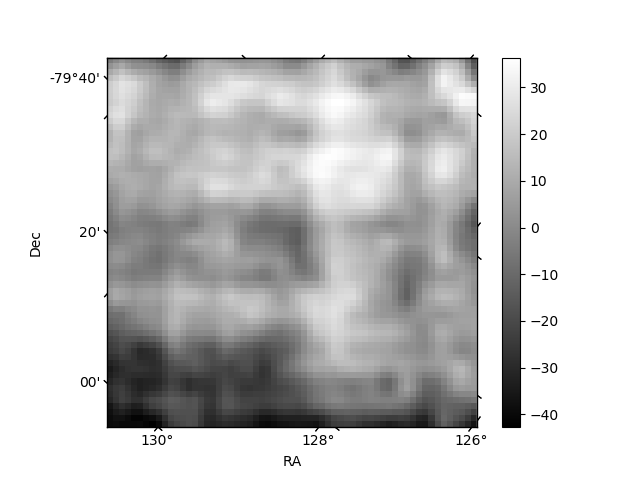
Histogram calculated using DETX and DETY for each event in the final _common_clean file
| Quadrant A | 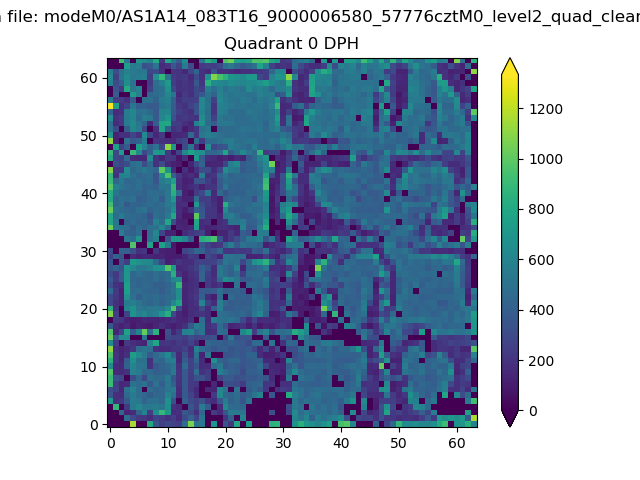 |
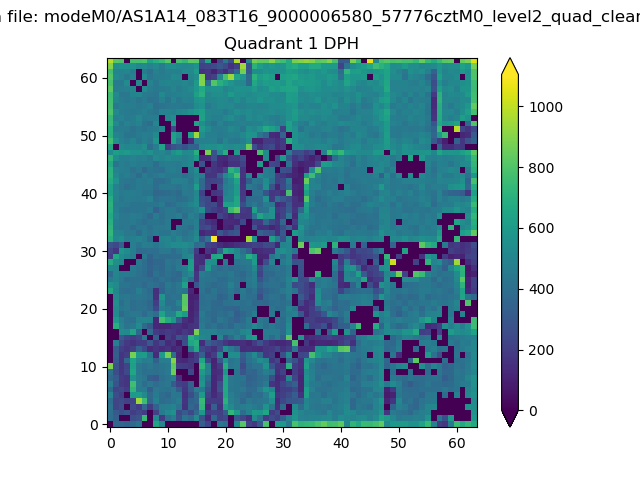 |
Quadrant B |
|---|---|---|---|
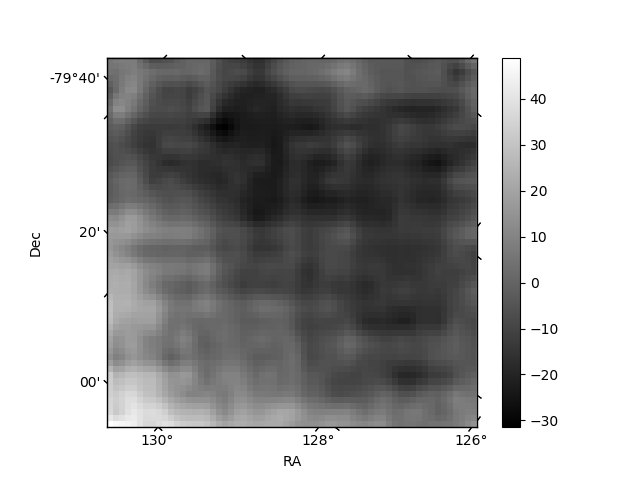
| Quadrant D | 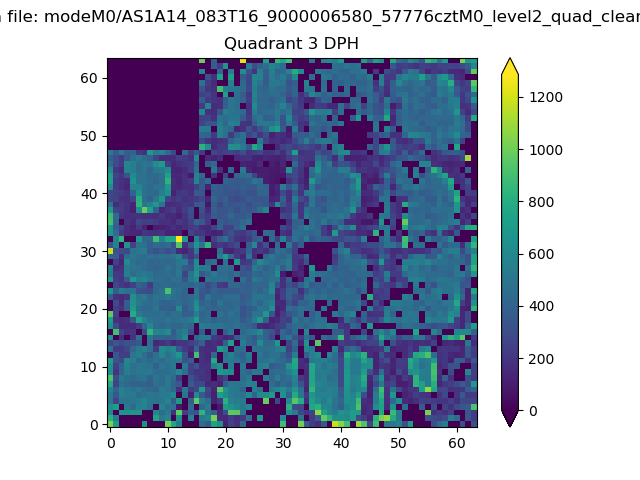 |
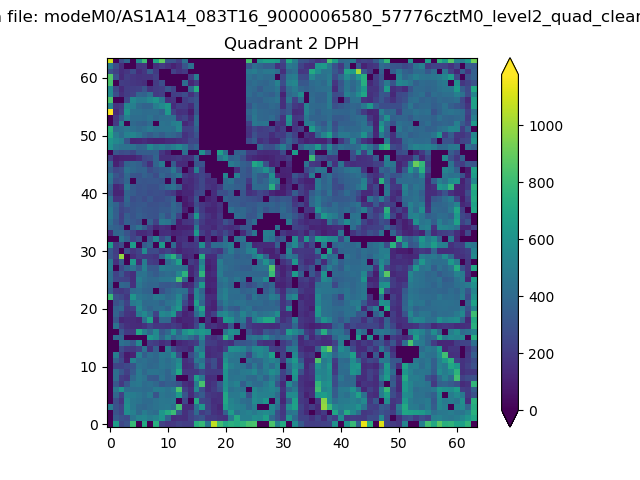 |
Quadrant C |
| Plot type | Count rate plots | Images |
|---|---|---|
| Comparison with Poisson distribution Blue bars denote a histogram of data divided into 1 sec bins. Red curve is a Poisson curve with rate = median count rate of data. |
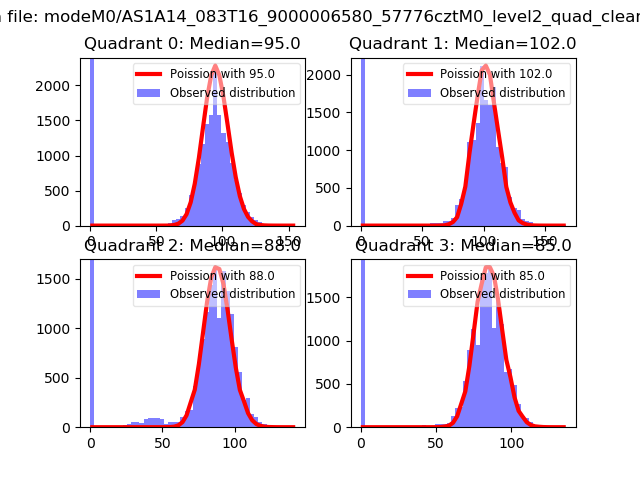 |
 |
| Quadrant-wise count rates Data is divided into 100 sec bins |
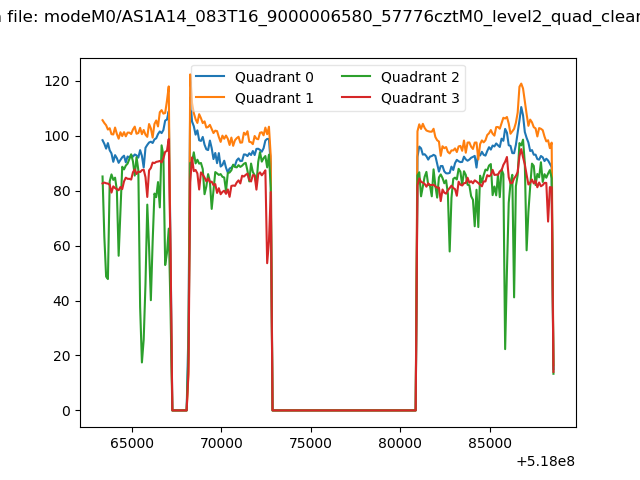 |
|
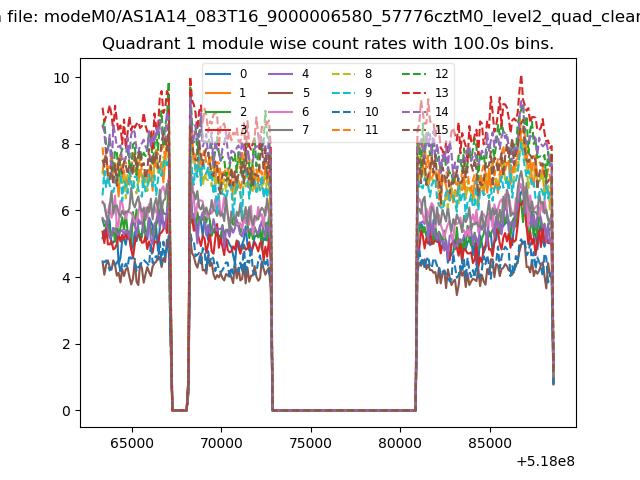
| Module-wise count rates for Quadrant A Data is divided into 100 sec bins |
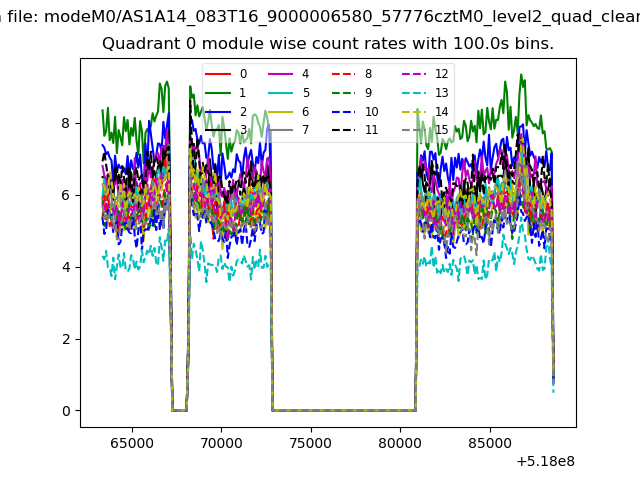 |
 |
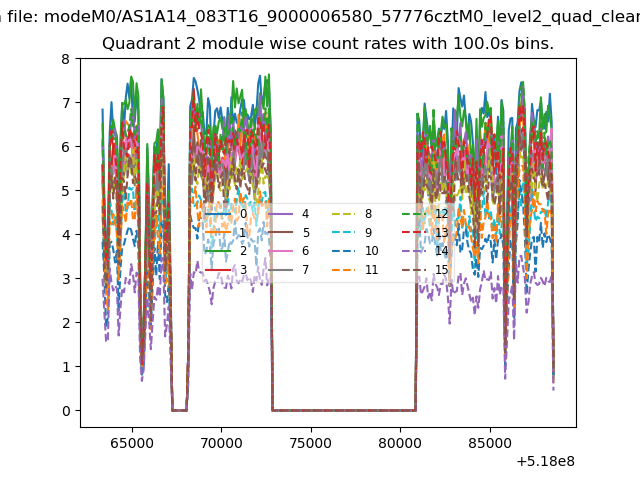
| Module-wise count rates for Quadrant B Data is divided into 100 sec bins |
 |
 |
| Module-wise count rates for Quadrant C Data is divided into 100 sec bins |
 |
 |
| Module-wise count rates for Quadrant D Data is divided into 100 sec bins |
 |
 |
| Parameter | Plot |
|---|---|
| CZT HV Monitor | 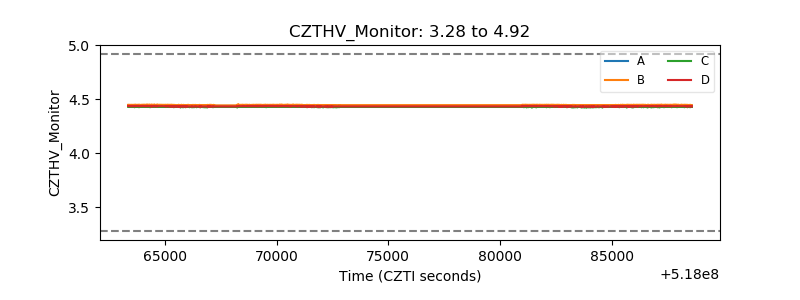 |
| D_VDD | 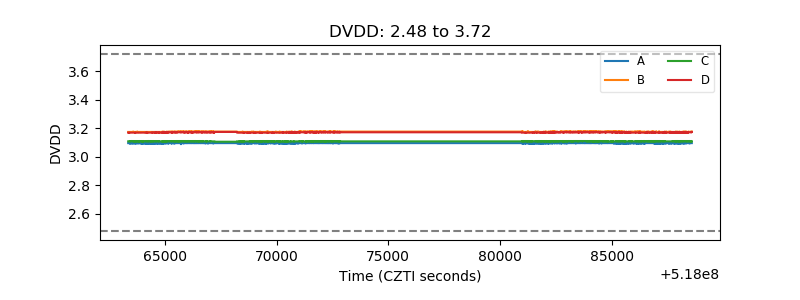 |
| Temperature 1 | 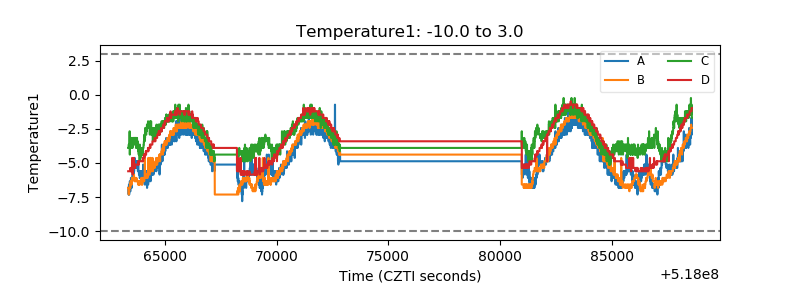 |
| Veto HV Monitor | 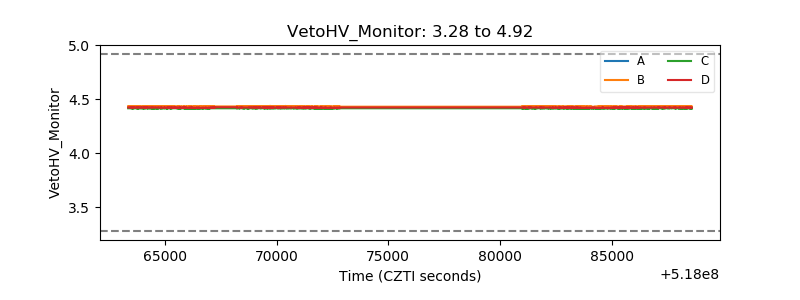 |
| Veto LLD | 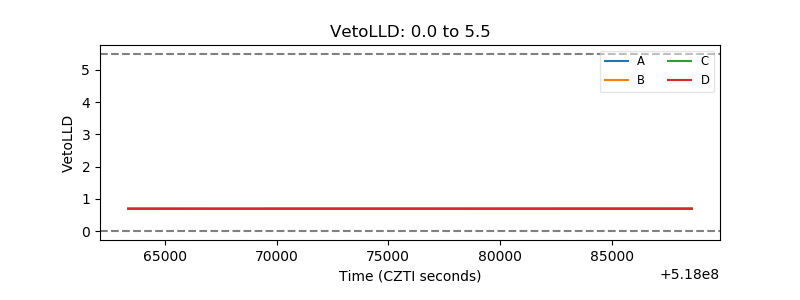 |
| Alpha Counter | 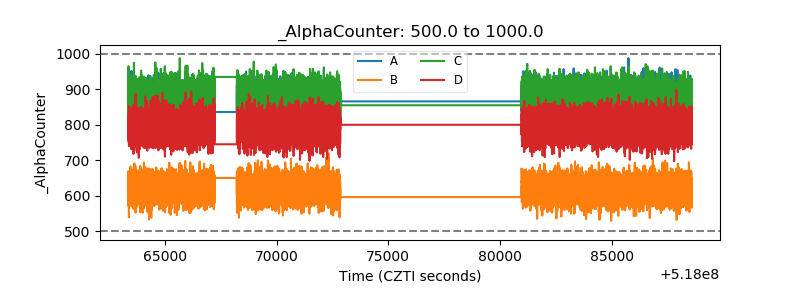 |
| _CPM_Rate | 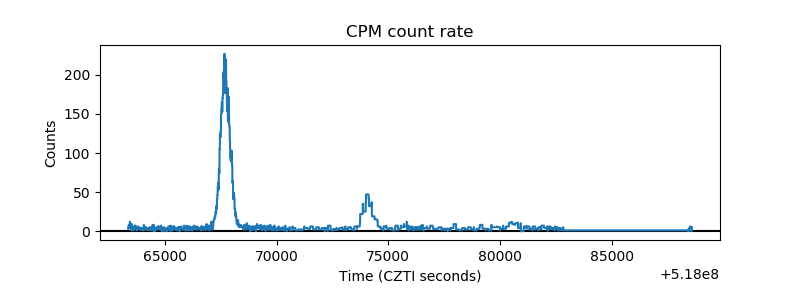 |
| CZT Counter | 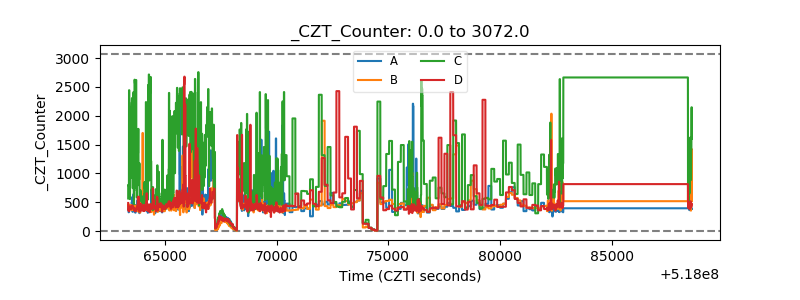 |
| +2.5 Volts monitor |  |
| +5 Volts monitor | 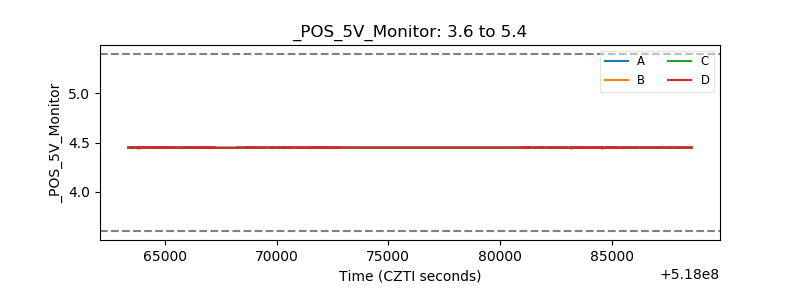 |
| _ROLL_ROT | 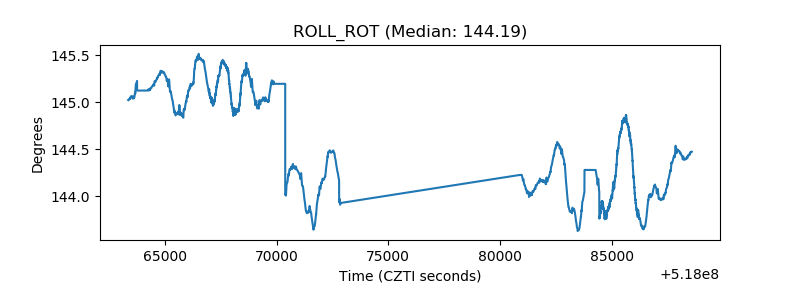 |
| _Roll_DEC | 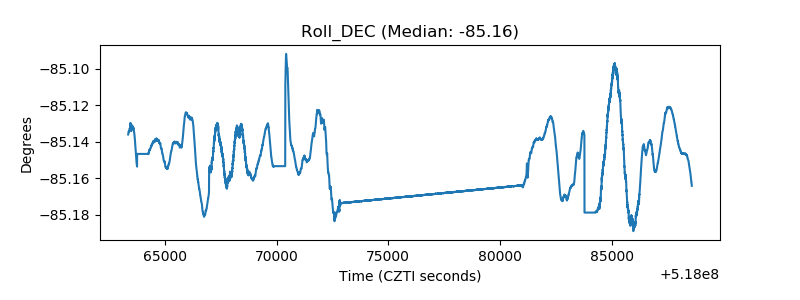 |
| _Roll_RA | 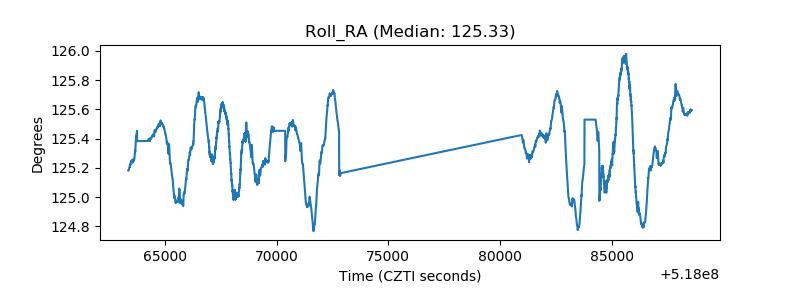 |
| Veto Counter | 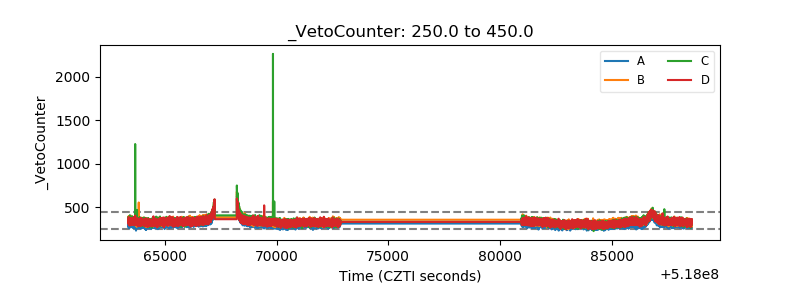 |