| Param | Original file | Final file |
|---|---|---|
| Filename | modeM0/AS1A14_083T16_9000006580_57781cztM0_level2.fits | modeM0/AS1A14_083T16_9000006580_57781cztM0_level2_quad_clean.evt |
| Size (bytes) | 607,337,280 | 87,779,520 |
| Size | 579.2 MB | 83.7 MB |
| Events in quadrant A | 5,691,961 | 543,292 |
| Events in quadrant B | 3,871,374 | 645,341 |
| Events in quadrant C | 7,855,589 | 489,379 |
| Events in quadrant D | 4,563,691 | 530,441 |
| Mode SS | |||
|---|---|---|---|
| Quadrant | BADHDUFLAG | Total packets | Discarded packets |
| A | 0 | 130 | 0 |
| B | 0 | 130 | 0 |
| C | 0 | 130 | 0 |
| D | 0 | 130 | 0 |
| Mode M0 | |||
|---|---|---|---|
| Quadrant | BADHDUFLAG | Total packets | Discarded packets |
| A | 0 | 21148 | 1 |
| B | 0 | 16082 | 1 |
| C | 0 | 27784 | 1 |
| D | 0 | 18133 | 1 |
| Mode M9 | |||
|---|---|---|---|
| Quadrant | BADHDUFLAG | Total packets | Discarded packets |
| A | 0 | 9 | 0 |
| B | 0 | 9 | 0 |
| C | 0 | 9 | 0 |
| D | 0 | 9 | 0 |
| Quadrant | Total seconds | Saturated seconds | Saturation percentage |
|---|---|---|---|
| A | 6440 | 838 | 13.012422% |
| B | 6440 | 106 | 1.645963% |
| C | 6440 | 1244 | 19.316770% |
| D | 6440 | 303 | 4.704969% |
Noise dominated data is calculated using 1-second bins in cleaned event files. If a bin has >2000 counts, and if more than 50% of those come from <1% of pixels, then it is considered to be noise-dominated and hence unusable.
| Quadrant | # 1 sec bins | Bins with >0 counts | Bins with >2000 counts | High rate bins dominated by noise | Noise dominated (total time) | Noise dominated (detector-on time) | Marked lightcurve |
|---|---|---|---|---|---|---|---|
| A | 7305 | 6440 | 691 | 691 | 9.46% | 10.73% | 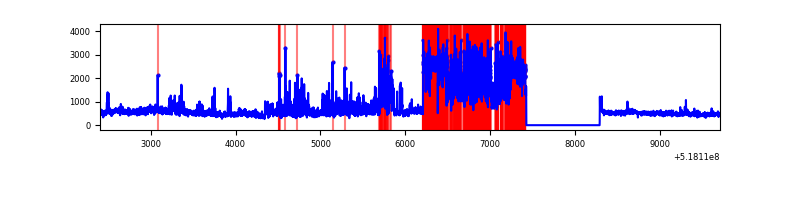 |
| B | 7305 | 6441 | 43 | 43 | 0.59% | 0.67% | 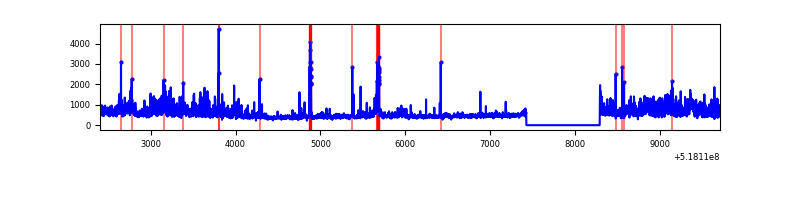 |
| C | 7305 | 6440 | 974 | 974 | 13.33% | 15.12% | 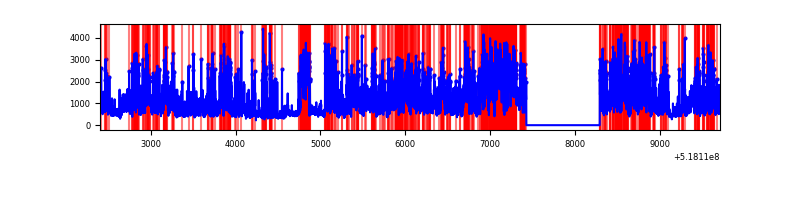 |
| D | 7305 | 6441 | 290 | 290 | 3.97% | 4.50% | 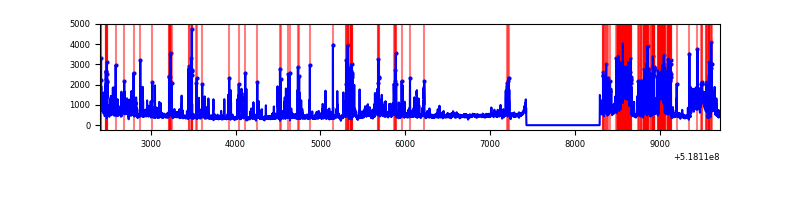 |
Top three noisy pixels from each quadrant. If the there are fewer than three noisy pixels in the level2.evt file, extra rows are filled as -1
| Pixel properties | Quadrant properties | ||||||
|---|---|---|---|---|---|---|---|
| Quadrant | DetID | PixID | Counts | Sigma | Mean | Median | Sigma |
| A | 3 | 14 | 2975173 | 18633.75 | 638 | 622 | 159.6 |
| A | 3 | 128 | 207697 | 1297.2 | 638 | 622 | 159.6 |
| A | 4 | 158 | 11924 | 70.8 | 638 | 622 | 159.6 |
| B | 4 | 80 | 874386 | 6099.01 | 670 | 646 | 143.3 |
| B | 10 | 247 | 104162 | 722.58 | 670 | 646 | 143.3 |
| B | 4 | 201 | 47781 | 329.02 | 670 | 646 | 143.3 |
| C | 9 | 38 | 2846825 | 17151.62 | 606 | 599 | 165.9 |
| C | 15 | 224 | 1912746 | 11522.77 | 606 | 599 | 165.9 |
| C | 4 | 5 | 623826 | 3755.62 | 606 | 599 | 165.9 |
| D | 8 | 160 | 972035 | 5326.6 | 644 | 615 | 182.4 |
| D | 2 | 153 | 389814 | 2134.1 | 644 | 615 | 182.4 |
| D | 3 | 12 | 313991 | 1718.34 | 644 | 615 | 182.4 |
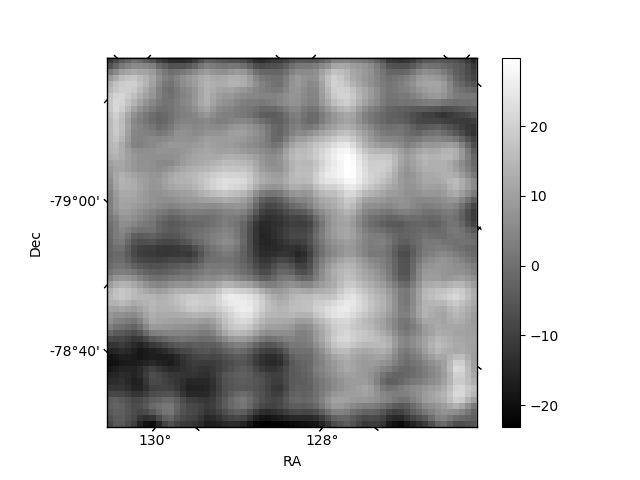
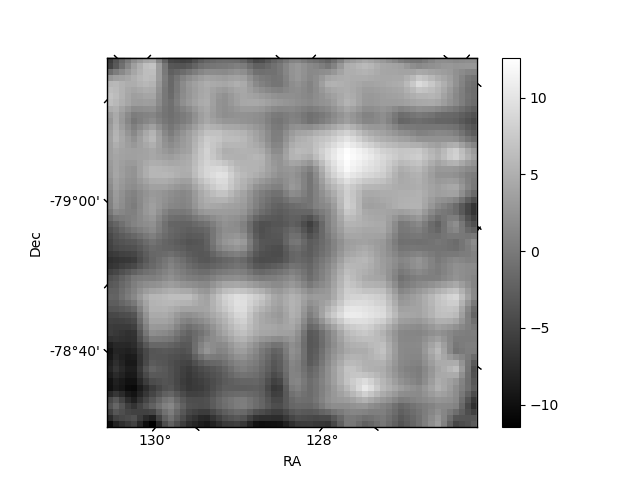
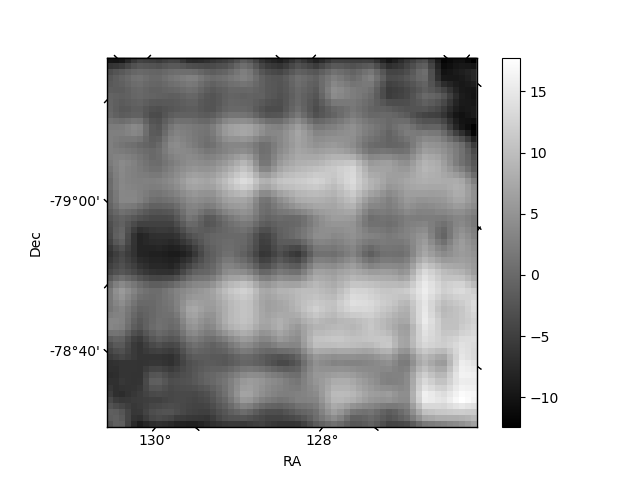
Histogram calculated using DETX and DETY for each event in the final _common_clean file
| Quadrant A | 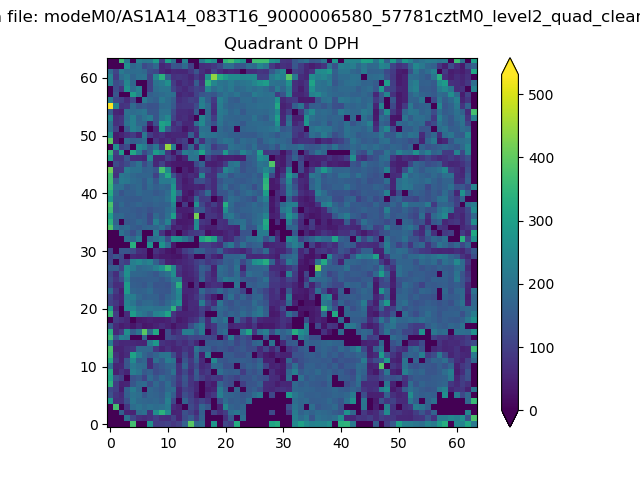 |
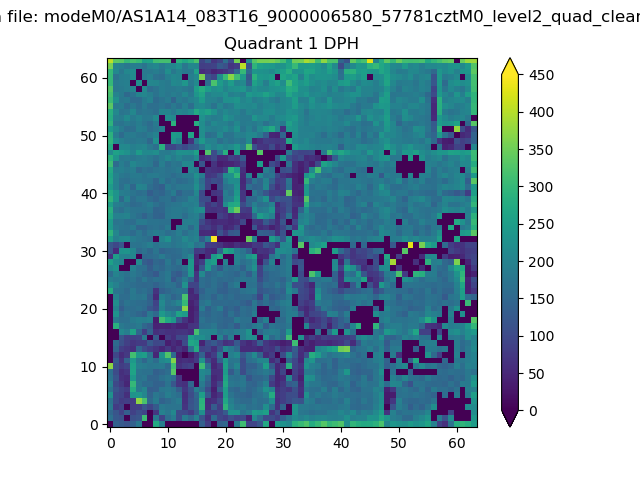 |
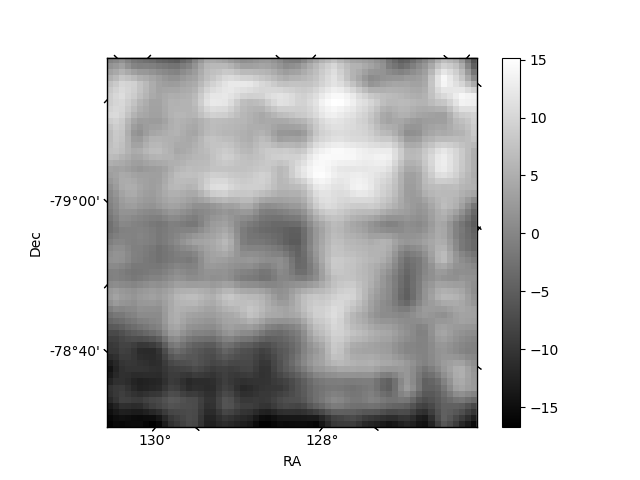
Quadrant B |
|---|---|---|---|
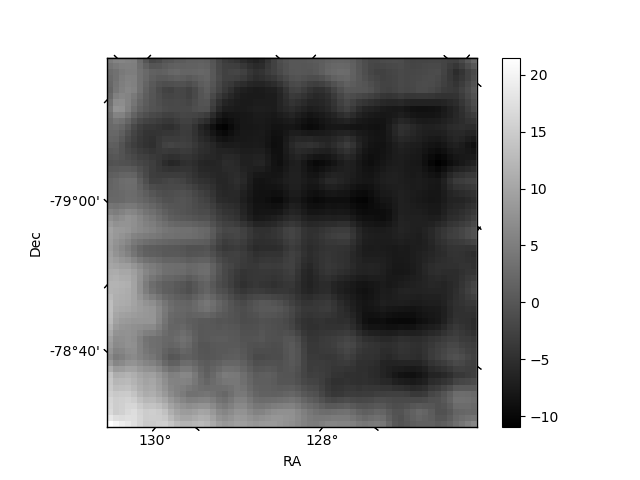
| Quadrant D | 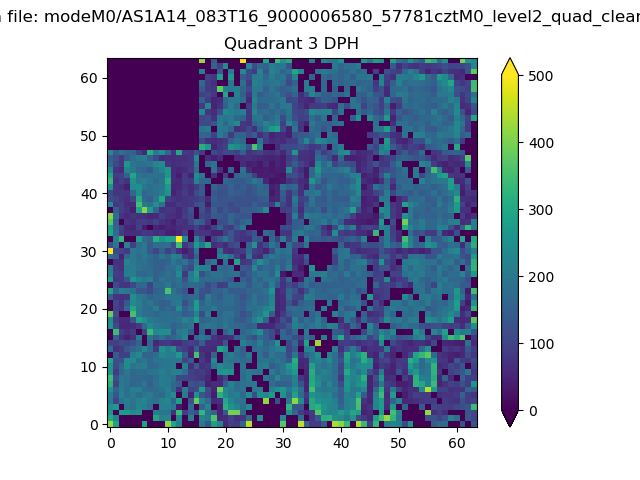 |
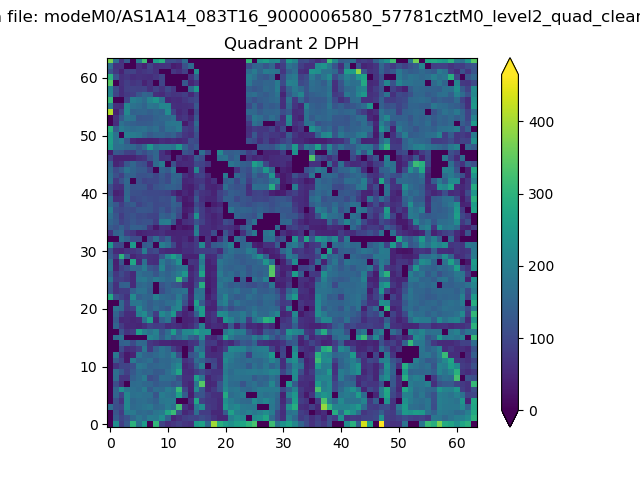 |
Quadrant C |
| Plot type | Count rate plots | Images |
|---|---|---|
| Comparison with Poisson distribution Blue bars denote a histogram of data divided into 1 sec bins. Red curve is a Poisson curve with rate = median count rate of data. |
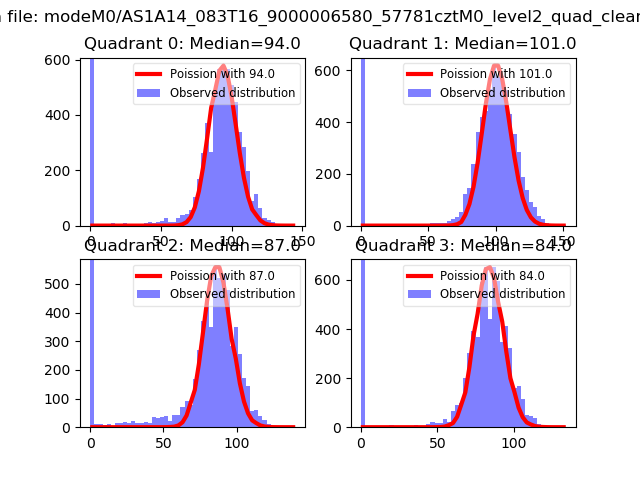 |
 |
| Quadrant-wise count rates Data is divided into 100 sec bins |
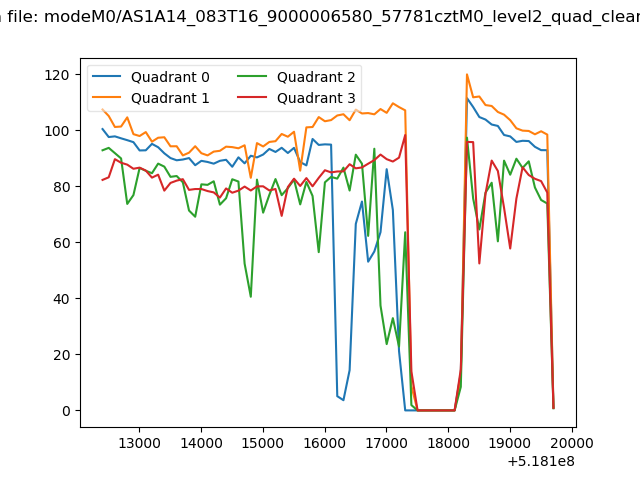 |
|
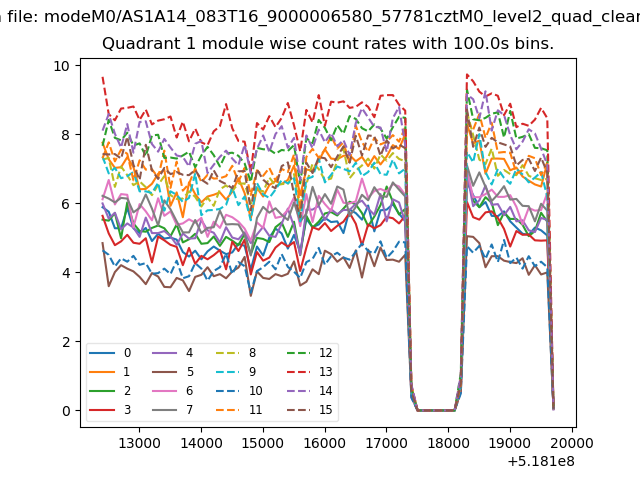
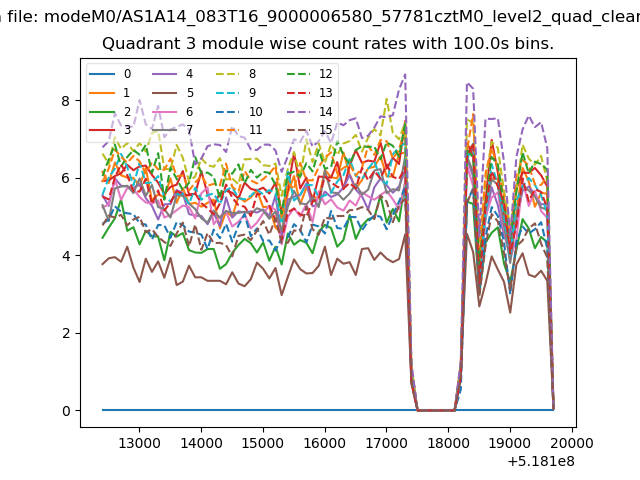
| Module-wise count rates for Quadrant A Data is divided into 100 sec bins |
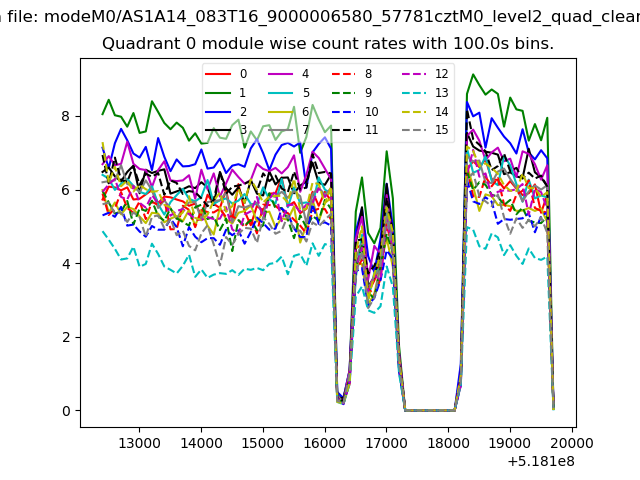 |
 |
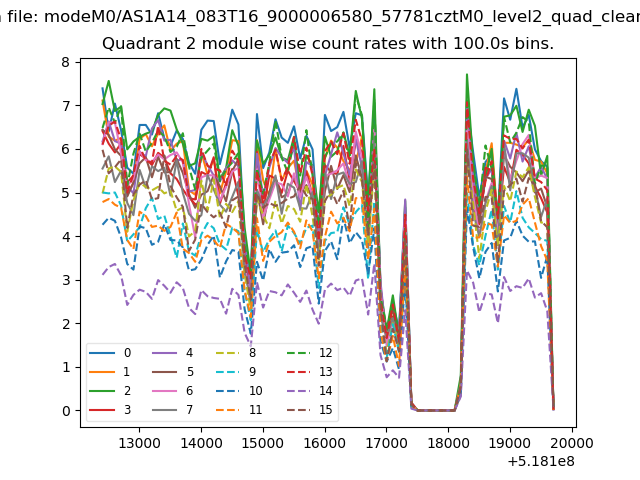
| Module-wise count rates for Quadrant B Data is divided into 100 sec bins |
 |
 |
| Module-wise count rates for Quadrant C Data is divided into 100 sec bins |
 |
 |
| Module-wise count rates for Quadrant D Data is divided into 100 sec bins |
 |
 |
| Parameter | Plot |
|---|---|
| CZT HV Monitor | 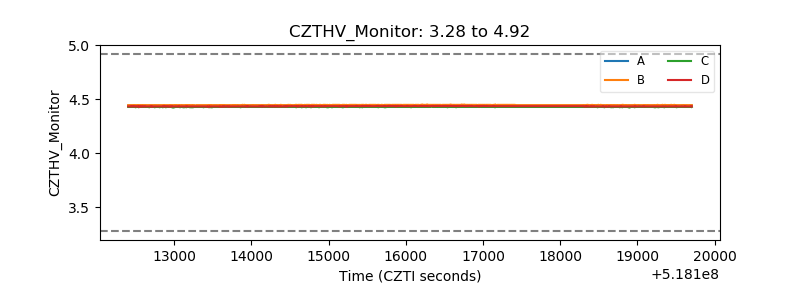 |
| D_VDD | 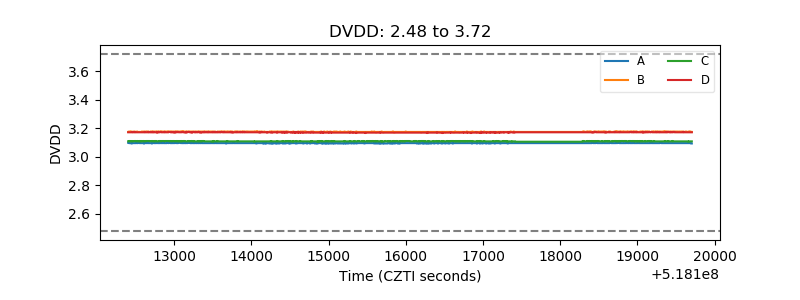 |
| Temperature 1 | 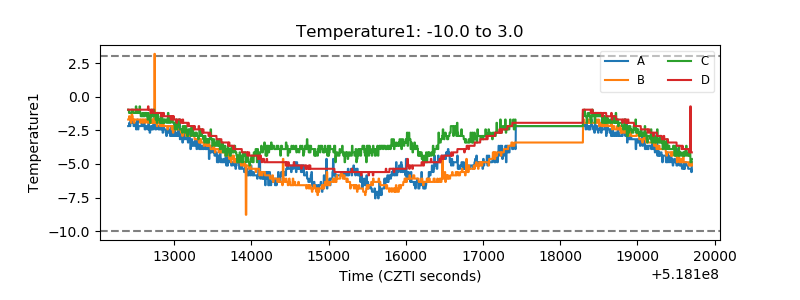 |
| Veto HV Monitor |  |
| Veto LLD | 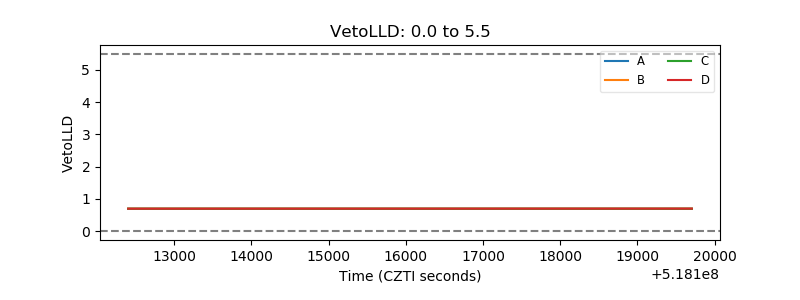 |
| Alpha Counter | 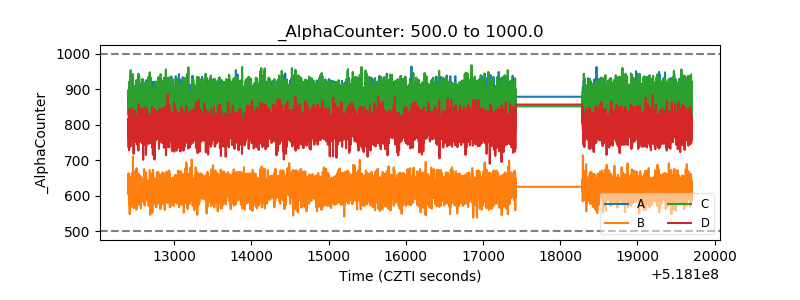 |
| _CPM_Rate | 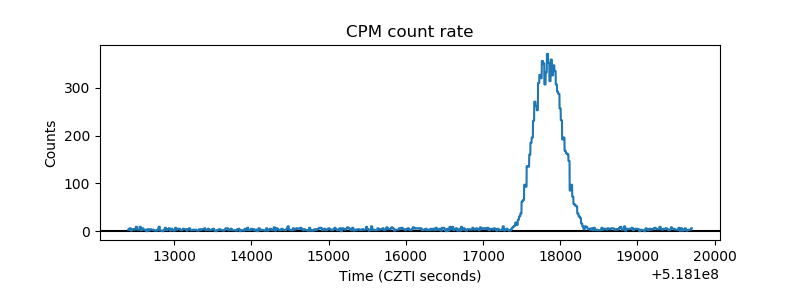 |
| CZT Counter | 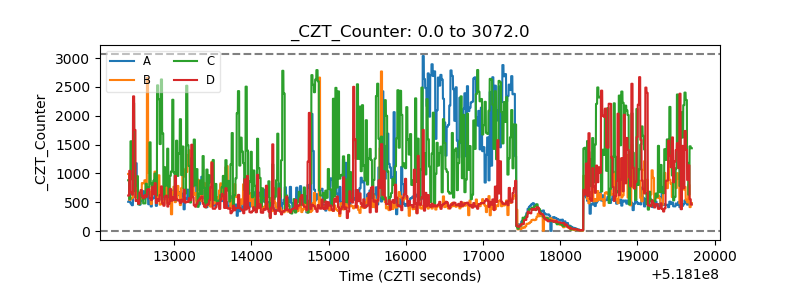 |
| +2.5 Volts monitor |  |
| +5 Volts monitor | 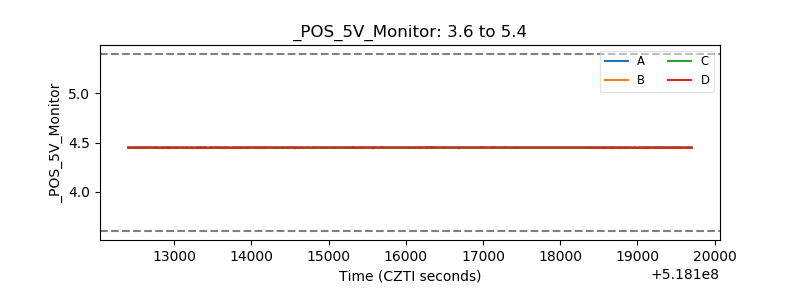 |
| _ROLL_ROT | 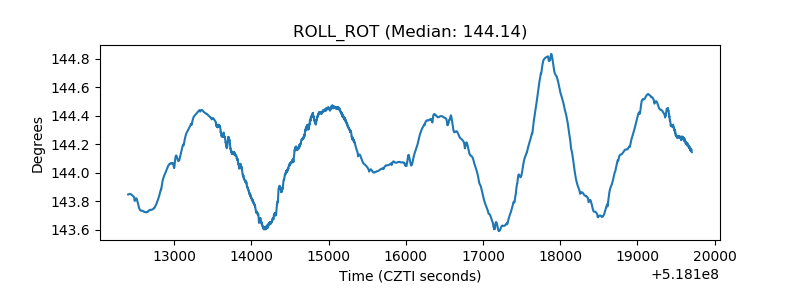 |
| _Roll_DEC | 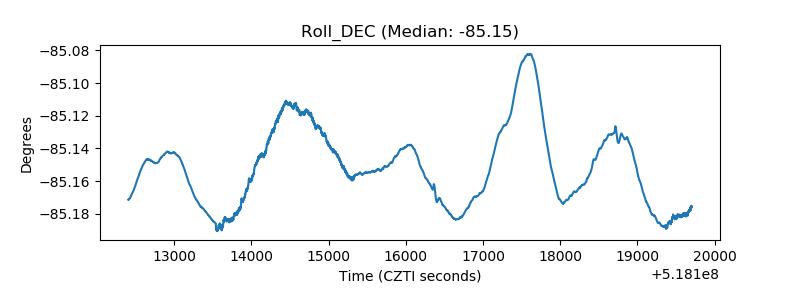 |
| _Roll_RA | 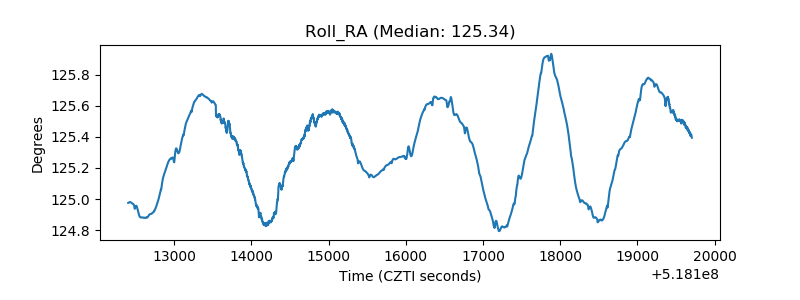 |
| Veto Counter | 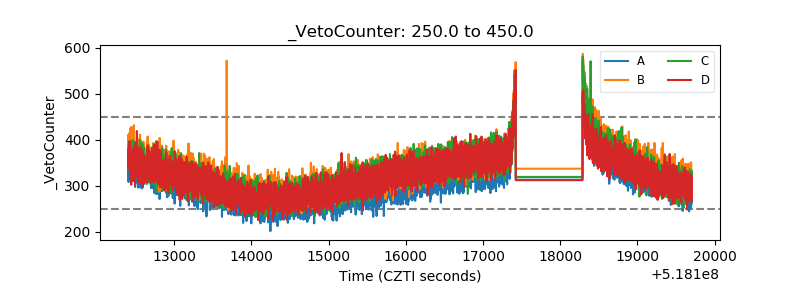 |