| Param | Original file | Final file |
|---|---|---|
| Filename | modeM0/AS1A14_083T16_9000006580_57786cztM0_level2.fits | modeM0/AS1A14_083T16_9000006580_57786cztM0_level2_quad_clean.evt |
| Size (bytes) | 1,715,235,840 | 298,062,720 |
| Size | 1.6 GB | 284.3 MB |
| Events in quadrant A | 9,929,016 | 2,077,617 |
| Events in quadrant B | 11,206,230 | 2,219,844 |
| Events in quadrant C | 28,455,394 | 1,465,408 |
| Events in quadrant D | 12,272,513 | 1,809,243 |
| Mode SS | |||
|---|---|---|---|
| Quadrant | BADHDUFLAG | Total packets | Discarded packets |
| A | 0 | 430 | 0 |
| B | 0 | 430 | 0 |
| C | 0 | 430 | 0 |
| D | 0 | 430 | 0 |
| Mode M0 | |||
|---|---|---|---|
| Quadrant | BADHDUFLAG | Total packets | Discarded packets |
| A | 0 | 44349 | 4 |
| B | 0 | 48273 | 4 |
| C | 0 | 99310 | 4 |
| D | 0 | 51553 | 4 |
| Mode M9 | |||
|---|---|---|---|
| Quadrant | BADHDUFLAG | Total packets | Discarded packets |
| A | 0 | 45 | 0 |
| B | 0 | 45 | 0 |
| C | 0 | 45 | 0 |
| D | 0 | 45 | 0 |
| Quadrant | Total seconds | Saturated seconds | Saturation percentage |
|---|---|---|---|
| A | 21092 | 76 | 0.360326% |
| B | 21092 | 274 | 1.299071% |
| C | 21093 | 4989 | 23.652397% |
| D | 21093 | 554 | 2.626464% |
Noise dominated data is calculated using 1-second bins in cleaned event files. If a bin has >2000 counts, and if more than 50% of those come from <1% of pixels, then it is considered to be noise-dominated and hence unusable.
| Quadrant | # 1 sec bins | Bins with >0 counts | Bins with >2000 counts | High rate bins dominated by noise | Noise dominated (total time) | Noise dominated (detector-on time) | Marked lightcurve |
|---|---|---|---|---|---|---|---|
| A | 25617 | 21096 | 9 | 9 | 0.04% | 0.04% | 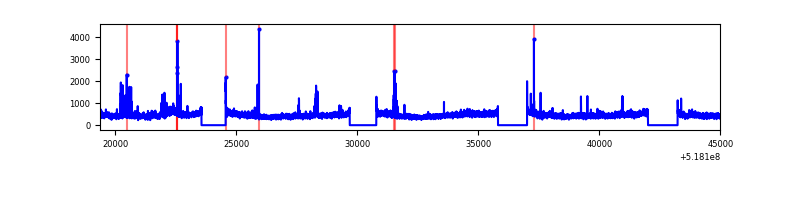 |
| B | 25617 | 21096 | 71 | 71 | 0.28% | 0.34% | 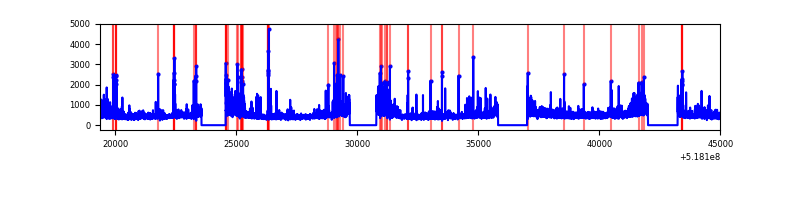 |
| C | 25618 | 21096 | 4303 | 4303 | 16.80% | 20.40% | 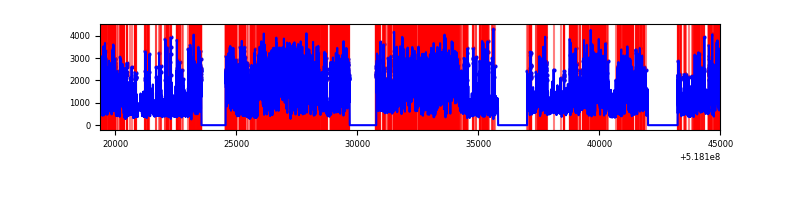 |
| D | 25618 | 21097 | 516 | 516 | 2.01% | 2.45% | 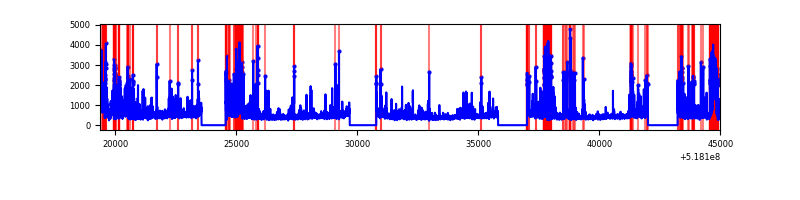 |
Top three noisy pixels from each quadrant. If the there are fewer than three noisy pixels in the level2.evt file, extra rows are filled as -1
| Pixel properties | Quadrant properties | ||||||
|---|---|---|---|---|---|---|---|
| Quadrant | DetID | PixID | Counts | Sigma | Mean | Median | Sigma |
| A | 3 | 128 | 593550 | 1079.48 | 2231 | 2179 | 547.8 |
| A | 3 | 14 | 591743 | 1076.18 | 2231 | 2179 | 547.8 |
| A | 3 | 245 | 45086 | 78.32 | 2231 | 2179 | 547.8 |
| B | 4 | 80 | 1456700 | 3158.15 | 2213 | 2129 | 460.6 |
| B | 10 | 247 | 255674 | 550.49 | 2213 | 2129 | 460.6 |
| B | 4 | 171 | 154576 | 330.99 | 2213 | 2129 | 460.6 |
| C | 9 | 38 | 16195606 | 29605.31 | 2010 | 1986 | 547.0 |
| C | 15 | 224 | 3817024 | 6974.68 | 2010 | 1986 | 547.0 |
| C | 12 | 2 | 243383 | 441.32 | 2010 | 1986 | 547.0 |
| D | 8 | 160 | 1444450 | 2376.02 | 2133 | 2035 | 607.1 |
| D | 2 | 153 | 1352753 | 2224.97 | 2133 | 2035 | 607.1 |
| D | 3 | 12 | 452845 | 742.6 | 2133 | 2035 | 607.1 |
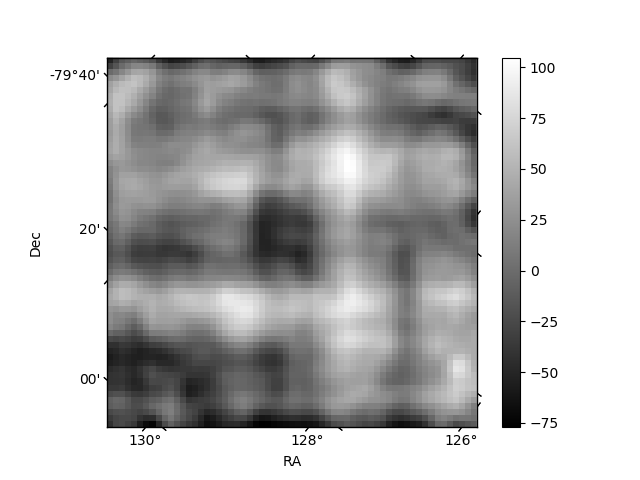
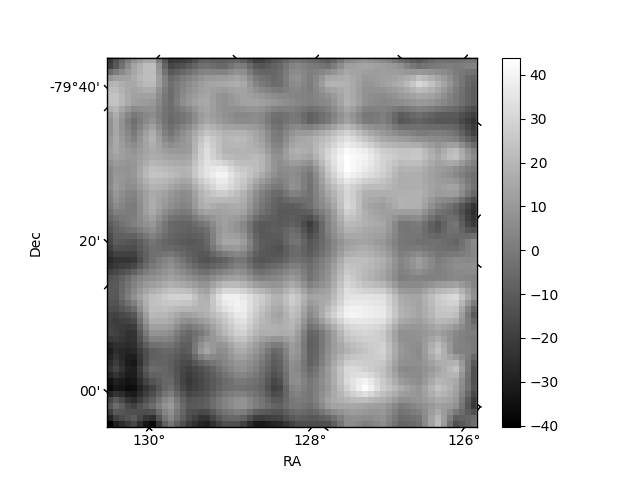
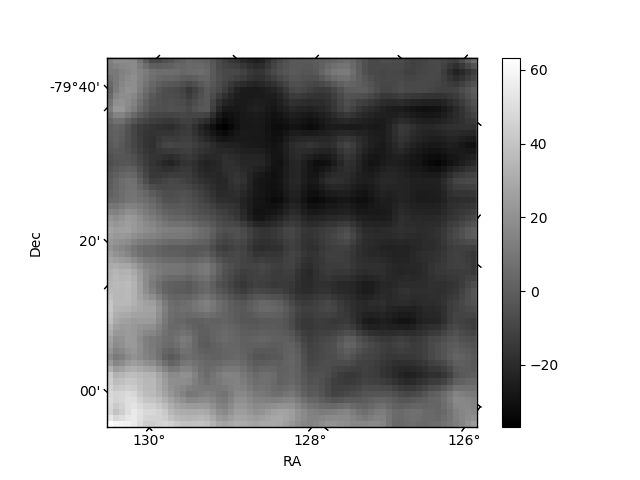
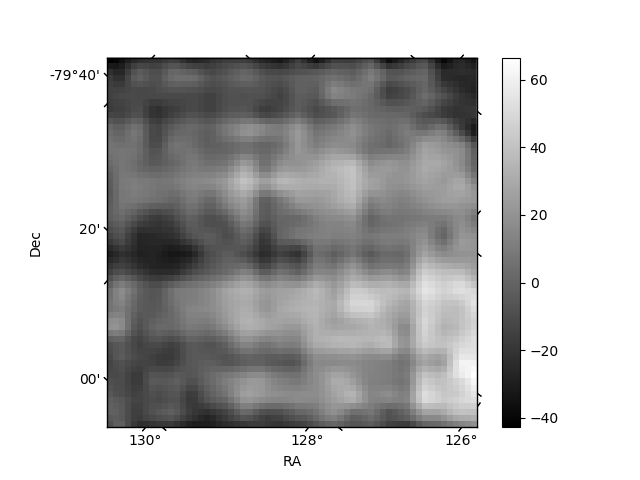
Histogram calculated using DETX and DETY for each event in the final _common_clean file
| Quadrant A | 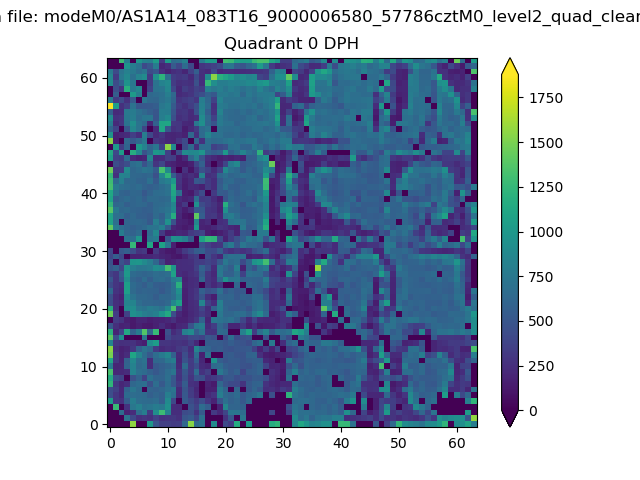 |
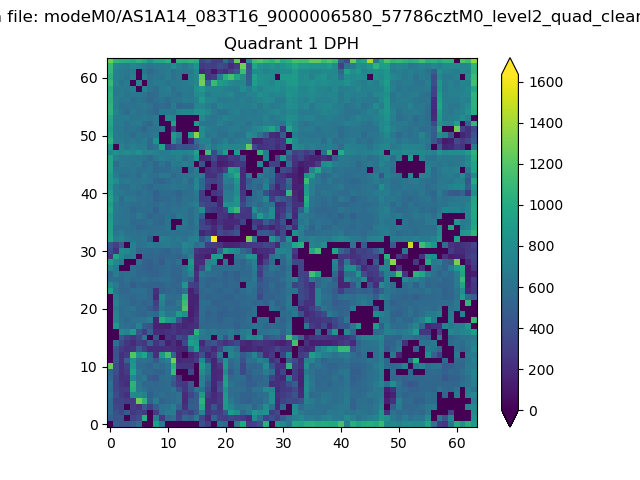 |
Quadrant B |
|---|---|---|---|
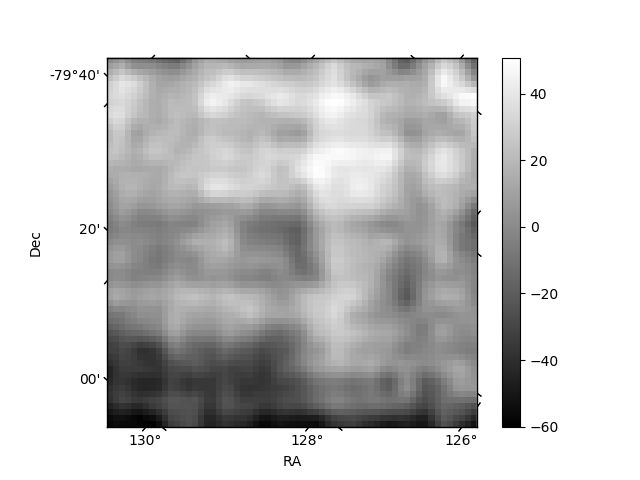
| Quadrant D | 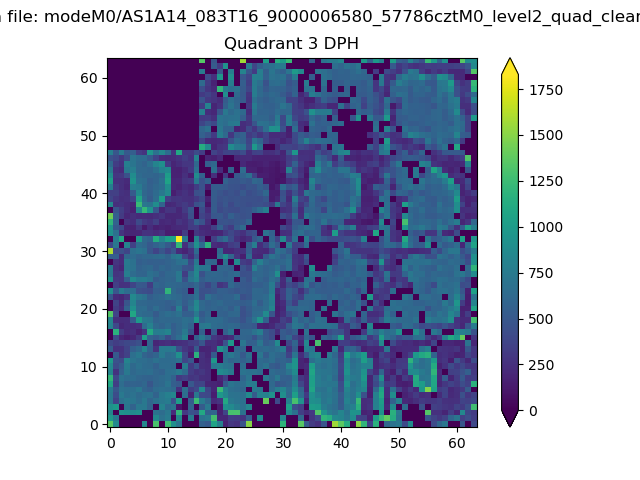 |
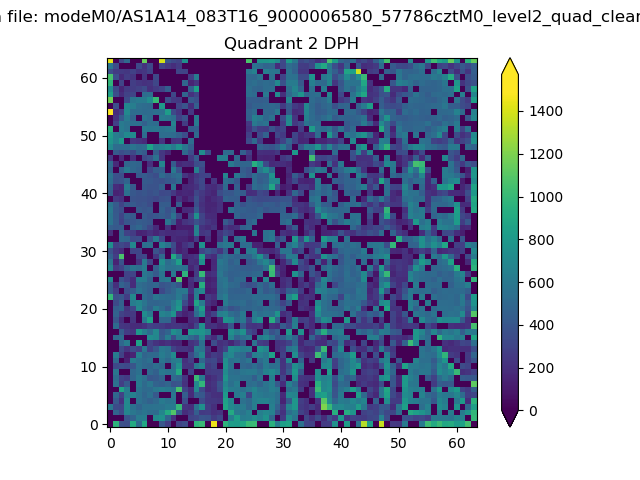 |
Quadrant C |
| Plot type | Count rate plots | Images |
|---|---|---|
| Comparison with Poisson distribution Blue bars denote a histogram of data divided into 1 sec bins. Red curve is a Poisson curve with rate = median count rate of data. |
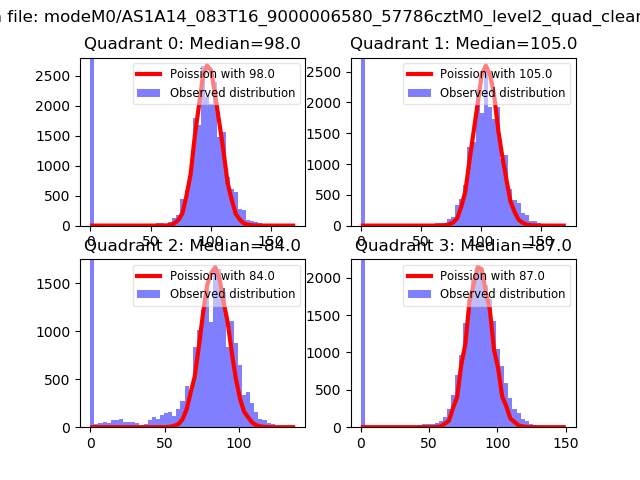 |
 |
| Quadrant-wise count rates Data is divided into 100 sec bins |
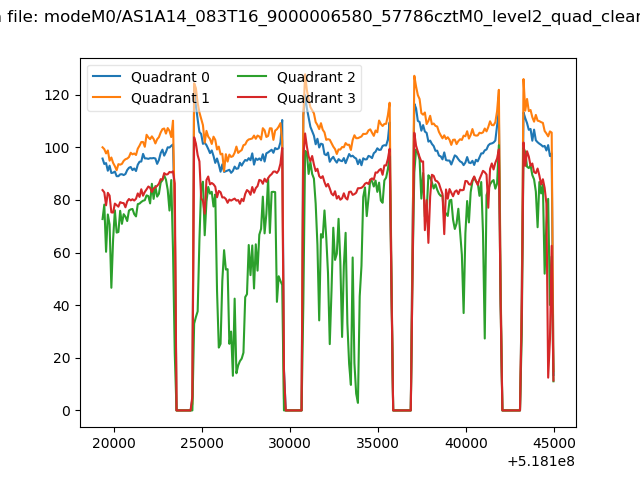 |
|
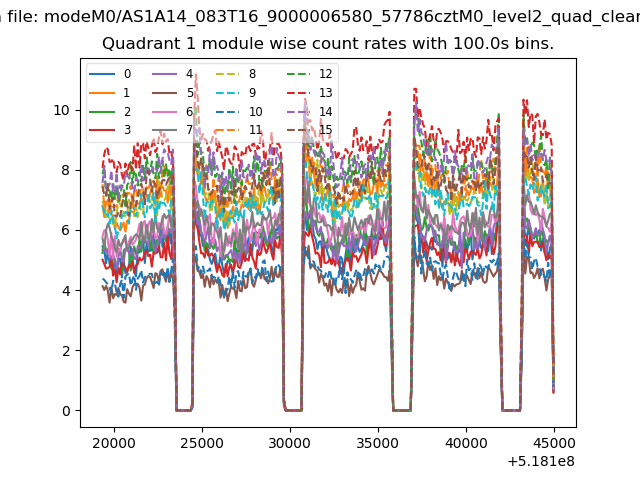
| Module-wise count rates for Quadrant A Data is divided into 100 sec bins |
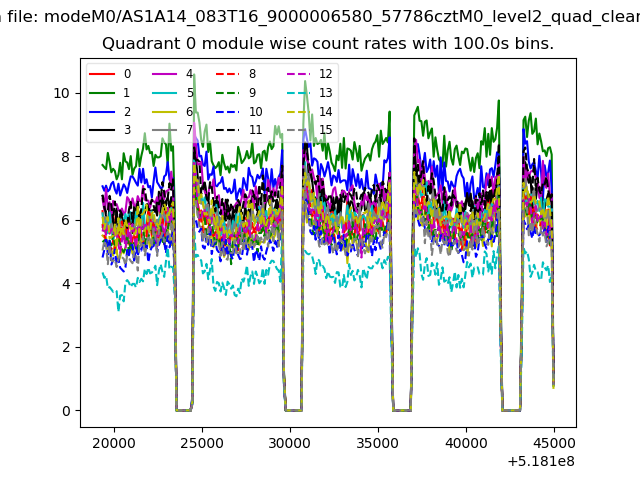 |
 |
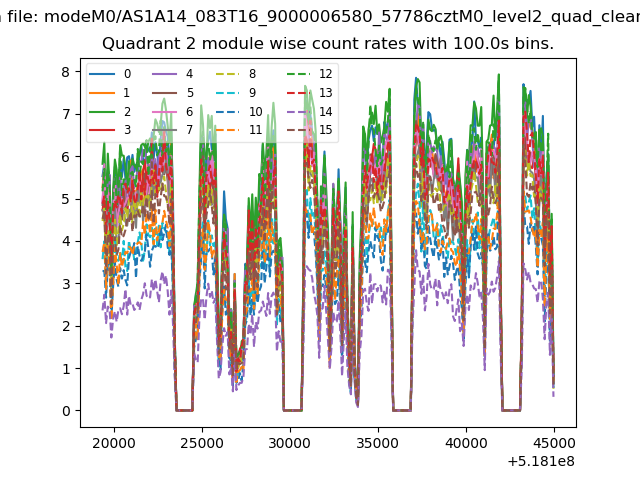
| Module-wise count rates for Quadrant B Data is divided into 100 sec bins |
 |
 |
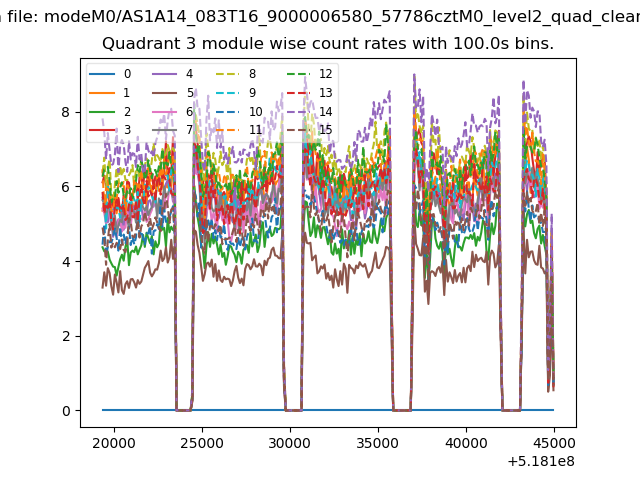
| Module-wise count rates for Quadrant C Data is divided into 100 sec bins |
 |
 |
| Module-wise count rates for Quadrant D Data is divided into 100 sec bins |
 |
 |
| Parameter | Plot |
|---|---|
| CZT HV Monitor | 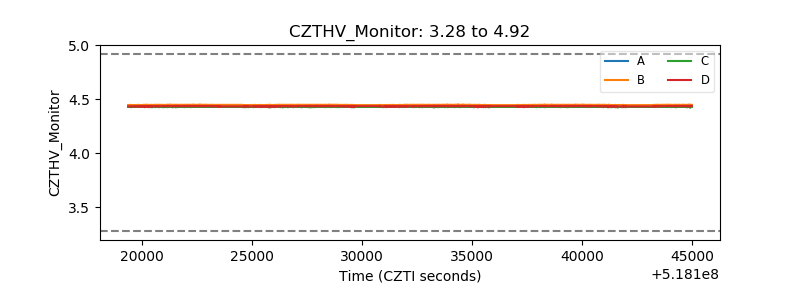 |
| D_VDD | 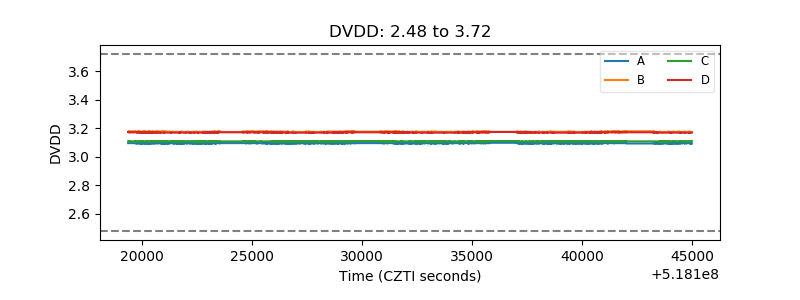 |
| Temperature 1 | 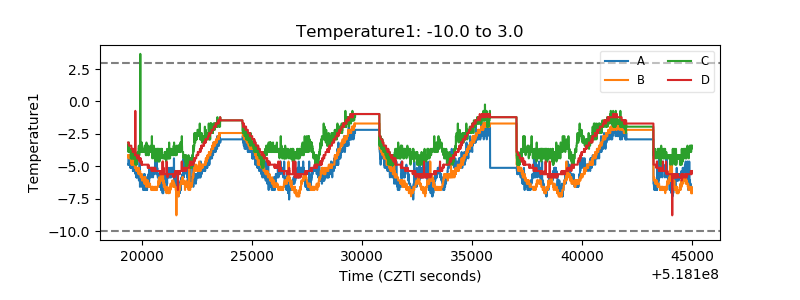 |
| Veto HV Monitor | 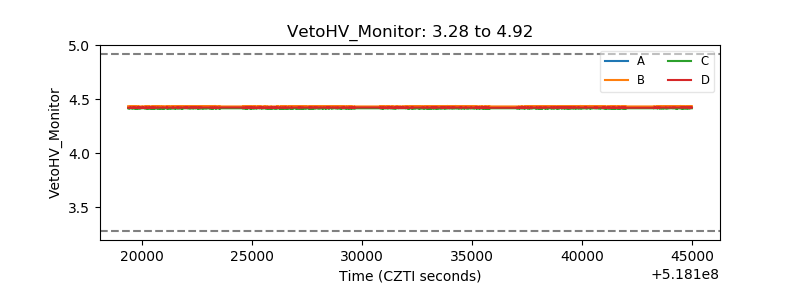 |
| Veto LLD | 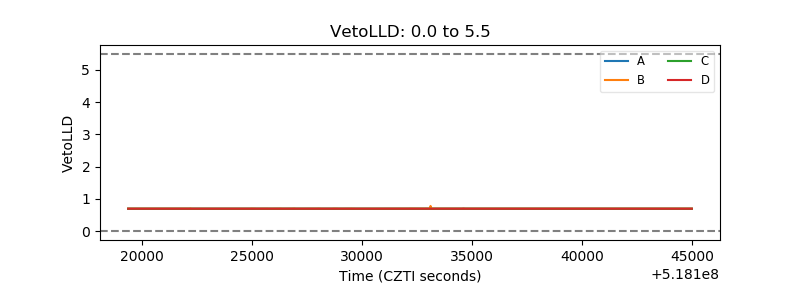 |
| Alpha Counter |  |
| _CPM_Rate | 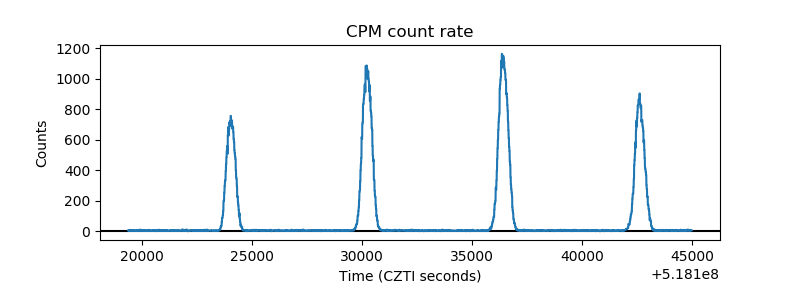 |
| CZT Counter | 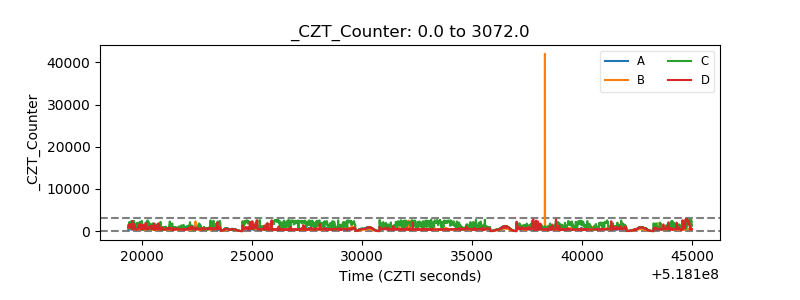 |
| +2.5 Volts monitor | 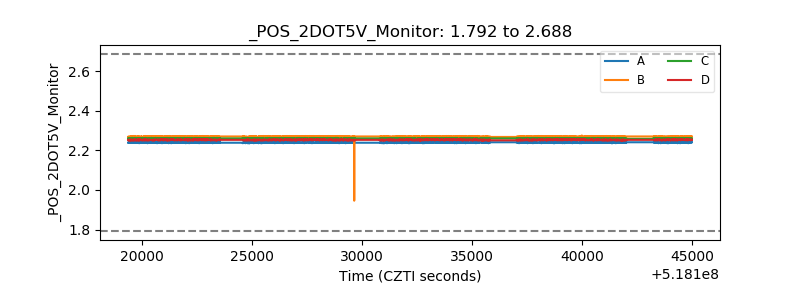 |
| +5 Volts monitor |  |
| _ROLL_ROT | 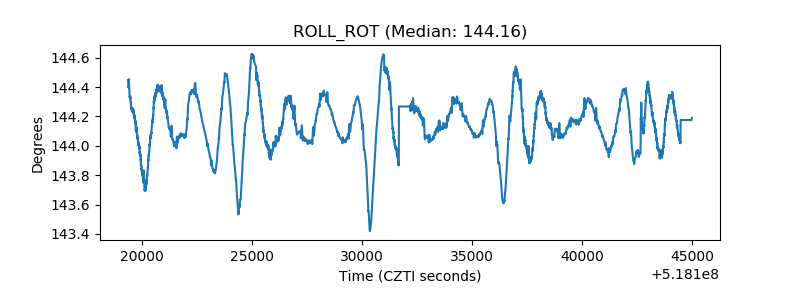 |
| _Roll_DEC | 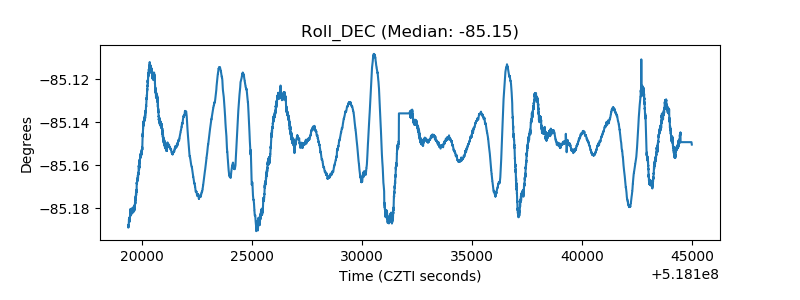 |
| _Roll_RA | 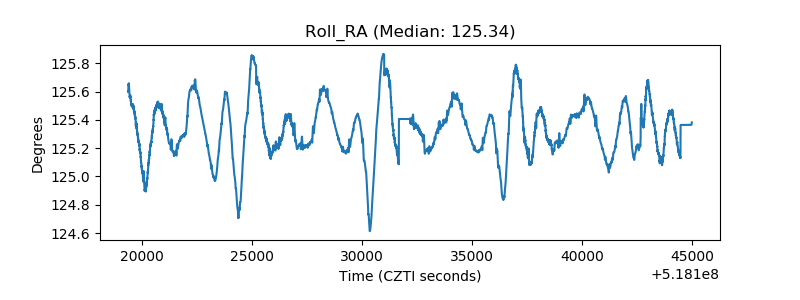 |
| Veto Counter | 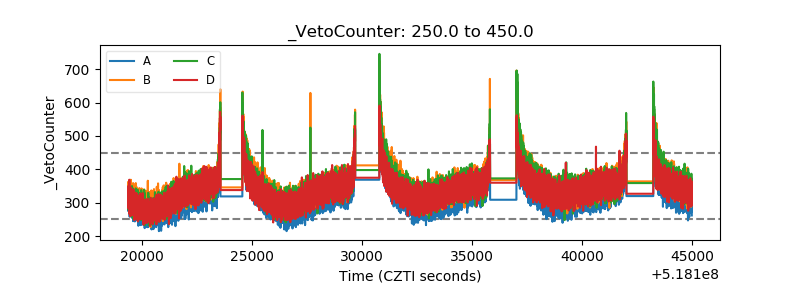 |